



Column Designer
Documentation
Introduction to Column Designer
What is Column Designer?
Column Designer is a comprehensive web-based software package for the analysis and design of concrete, reinforced concrete, and composite concrete columns. It supports both direct design and advanced analysis-based workflows, allowing engineers to efficiently evaluate column behavior under axial force, bending, and slenderness effects.
The program provides ready-to-use templates for common project types, including Building Frame Column, Bridge Pier, and Shear Wall, as well as tools for Retrofit Assessment.
Analysis & Design Capabilities
Column Designer supports interactive analysis and design, allowing users to immediately see the impact of input changes on results.
Column design options include:
Direct design for specified axial loads and moments
Automatic calculation of magnified moments due to slenderness
Support for sway and non-sway conditions
Code-based sway/non-sway checks
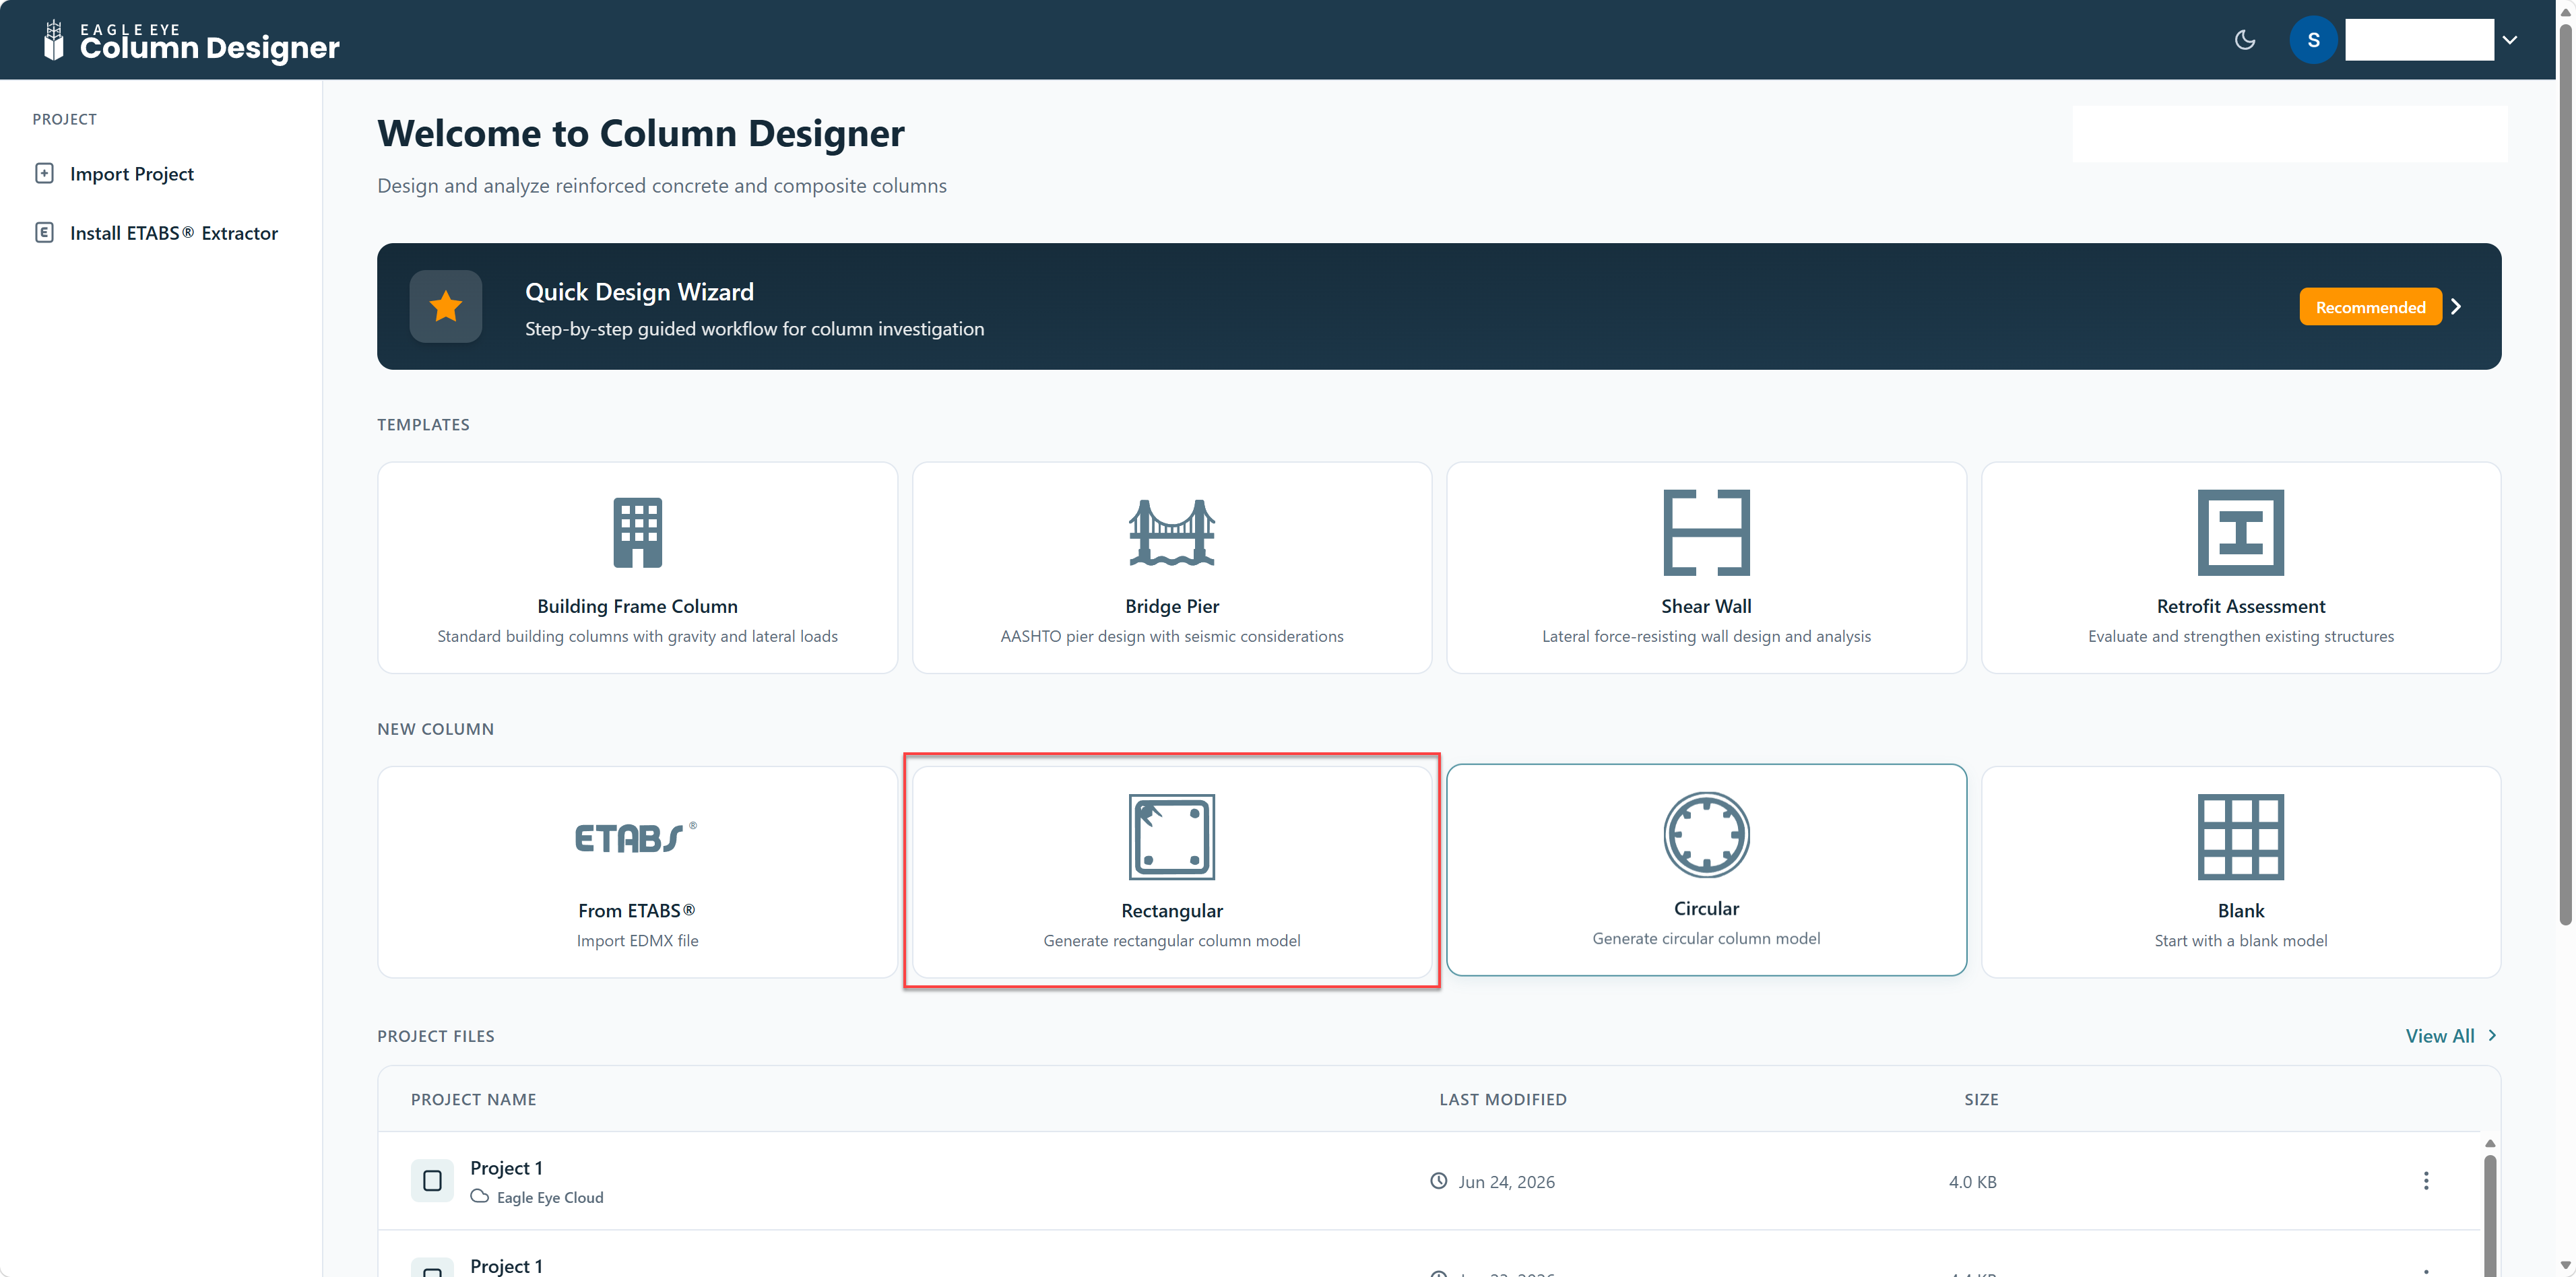
Figure: Overall analysis and design process in Column Designer
Effective Length Factor Evaluation
Column Designer can automatically determine the Effective Length Factor (K) based on:
Column framing conditions
End restraints
Code-specified criteria
This allows accurate consideration of global stability effects without manual estimation.
Automatic Reinforcement Design
An Auto Design Tool is available to:
Select optimum reinforcement layouts
Follow user-defined design rules
Satisfy axial and moment demand efficiently
This significantly reduces trial-and-error during reinforcement selection.
Results & Output
Column Designer generates a wide range of analytical and design results, including:
Capacity interaction surfaces
P–M interaction curves
M–M interaction curves
Moment–curvature relationships
Flexural stress contours
Reporting & Documentation
Column Designer can generate customizable design reports as part of the analysis and design process.
Reports can be:
Automatically generated
Customized with additional text
Enhanced with user-selected graphics
Cross-Section Modeling & Reinforcement Tools
Parametric Shapes
Column Designer provides a rich library of predefined shapes, including:
Solid sections
Hollow sections
Flanged sections
Composite sections using Standard Steel Database Shapes
Shape Editing & Construction
Users can:
Merge multiple shapes
Edit dimensions
Draw custom geometries
Create complex cross-sections efficiently
Advanced tools are provided for:
Aligning shapes
Stacking shapes
Precise placement
Reinforcement Modeling
Reinforcement can be placed anywhere within the cross-section using flexible placement options.
Supported rebar patterns:
Point
Line
Rectangle
Circle
Key Features
Design and Analysis Capabilities
Column Designer provides comprehensive tools for column analysis and design, supporting both simple and advanced workflows.
Key capabilities include:
Guided column design using the Quick Design Wizard
Import of columns from ETABS, including materials, sections, loads, and framing
Design of columns in accordance with user-specified design codes
Definition of any number of load combinations for sway and non-sway conditions
Application of loads using:
Detailed mode for slender columns
Simple mode for short columns
Analysis and design considering slenderness effects
Automatic determination of optimum reinforcement using user-defined parameters through the Auto Design feature
Slenderness Considerations
Column Designer provides robust tools to evaluate and design columns considering slenderness effects.
Features include:
Definition of column framing or import from ETABS
Code-specific checks for sway and non-sway conditions
Automatic determination of the Effective Length Factor (K) based on:
Framing configuration
End conditions
Integrated analysis and design accounting for slenderness effects
Cross-Section Generation
Column Designer offers powerful and flexible tools for defining and editing column cross-sections.
Section Definition and Editing
Define and edit multiple column sections simultaneously
Create rectangular and circular columns using simple tools
Import sections from:
ETABS
Text files
DXF files
Parametric and Composite Sections
Use predefined parametric shapes, including:
Solid sections
Hollow sections
Flanged sections
Access a large library of Standard Steel Shapes
Create complex sections by combining:
Basic concrete shapes
Basic steel shapes
Standard steel shapes
User-defined shapes
Merge shapes of different geometries to form complex cross-sections
Reinforcement Modeling
Add reinforcement of any size anywhere within the cross-section
Use multiple reinforcement placement patterns
Apply reinforcement sets
Material Properties
Column Designer allows realistic modeling of material behavior using built-in stress–strain relationships.
Features include:
Nonlinear stress–strain curves for concrete
Stress–strain models for steel reinforcement
Accurate representation of material behavior for analysis and design
Results Generated
Column Designer generates detailed analytical and design results to support both evaluation and reporting.
Geometric and Stress Results
Computation and reporting of:
Cross-sectional area
Moments of inertia
Shear area
Reinforcement area
Plotting of flexural stress contours due to axial load and biaxial bending (P, Mx, My)
Capacity and Interaction Results
Generation of capacity interaction surfaces
Detailed P–M diagrams, including:
Axial load capacity
Major moment capacity
Forces in concrete and reinforcement
Strain distribution
Neutral axis depth
Plotting of multiple P–M or M–M curves in a single graph by varying:
Concrete compressive strength (fc′)
Steel yield strength (fy)
Reinforcement sizes
Advanced Performance Evaluation
Generation of moment–curvature curves for arbitrary column shapes
Evaluation of column performance and ductility
Display of the location and orientation of the neutral axis for specific loading conditions
Computation of capacity ratios using different methods
Verification of section adequacy for specified load combinations
Design of columns in accordance with the selected design code
Miscellaneous Features
Additional features enhance usability and reporting efficiency:
Modeling of composite cross-sections using multiple materials
Support for US and SI unit systems
Creation of customized reports with user-added text
Display of a summary of critical information for all columns, including:
Governing load combination
Reinforcement configuration
Reinforcement ratio
Corresponding D/C ratio
Generation of a one-page summary report for all columns in the Project File
Terminology
Some important terms that require clear understanding to help make the program more useful are defined below.
Project File
A Project File is where newly defined or pre-created columns can be saved for later use.
Several columns can be added and managed within a single Project File.
Column
A Column is a complete structural member that includes:
A cross-section
Framing conditions
Load combinations
Section
A Section is a combination or collection of shapes placed together to act as a single cross-section.
Section properties are computed at the section level
Analysis and design are performed for a section, not for individual shapes
(unless the section contains only one shape)
Figure shows a section made up of two shapes.
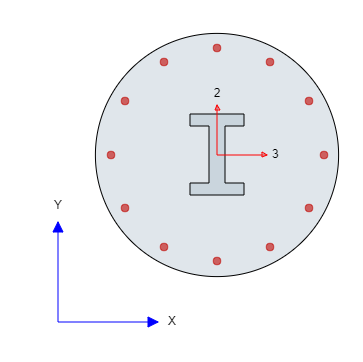
Figure: Section made of two shapes.
Shape
A Shape is the basic geometric component used to create sections.
Key characteristics:
Rebar can be added to individual shapes or anywhere within the section
Predefined shapes from standard libraries can be used and modified parametrically
Shapes can be combined to form complex sections
Tools available to create shapes include:
Draw Menu → Concrete Shapes
Draw Menu → Steel Shapes
Draw Menu → Add Shapes → Shape Library
Draw Menu → Add Shapes → Steel Shapes
Draw Menu → Add Shapes → Coordinates
Shapes can also be imported from:
.txt files
.DXF files
.csv files
using the tools under Draw Menu → Import Shapes.
Notes on importing rebars
Format for importing rebars:
(x-coordinate, y-coordinate, rebar diameter)If the imported file contains rebar diameters larger than those defined in the Project:
The user must add the new diameters to Rebar Sets under
Options → General → Rebar Sets before importingOtherwise, the program will automatically assign the maximum available diameter from the Rebar Sets
Shape Library
The Shape Library is a collection of standard predefined shapes that can be:
Edited parametrically (by specifying dimensions), or
Imported from standard databases
The software includes several built-in shape libraries.
Modes
Column Designer operates in three different modes:
1. Selection Mode
Selection Mode is activated when Edit Menu → Select is clicked.
In Selection Mode:
Shapes can be selected but not edited directly using the mouse
Shapes can be edited using the Property Grid
Shapes can be aligned using:
- Edit Menu → Align
Shapes can be moved using:
- Edit Menu → Edit → Move Sections
2. Drawing Mode
Drawing Mode is activated when drawing options are selected from:
Home Menu → Draw → Rebars
Home Menu → Draw → Shapes
Draw Menu → Rebars
Draw Menu → Concrete Shapes
Draw Menu → Steel Shapes
In Drawing Mode:
The cursor changes to a “+” symbol
Multiple objects can be drawn consecutively
Drawing Mode can be exited by pressing the Esc key
3. Results Mode
Results Mode is activated when column results are viewed from:
Results Menu, or
Project Explorer → Columns → Results
In Results Mode:
No changes to the section are allowed
Tools under the Edit Menu and Draw Menu are disabled
To exit Results Mode and modify the section:
- Select the desired section from Project Explorer → Columns
Axis
Various editing operations, computed properties, and shape locations are referenced to the global X and Y axes.
Two coordinate systems are used in Column Designer:
X–Y Axis System
A global, fixed reference on the screen
Used to locate shapes relative to a common origin
2–3 Axis System
Indicates the location of the section’s centroid
The origin changes as the shape size or location changes
Provided for compatibility with the member local axis system used in CSI programs such as SAP2000 and ETABS
In CSI programs:
- The 1–1 axis passes through the member’s longitudinal axis
Figure illustrates a section showing the local axes.
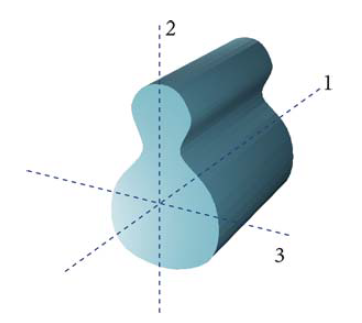
Figure: Section in 3D showing local axes.
Results and Output
Column Designer generates the following types of results:
Section Properties
Stress Distribution
Magnified Moments
Section Capacity
Moment–Curvature
Multiple Curves
Section Properties
Column Designer reports the following properties for the selected section:
Basic Properties
Cross-sectional area
Shear areas
Moments of inertia
Torsional constant
Section Bounds
Overall section dimensions
Centroid location with respect to:
Global origin
Local origin
Additional Properties
Radii of gyration
Section moduli
Rebar Properties
Total reinforcement area
Reinforcement ratio of the selected section
Note:
For composite sections, concrete is considered as the base material, and the transformed section properties are reported.
Stress Distribution
Column Designer can display flexural stress distribution on the section for a selected load combination and section location.
Key features include:
Stress displayed as color-coded contours
Visualization available in:
2D view
3D view
Stress contours shown directly in the working area
Magnified Moments
Column Designer performs detailed slenderness calculations to determine magnified design moments for both sway and non-sway loading conditions, in accordance with the selected design code.
The final design loads can be viewed from:
Results Menu → Capacity → Design Loads, or
Project Explorer → Columns → Results → Design Loads
The Design Loads form allows the user to:
Select loading direction:
Along X
Along Y
View magnified moments corresponding to:
Mux (moment about the X-axis)
Muy (moment about the Y-axis)
Magnified moments are calculated based on the selected design code.
Currently supported design codes include:
ACI 318-19
ACI 318-14
ACI 318-11
ACI 530-11
AASHTO LRFD 2020
AS 3600-18
BS 8110-97
Chinese 2010
CSA A23-3-14
Eurocode 2:2004
Hong Kong CP: 2013
IS 456: 2000
Italian NTC 2008
KBC 2016
Mexican RCDF: 2017
NZS 3101: 2006
Singapore CP 65-99
TS 500: 2000
Section Capacity
Section capacity can be obtained using the following approaches.
P–M Interaction Curves
Capacity interaction curves are displayed in the following forms:
Interaction Surface
A 3D color-coded plot showing the variation of:
Axial load (P)
Moment about local 2-axis (M2)
Moment about local 3-axis (M3)
P–M Curve
Load–moment interaction curves showing the relationship between:
Axial load capacity
Resultant moment capacity
Curves are generated for a specified neutral axis angle
M–M Curve
Moment–moment interaction curves showing the relationship between:
Moment capacity about the local 2-axis
Moment capacity about the local 3-axis
Generated for a specified axial load level
Note:
Although Column Designer can generate capacity curves for any section and combination of shapes and materials, users should ensure that the results are valid and applicable for the intended design scenario.
Capacity Ratio Check
Column Designer can calculate and report capacity ratios for column sections using the following methods:
Moment Sum at P
Moment Vector at P
Axial Capacity Ratio
In addition, the program reports:
Resultant moment
Resultant moment angle
Neutral axis angle
Neutral axis depth
The section adequacy is determined based on the maximum capacity ratio obtained from the different methods:
Capacity ratio ≤ 1.0 → Section is adequate
Capacity ratio > 1.0 → Section is inadequate
Note:
The neutral axis depth is calculated for the nominal moment corresponding to the factored axial force on the relevant P–M interaction curve for the selected moment direction.
Moment–Curvature
Moment–curvature curves can be generated:
For any orientation of the neutral axis
For a specified level of axial load
These curves are useful for evaluating section performance and ductility.
Multiple Curves
Column Designer allows multiple P–M or M–M diagrams to be plotted on the same graph by varying:
Concrete compressive strength (fc′)
Steel tensile strength (fy)
Reinforcement sizes
This feature enables comparative studies of material properties and reinforcement configurations.
Auto Design
The Column Auto Design feature is a highly effective and efficient tool for designing reinforcement for both sway and non-sway columns, with or without consideration of slenderness effects.
The Auto Design tool designs the column section based on user-defined design parameters, including:
Selected design codes
User-specified design criteria
The program automatically optimizes the column design to satisfy a user-defined maximum capacity ratio limit.
Design constraints that can be specified by the user include:
Maximum rebar size
Minimum rebar size
Maximum allowable rebar ratio in the section
By applying these constraints, Column Designer identifies an optimum reinforcement layout that meets both strength and code requirements while maintaining design efficiency.
This feature is explained in further detail in Designing Column.
The Column Designer Interface
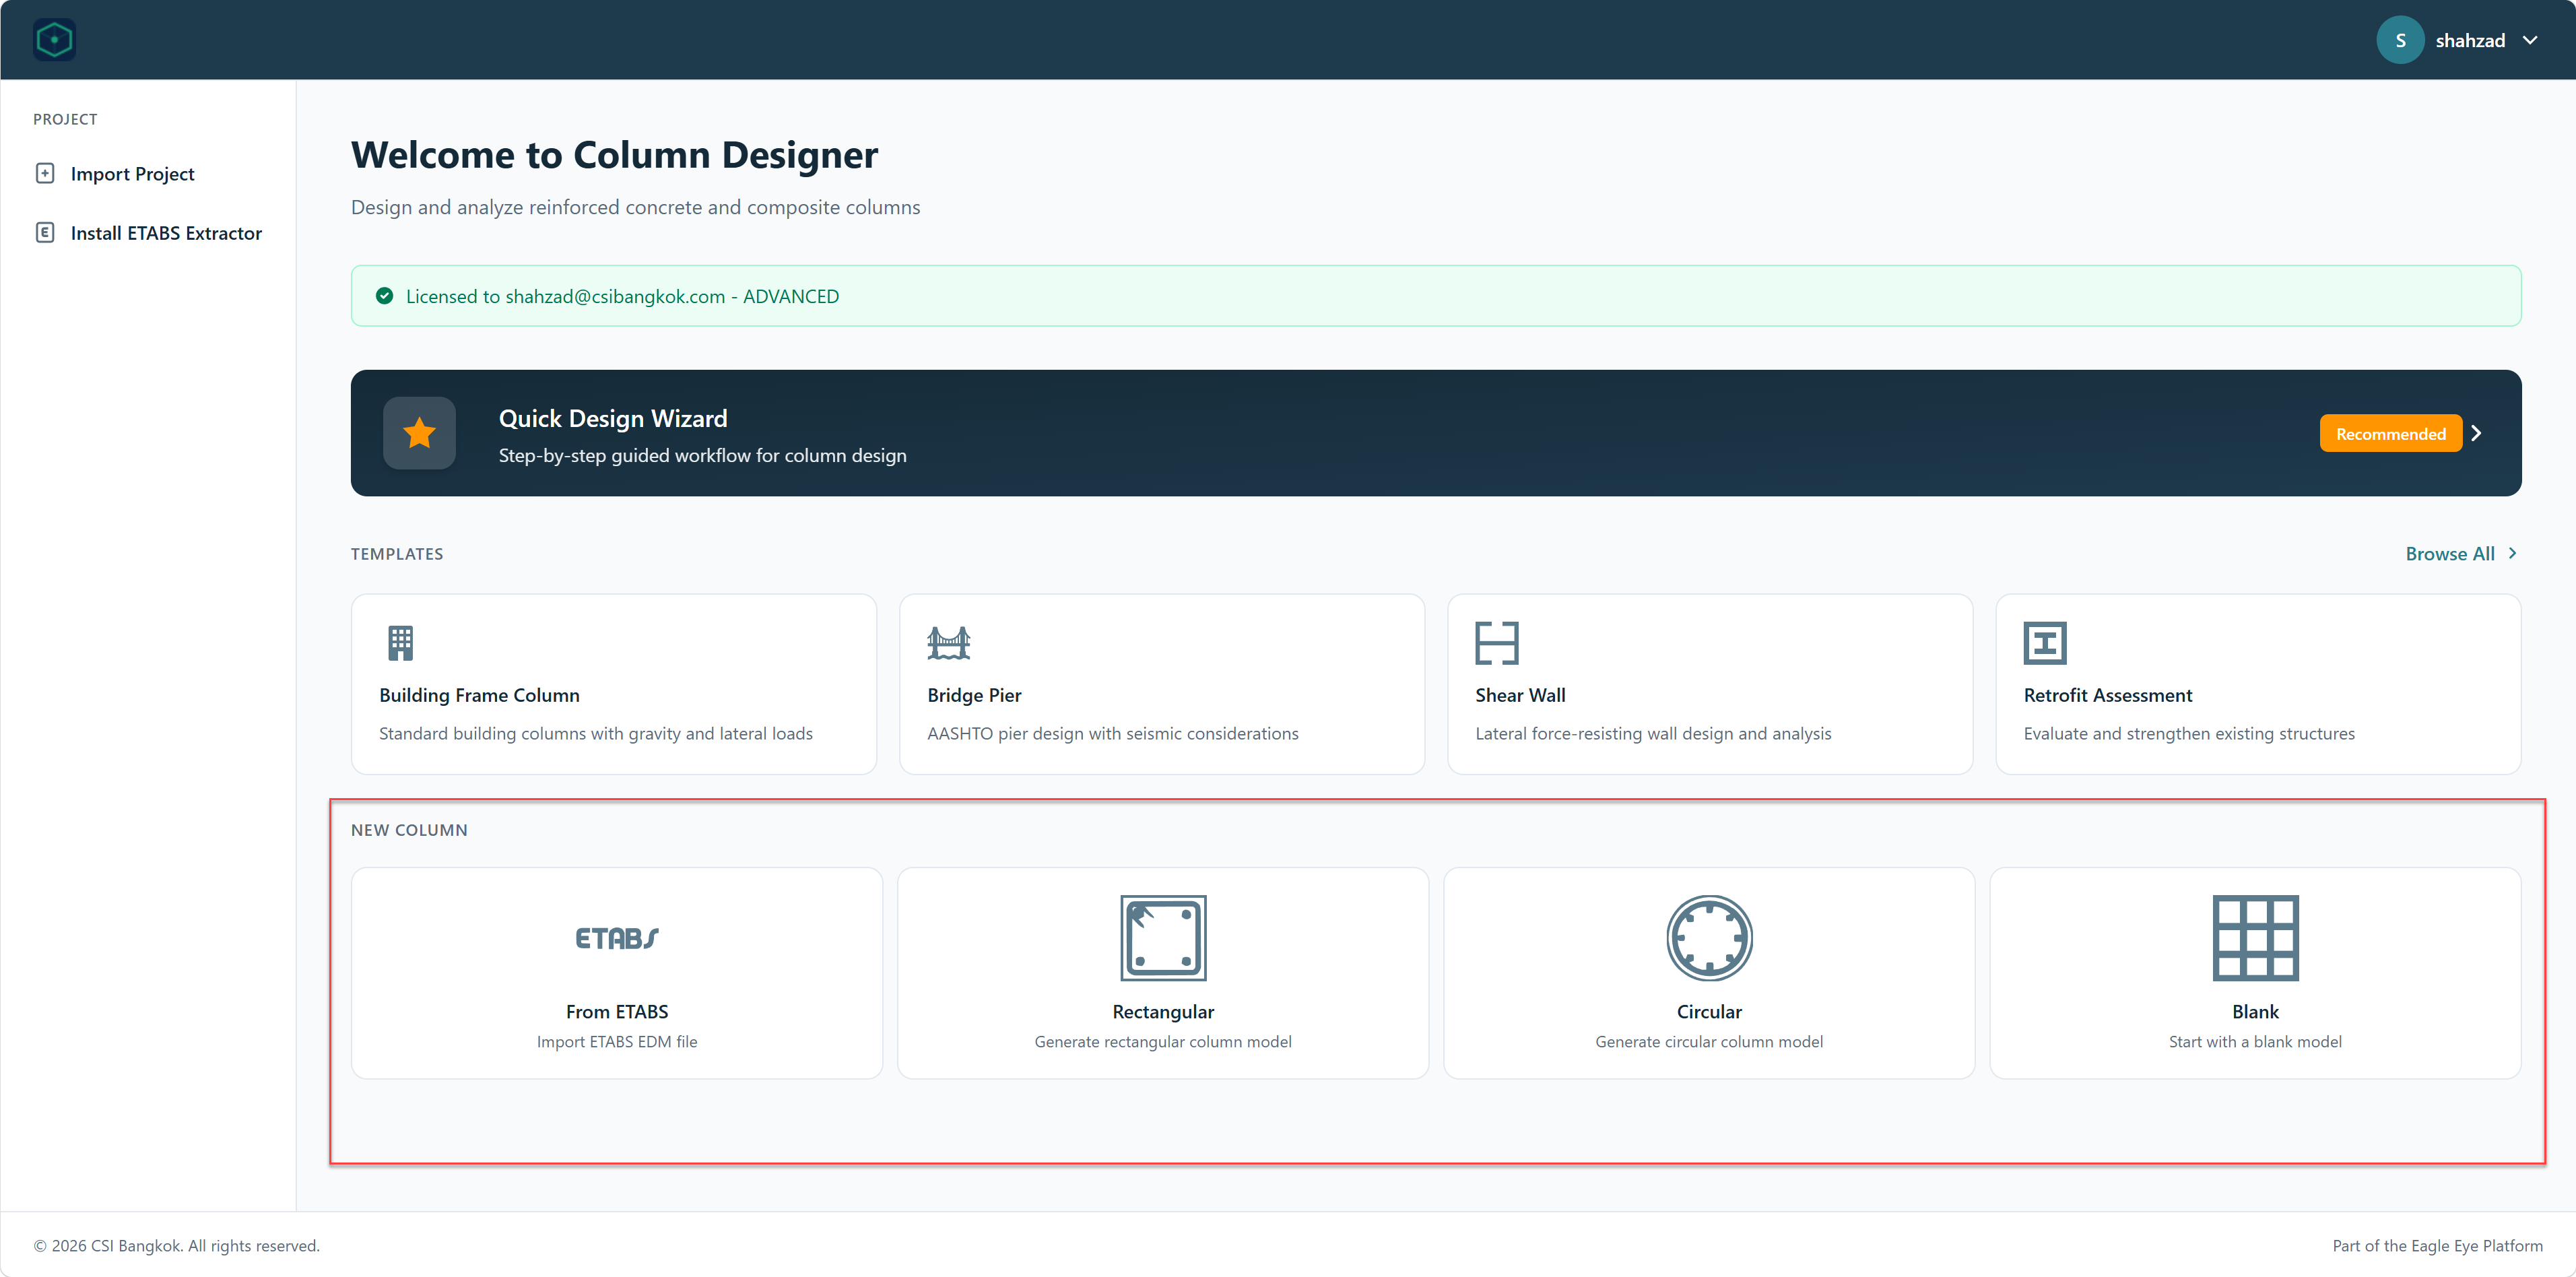
Upon launching Column Designer, users are presented with a clean, browser-based home screen organized into the following areas:
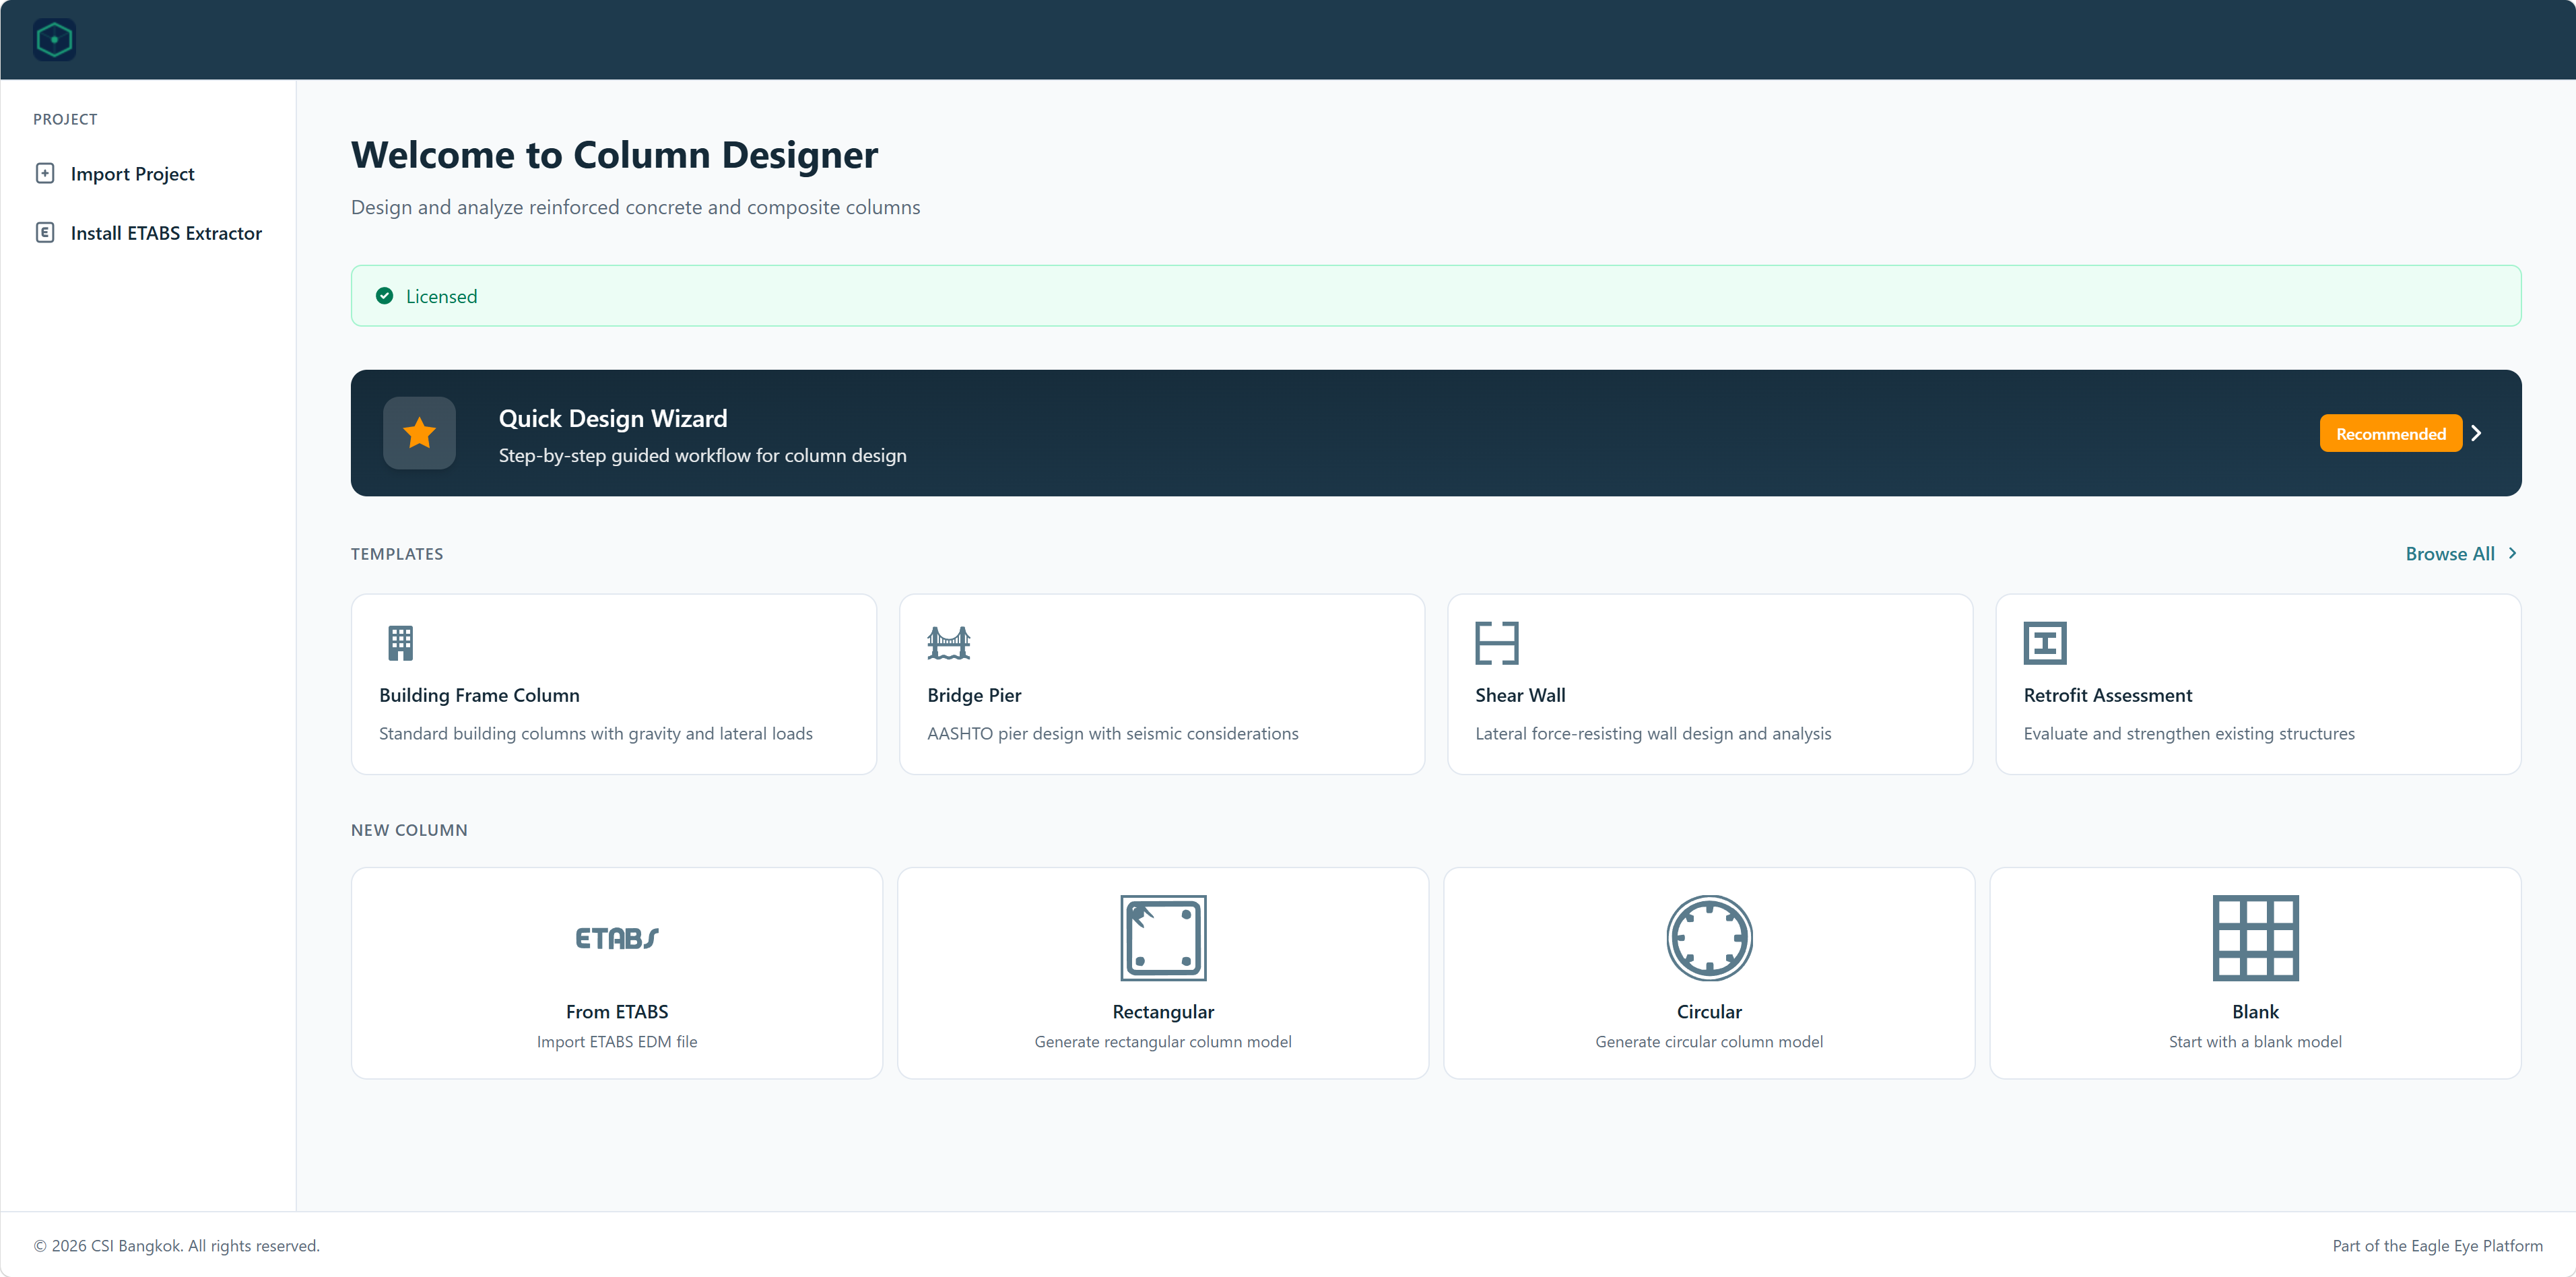
Quick Design Wizard A highlighted panel at the top, a step-by-step guided workflow that walks users through the column design process from start to finish. This is the recommended starting point for new users.
Templates Four project templates are available for common design scenarios:
Building Frame Column: Design reinforced concrete building columns
Bridge Pier: Design of bridge substructure piers
Shear Wall: Core sections under combined axial load and bending
Retrofit Assessment: Evaluate and strengthen existing structures
New Column
From ETABS: Import an ETABS EDM file directly
Rectangular: Generate a rectangular column model
Circular: Generate a circular column model
Blank: Start from scratch with a blank model
Navigation Panel The left sidebar provides access to project-level actions, including importing an existing project and installing the ETABS Extractor for data exchange.
Using Column Templates
Column Designer provides ready-to-use templates to streamline project setup. Each template pre-configures the relevant parameters for a specific column type, helping users get started quickly.
To use a template, select it from the home screen. A configuration dialog will open where parameters can be reviewed and adjusted before the project is created.
Building Frame Column Template
The Building Frame Column template is intended for standard reinforced concrete columns in building structures subjected to gravity and lateral loads.
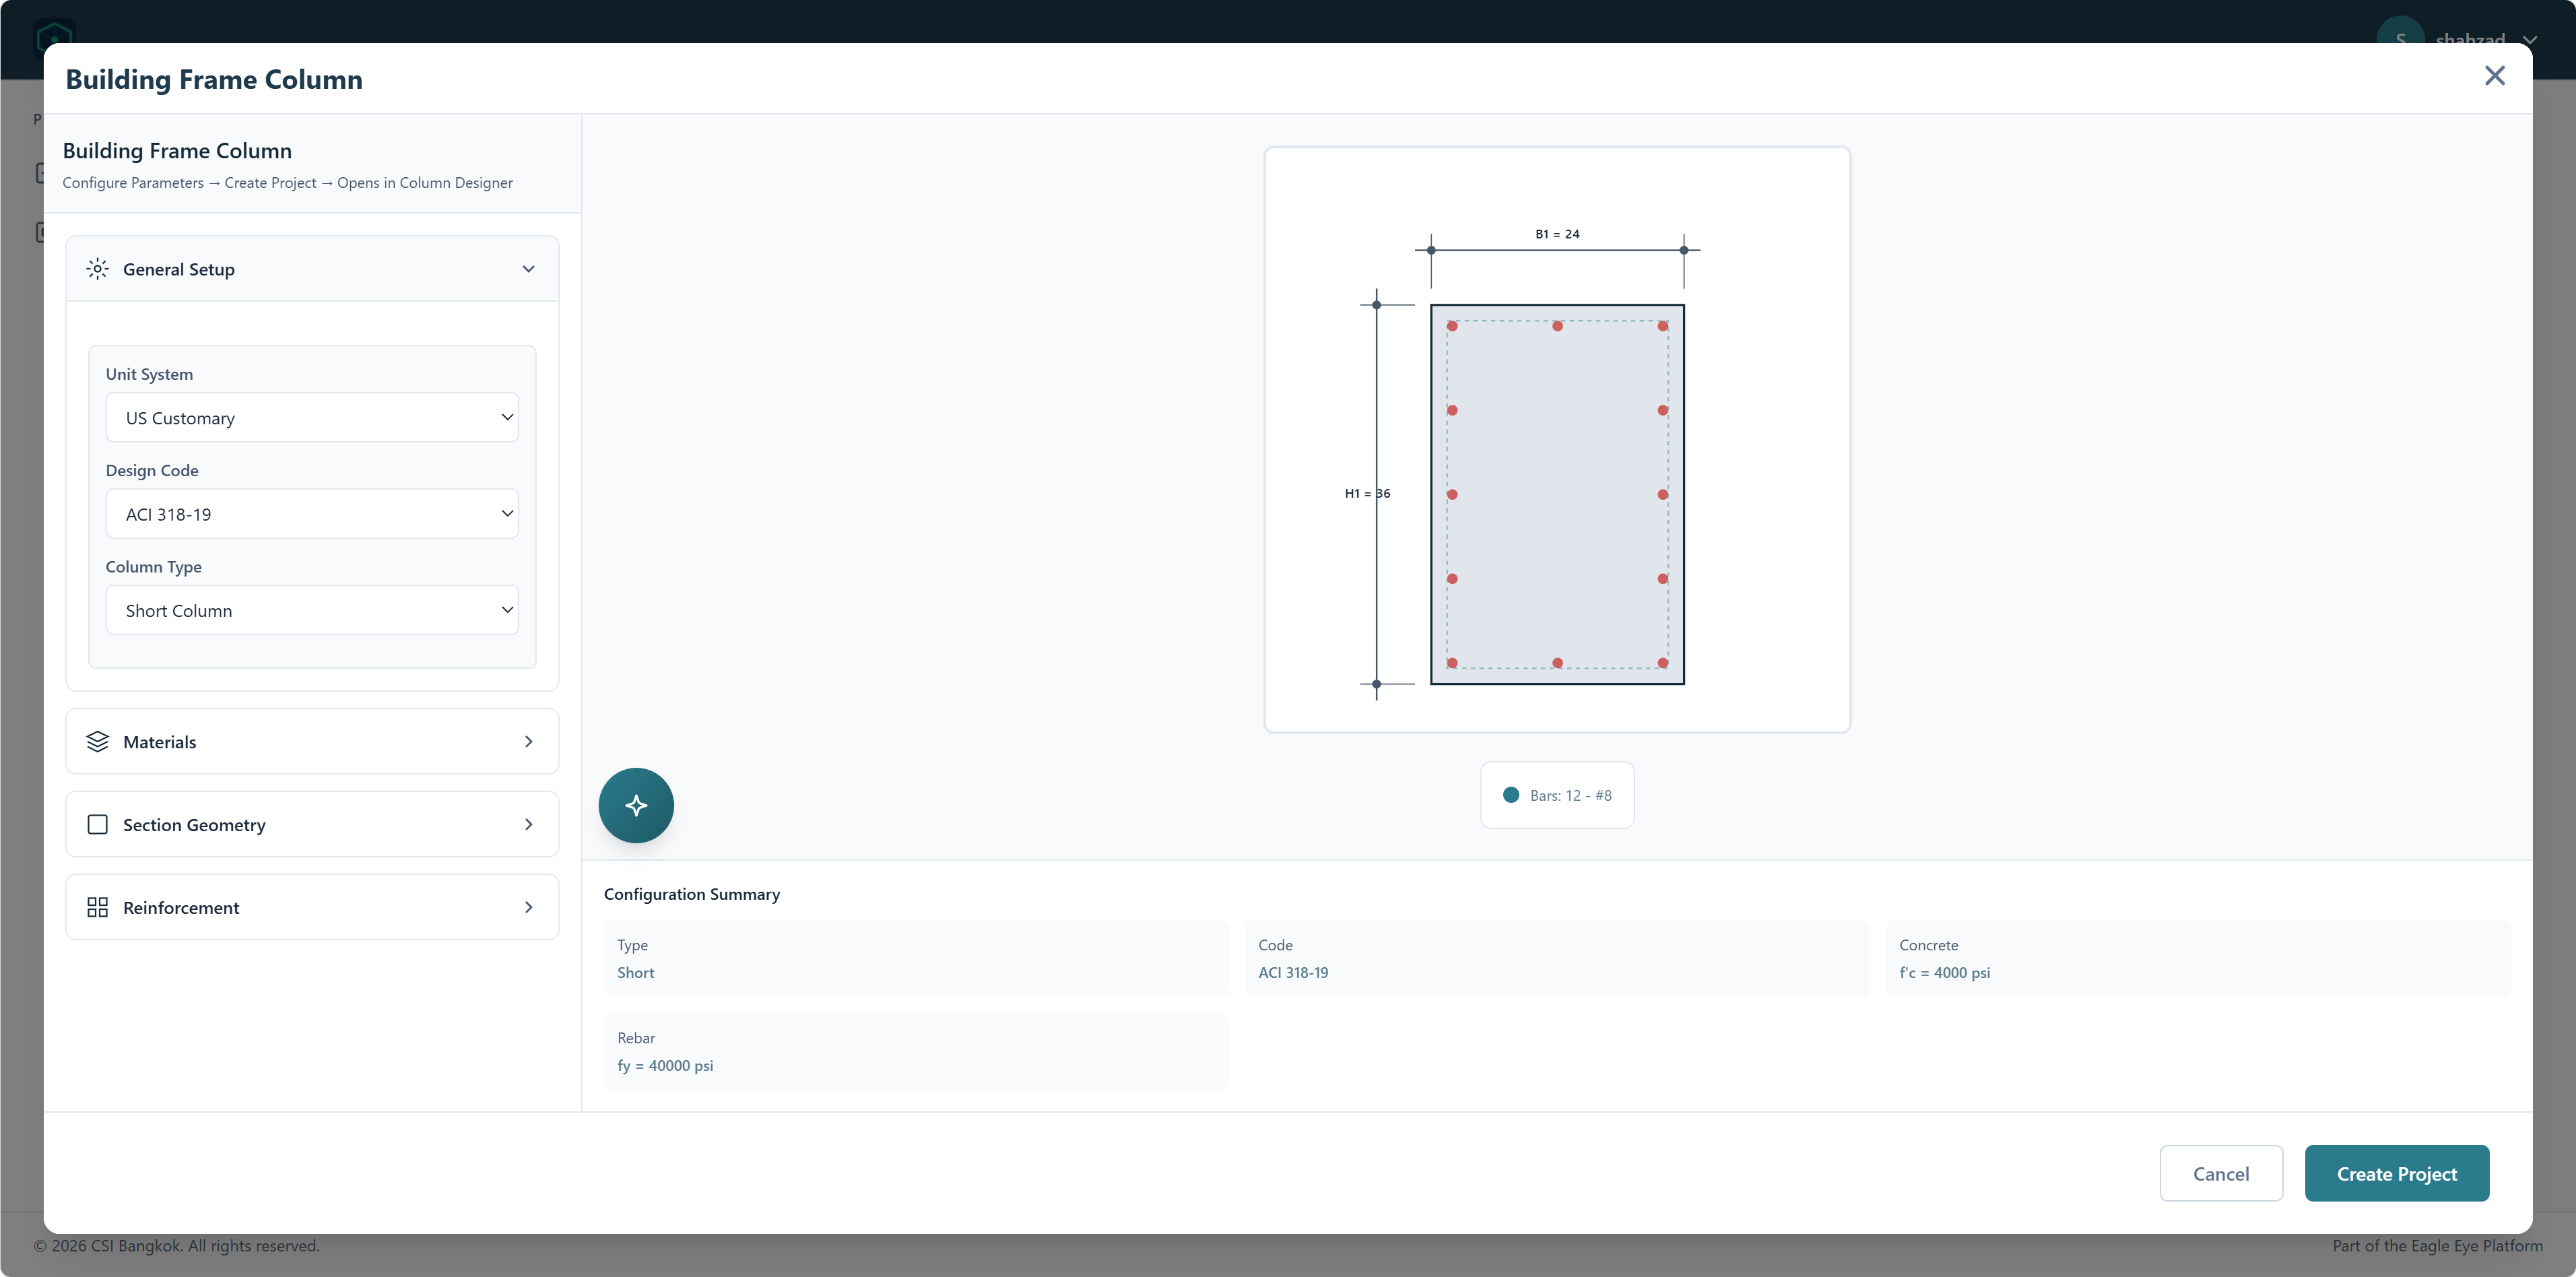
The configuration dialog is organized into the following sections:
General Setup Set the basic project parameters:
Unit System: Choose between US Customary and SI units
Design Code: Select the applicable design standard (e.g., ACI 318-19)
Column Type: Specify whether the column is a Short Column or a slender column
Materials Define the concrete and reinforcement material properties.
Section Geometry Specify the cross-sectional dimensions of the column.
Reinforcement Configure the rebar layout, including concrete cover, bar size and arrangement.
A live preview of the column cross-section is displayed on the right side of the dialog, updating as parameters are adjusted. A Configuration Summary at the bottom provides a quick overview of the key settings, including column type, design code, concrete strength, and rebar yield strength.
Once all parameters are set, click Create Project to open the column in Column Designer.
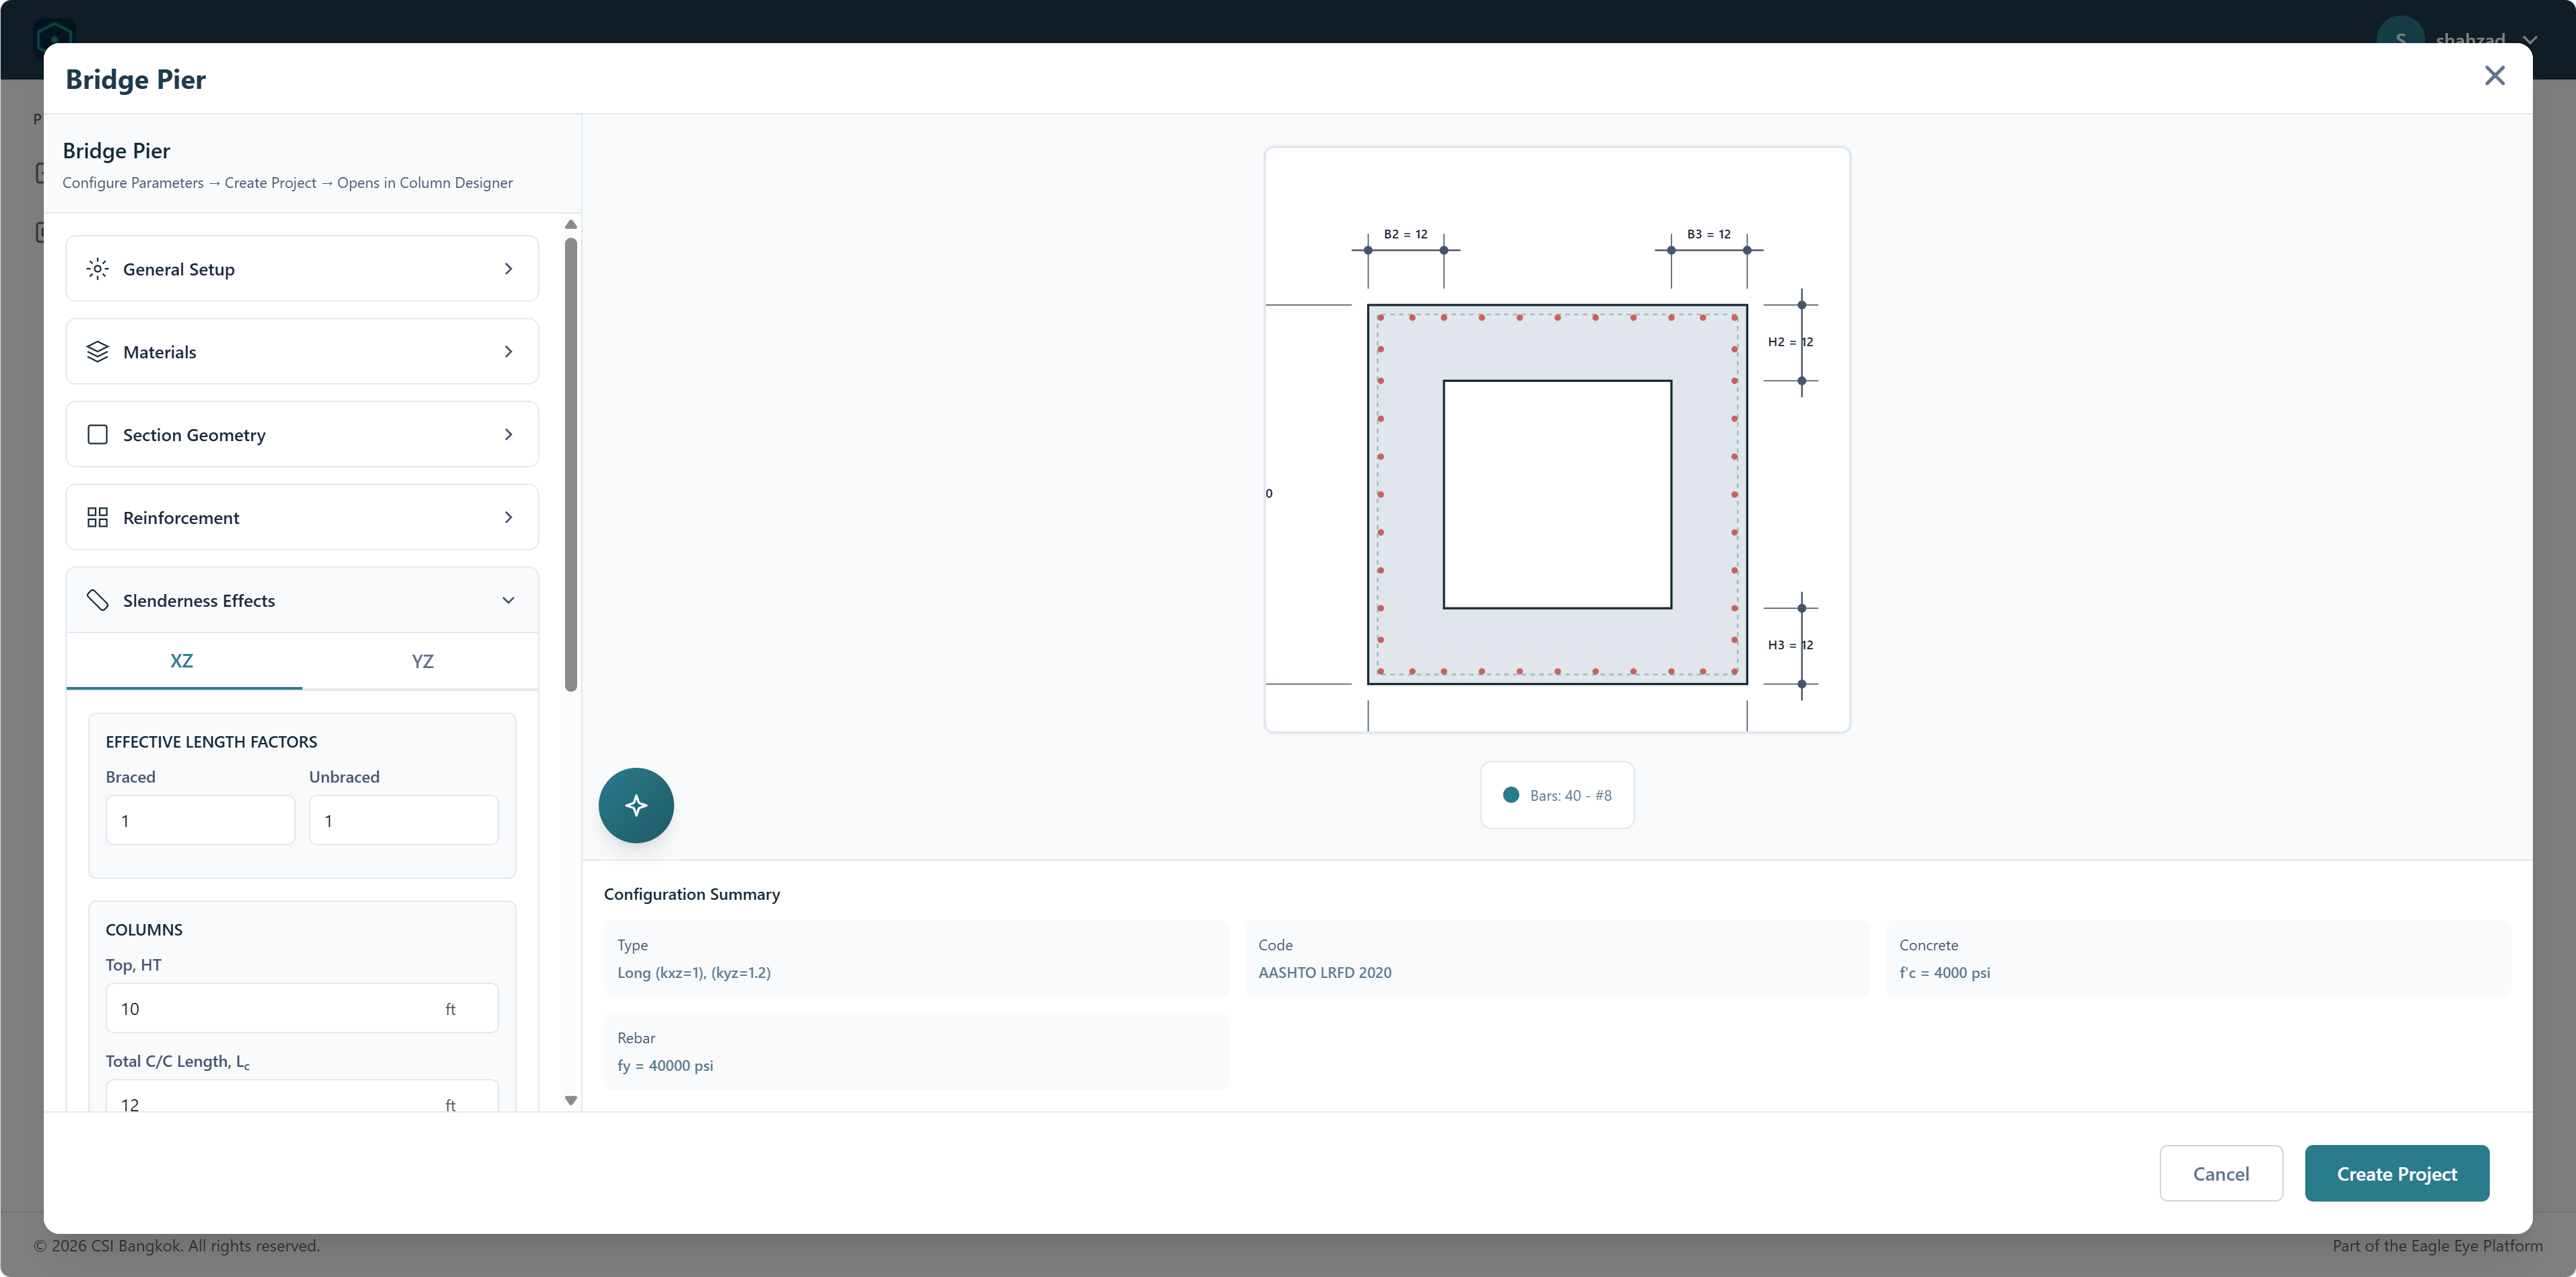
Bridge Pier Template
The Bridge Pier template is configured for design of bridge substructure piers, using AASHTO LRFD as the default design code.
The configuration sections (General Setup, Materials, Section Geometry, and Reinforcement) follow the same structure as the Building Frame Column template.
Slenderness Effects When the column type is set to Long Column, an additional Slenderness Effects section becomes available across all templates. It allows users to define effective length factors for both the XZ and YZ planes, with separate values for braced and unbraced conditions, as well as column height and center-to-center length parameters.
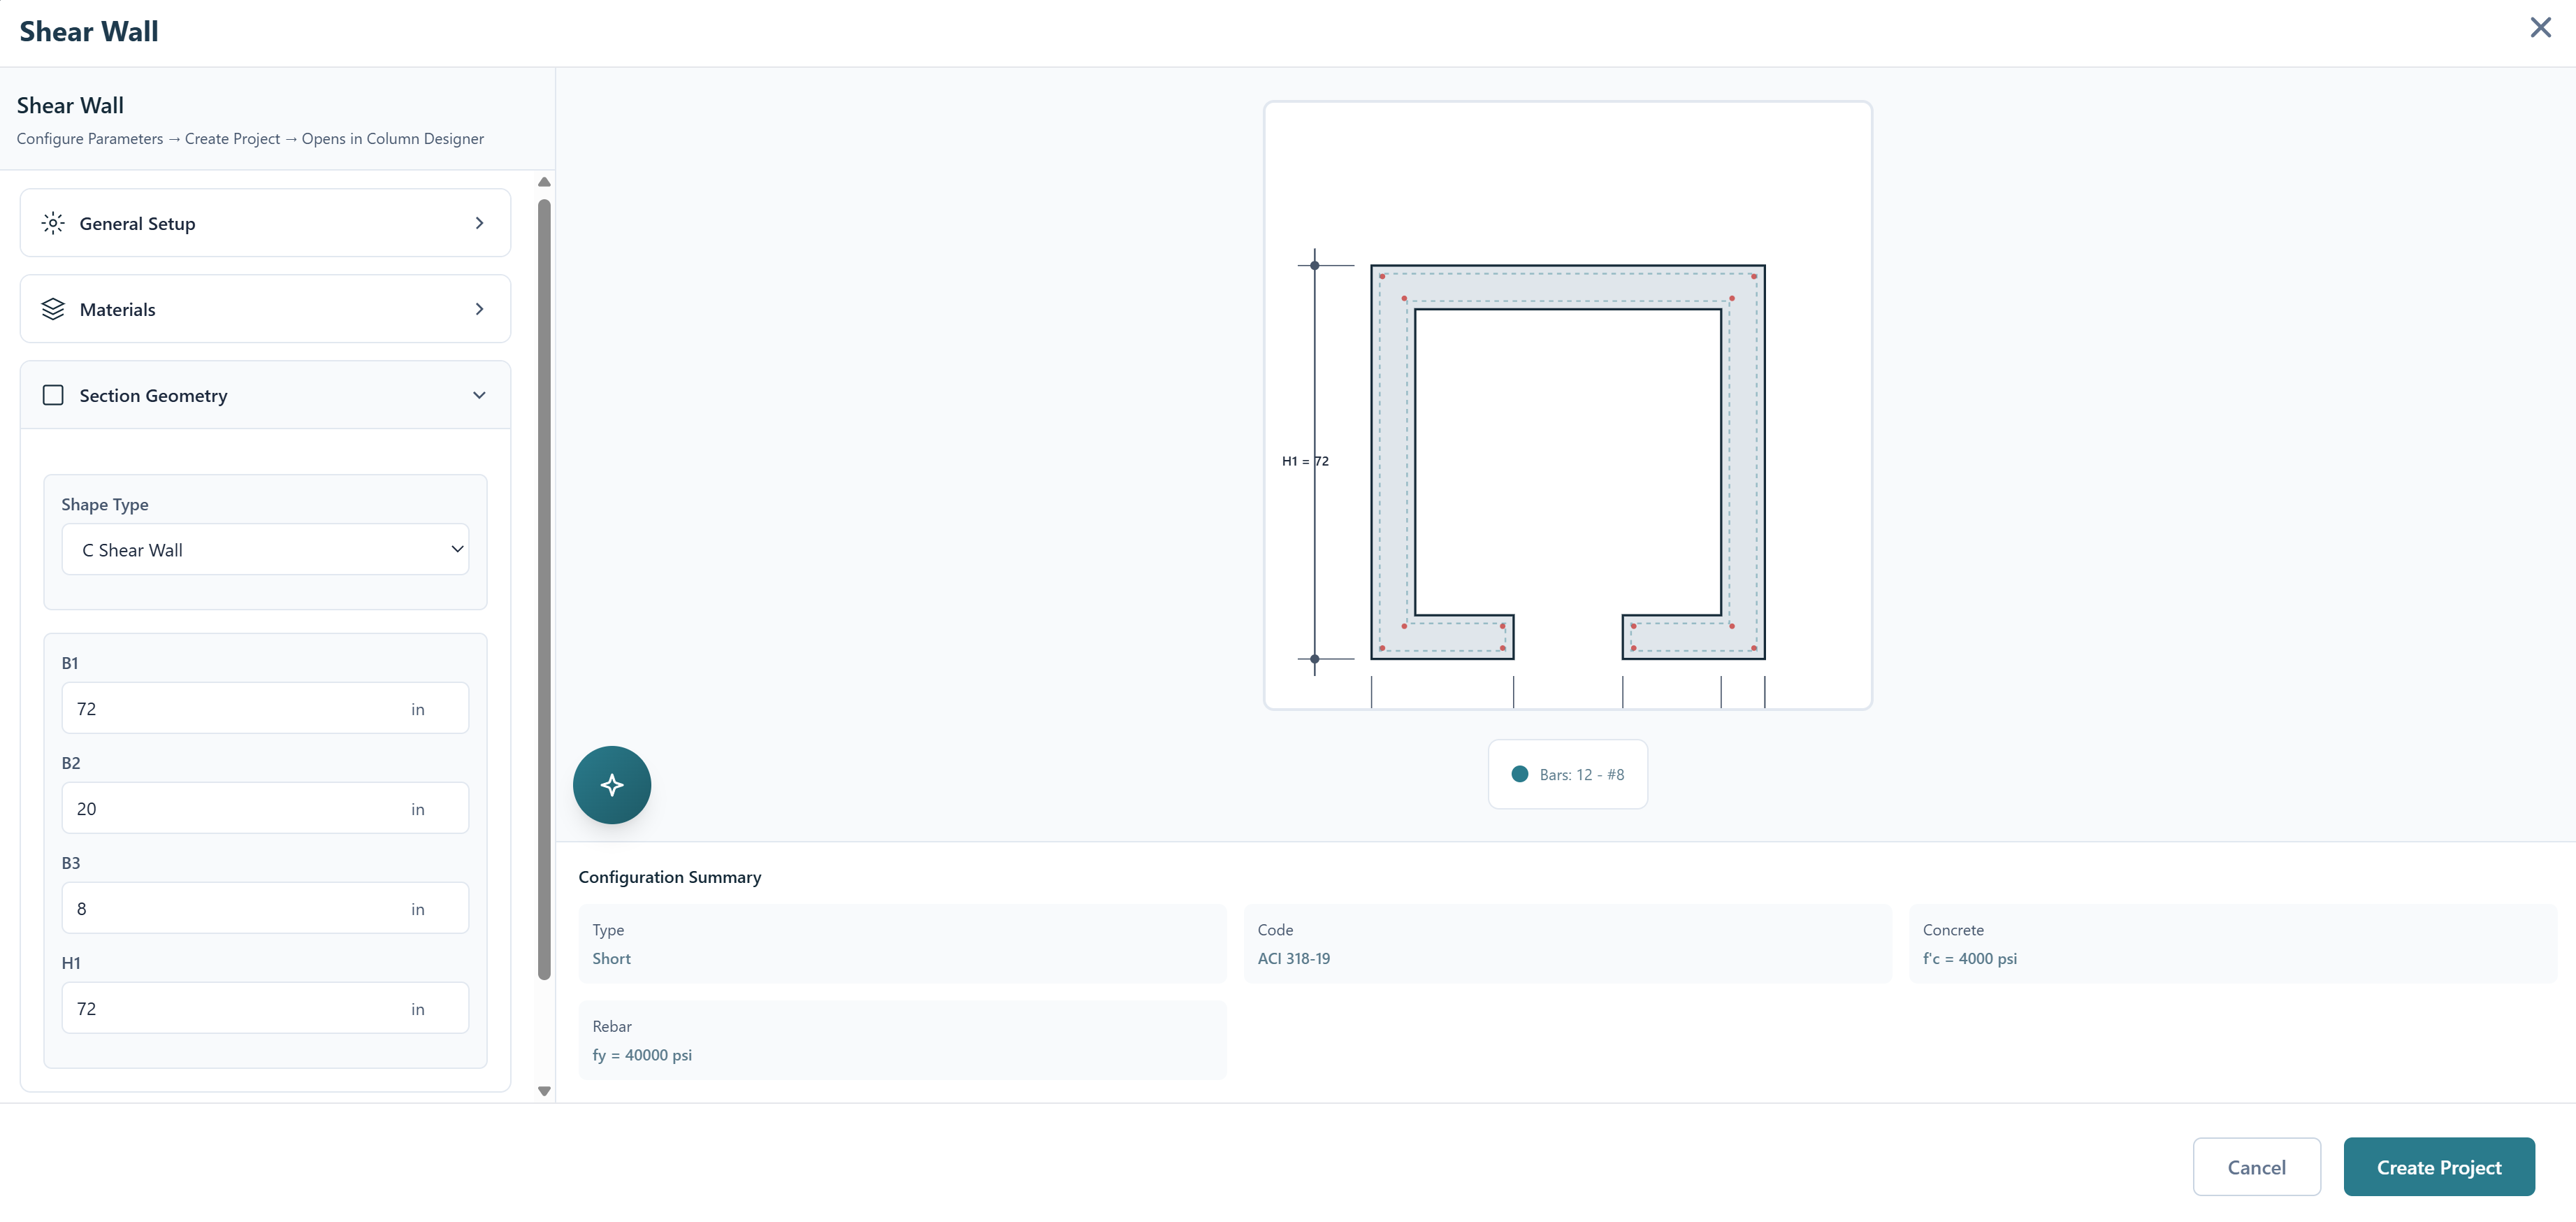
Shear Wall Template
The Shear Wall template is configured for core sections under combined axial load and bending. The General Setup, Materials, and Reinforcement sections follow the same structure as the other templates.
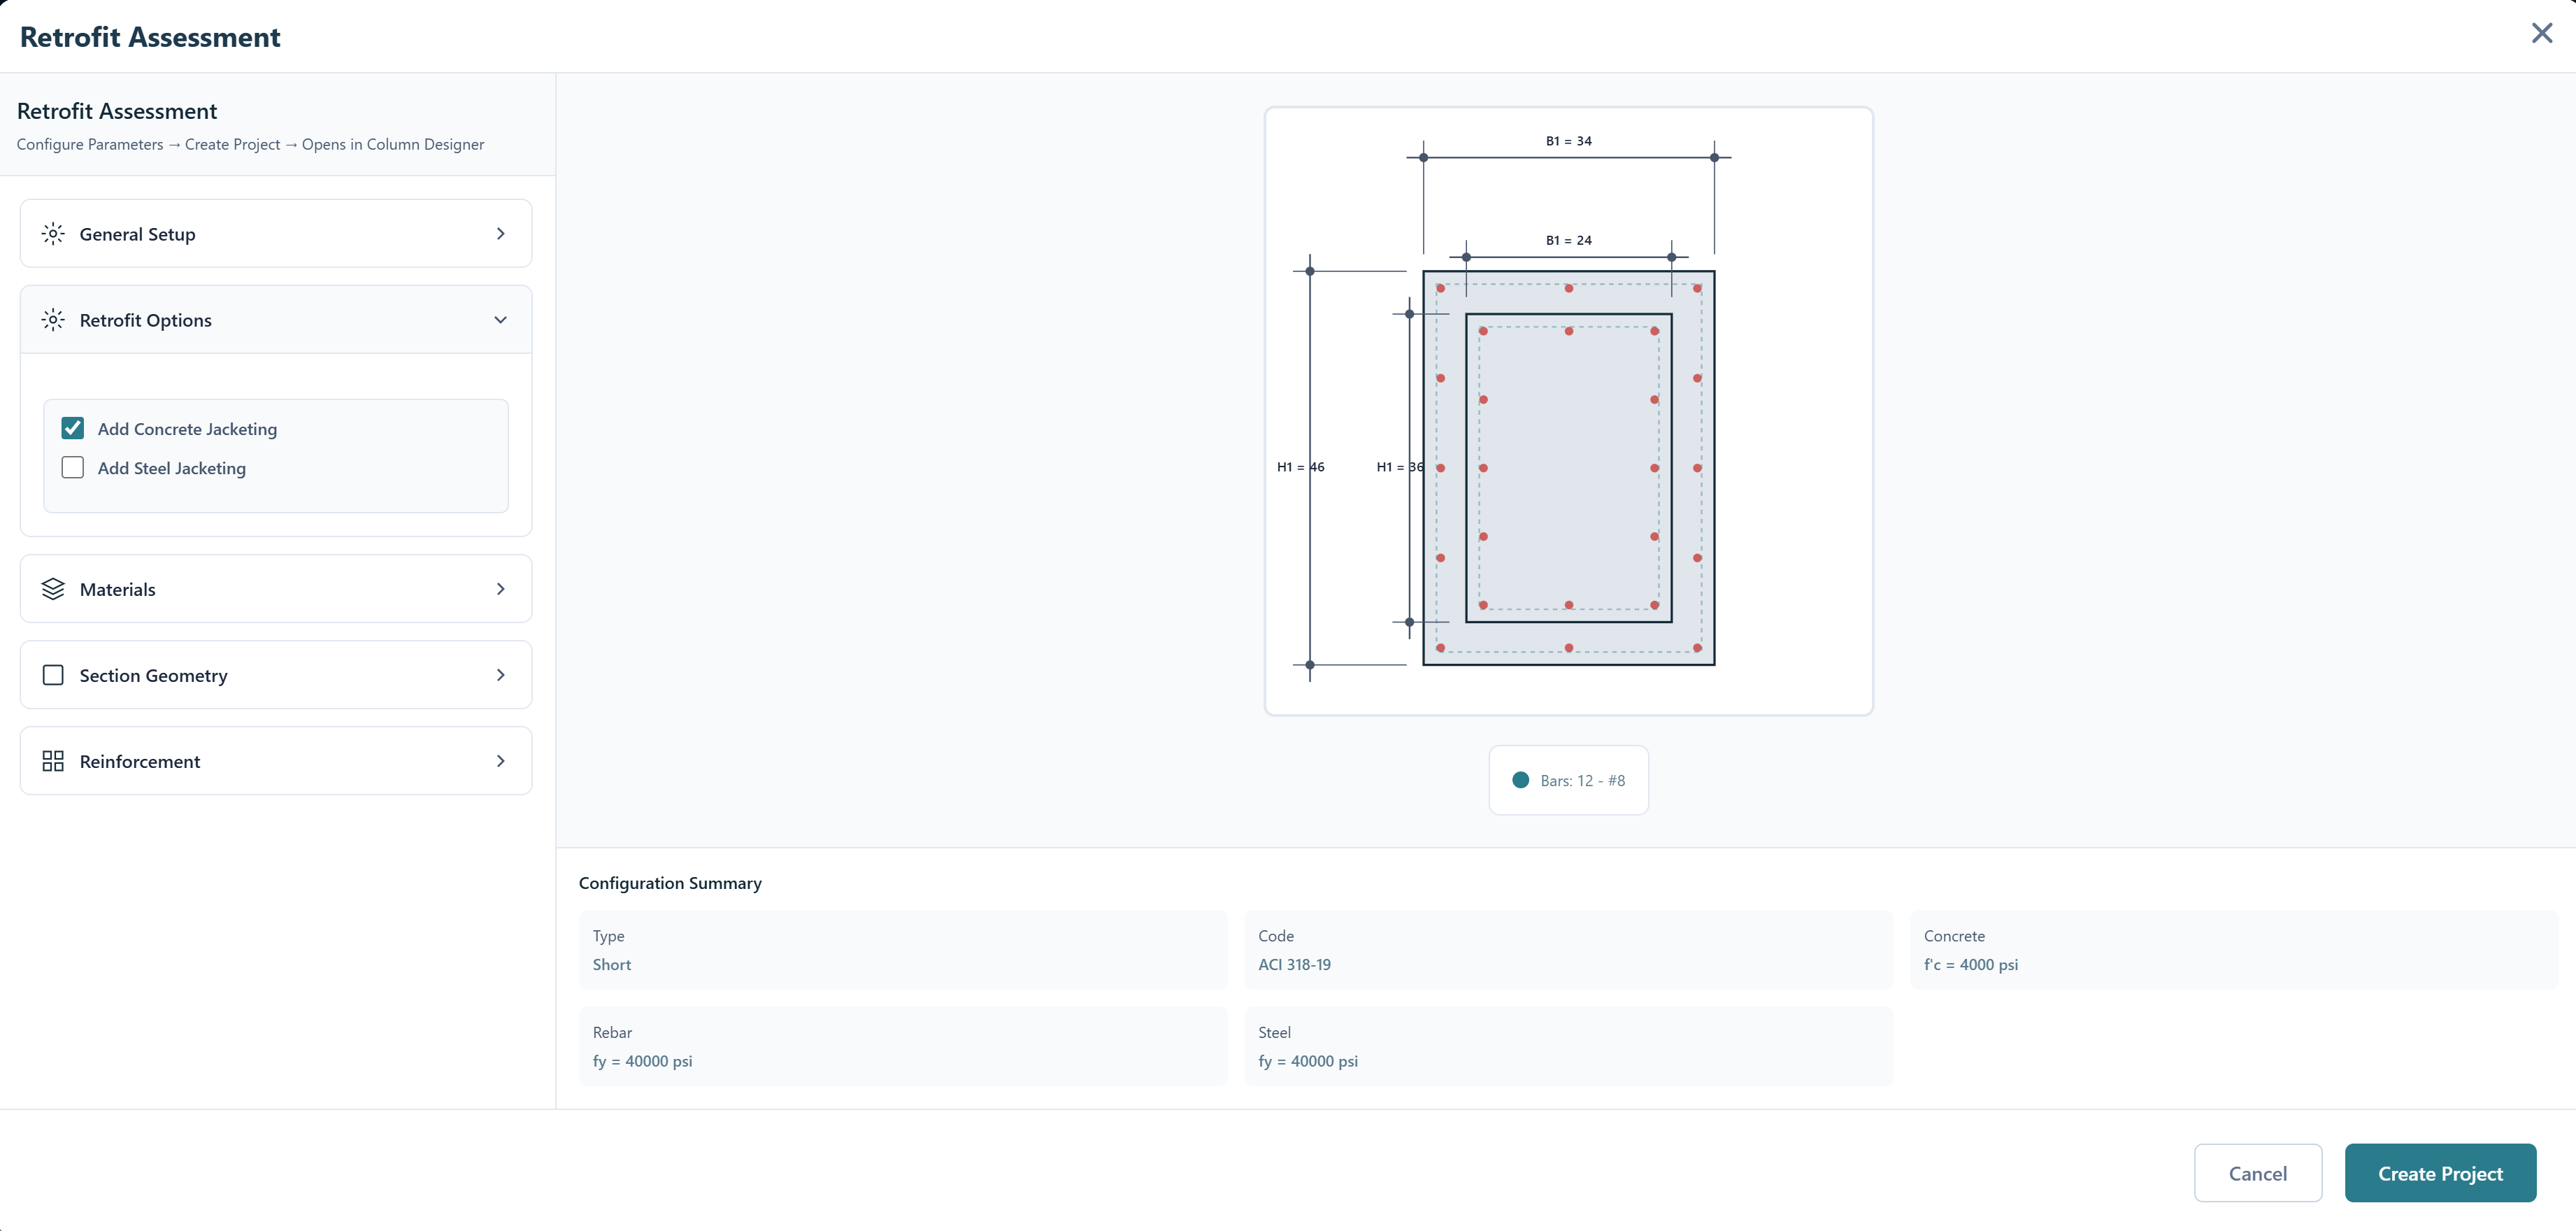
Retrofit Assessment Template
The Retrofit Assessment template is designed for evaluating and strengthening existing column structures.
This template includes one additional section:
Retrofit Options Users can select one or both of the following strengthening methods:
Add Concrete Jacketing: Adds a concrete jacket layer around the existing section
Add Steel Jacketing: Adds a steel jacket around the existing section
The cross-section preview updates to reflect the selected jacketing configuration, showing both the original and the enlarged retrofitted section dimensions.
Creating a New Column
The New Column section provides four options for starting a column model directly, without using a predefined template. Clicking any option opens the selected column type directly in the Column Designer interface.
From ETABS: Imports an existing column from an ETABS EDM file, carrying over the section and load data defined in the structural model
Rectangular: Opens a new rectangular column model ready for configuration
Circular: Opens a new circular column model ready for configuration
Blank: Opens an empty model with no predefined geometry, suitable for custom or non-standard column configurations
Column Designer’s User Interface
Column Designer’s user interface is designed to be user-friendly and intuitive. The interface consists of a drawing area along with various menus and panels that allow efficient modeling, analysis, and design.
The components of the interface are described in the sections below.
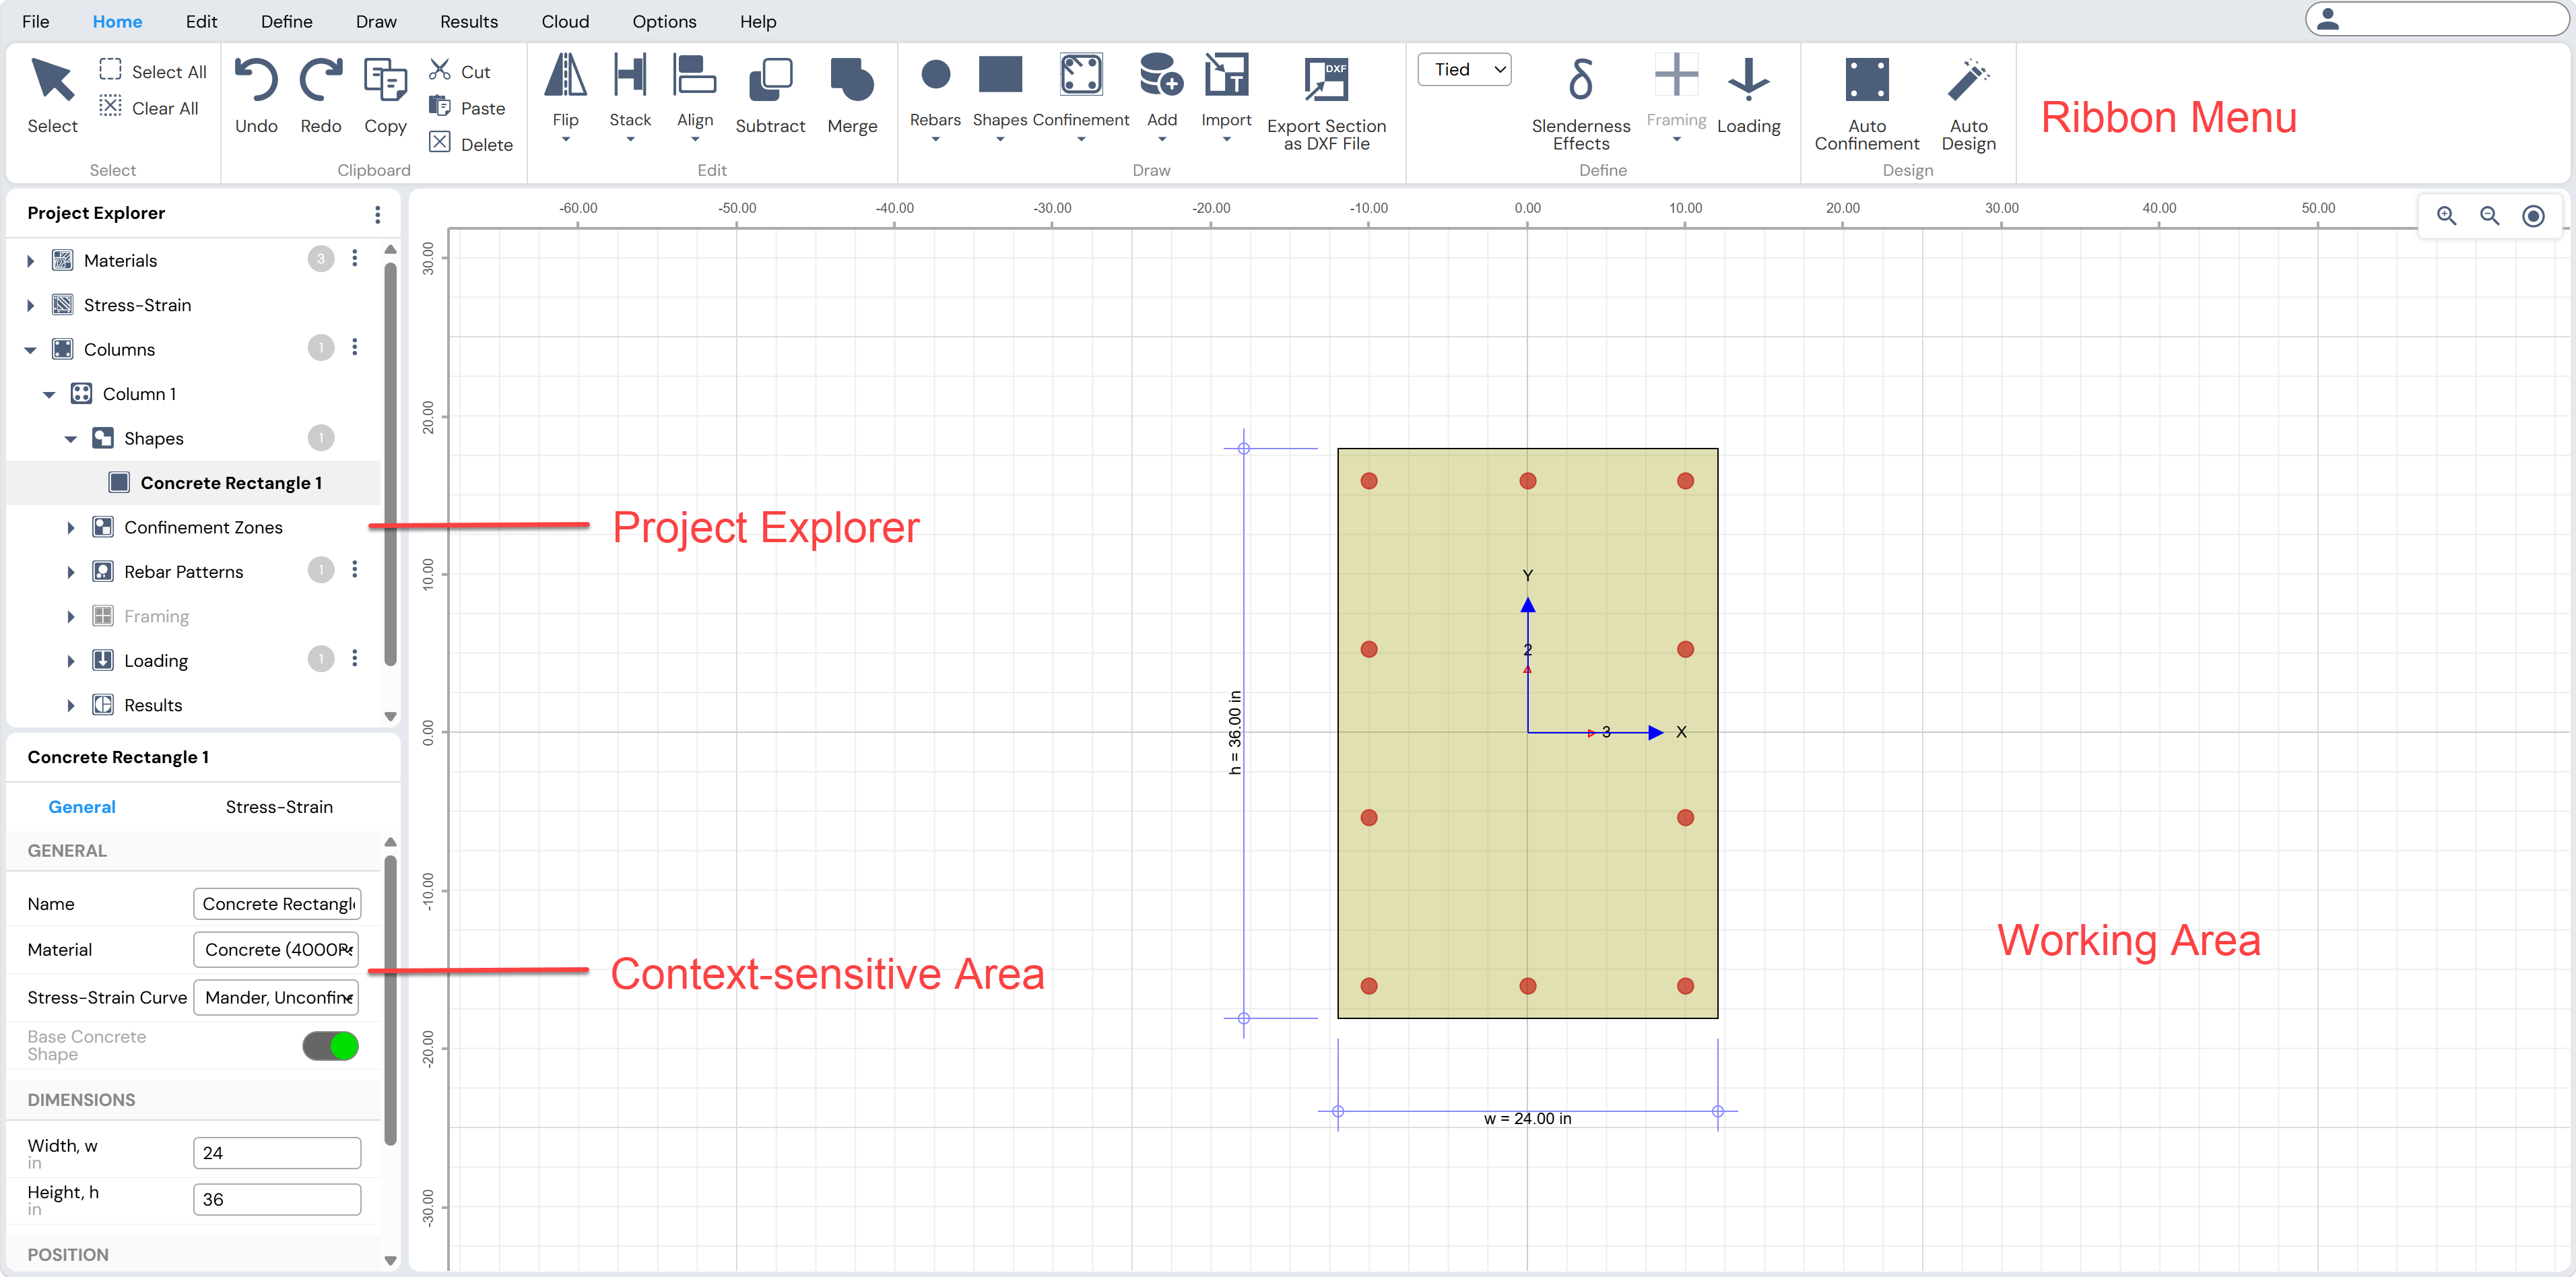
Figure: Column Designer Working Window
Working Window
The Column Designer graphical user interface includes the following main components:
Ribbon Menu Bar
Working Area
Project Explorer
Context-Sensitive Area
Each component is described below.
Ribbon Menu Bar
The Ribbon Menu Bar contains the program menus from which various actions can be performed.
Common menus include:
File
Home
Edit
Define
Draw
Results
Cloud
Options
Help
Each menu provides access to relevant commands and tools.

Figure: Column Designer Ribbon Menu Bar
Working Area
All creation and modification of shapes and sections take place in the Working Area.
Key characteristics:
Automatically updates as shapes are added, moved, resized, rotated, or combined
Supports creation of sections with arbitrary geometry and size
Displays a graph-paper style grid to assist with:
Placement
Alignment
Resizing of shapes and sections
Project Explorer
The Project Explorer provides structured access to project data and includes four main views:
Materials
Used to view and modify material properties defined in the Project File.Stress-Strain
Used to view and edit stress–strain curves for materials.Columns
Allows access to:Shapes
Rebar patterns
Framing conditions
Loadings
Results for each column can also be accessed from this view.
Report
Used to generate:Column Summary
One-page Simple reports
Detailed reports for the selected column
Materials and stress–strain definitions can be reused across multiple columns in the Project File.
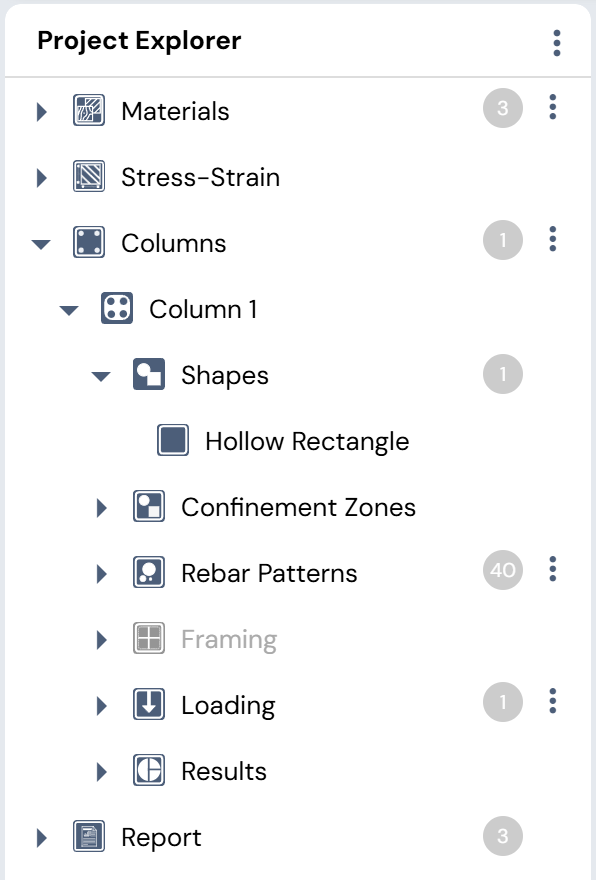
Figure: Column Designer Project Explorer
Context-Sensitive Area
The Context-Sensitive Area displays grids and panels that change based on user actions.
Examples:
The Property Grid becomes active when a shape or rebar is selected.
Different grids appear depending on:
The selected tool
The selected object
This area allows editing without opening additional dialog boxes.
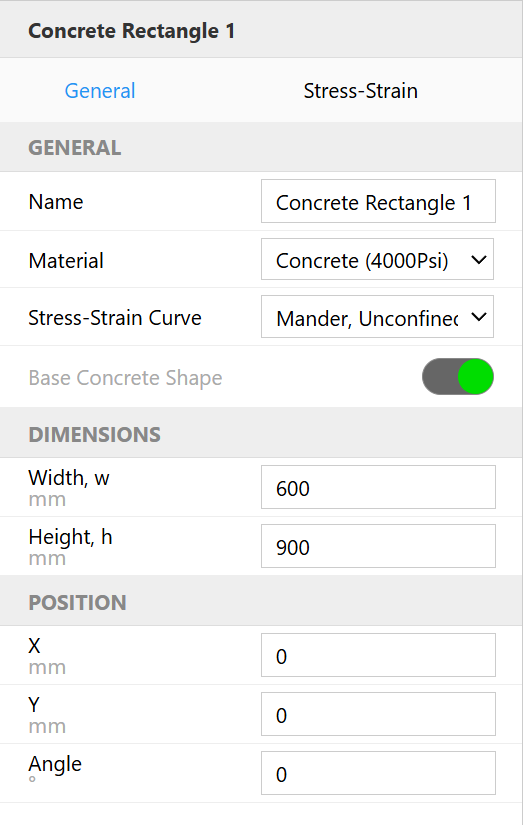
Figure: Column Designer Context-Sensitive Area
Customize the Program
Column Designer provides several settings under the Options Menu that allow customization of parameters used globally within the current Project File.
These parameters include:
Working units
Design code
Number formatting
View options
Diagram display settings
General Options
General Options control parameters that affect all sections globally in the current Project File.
Units Drop-Down List
The Units drop-down list defines the working units for the model.
The selected units apply globally to all sections in the Project File.
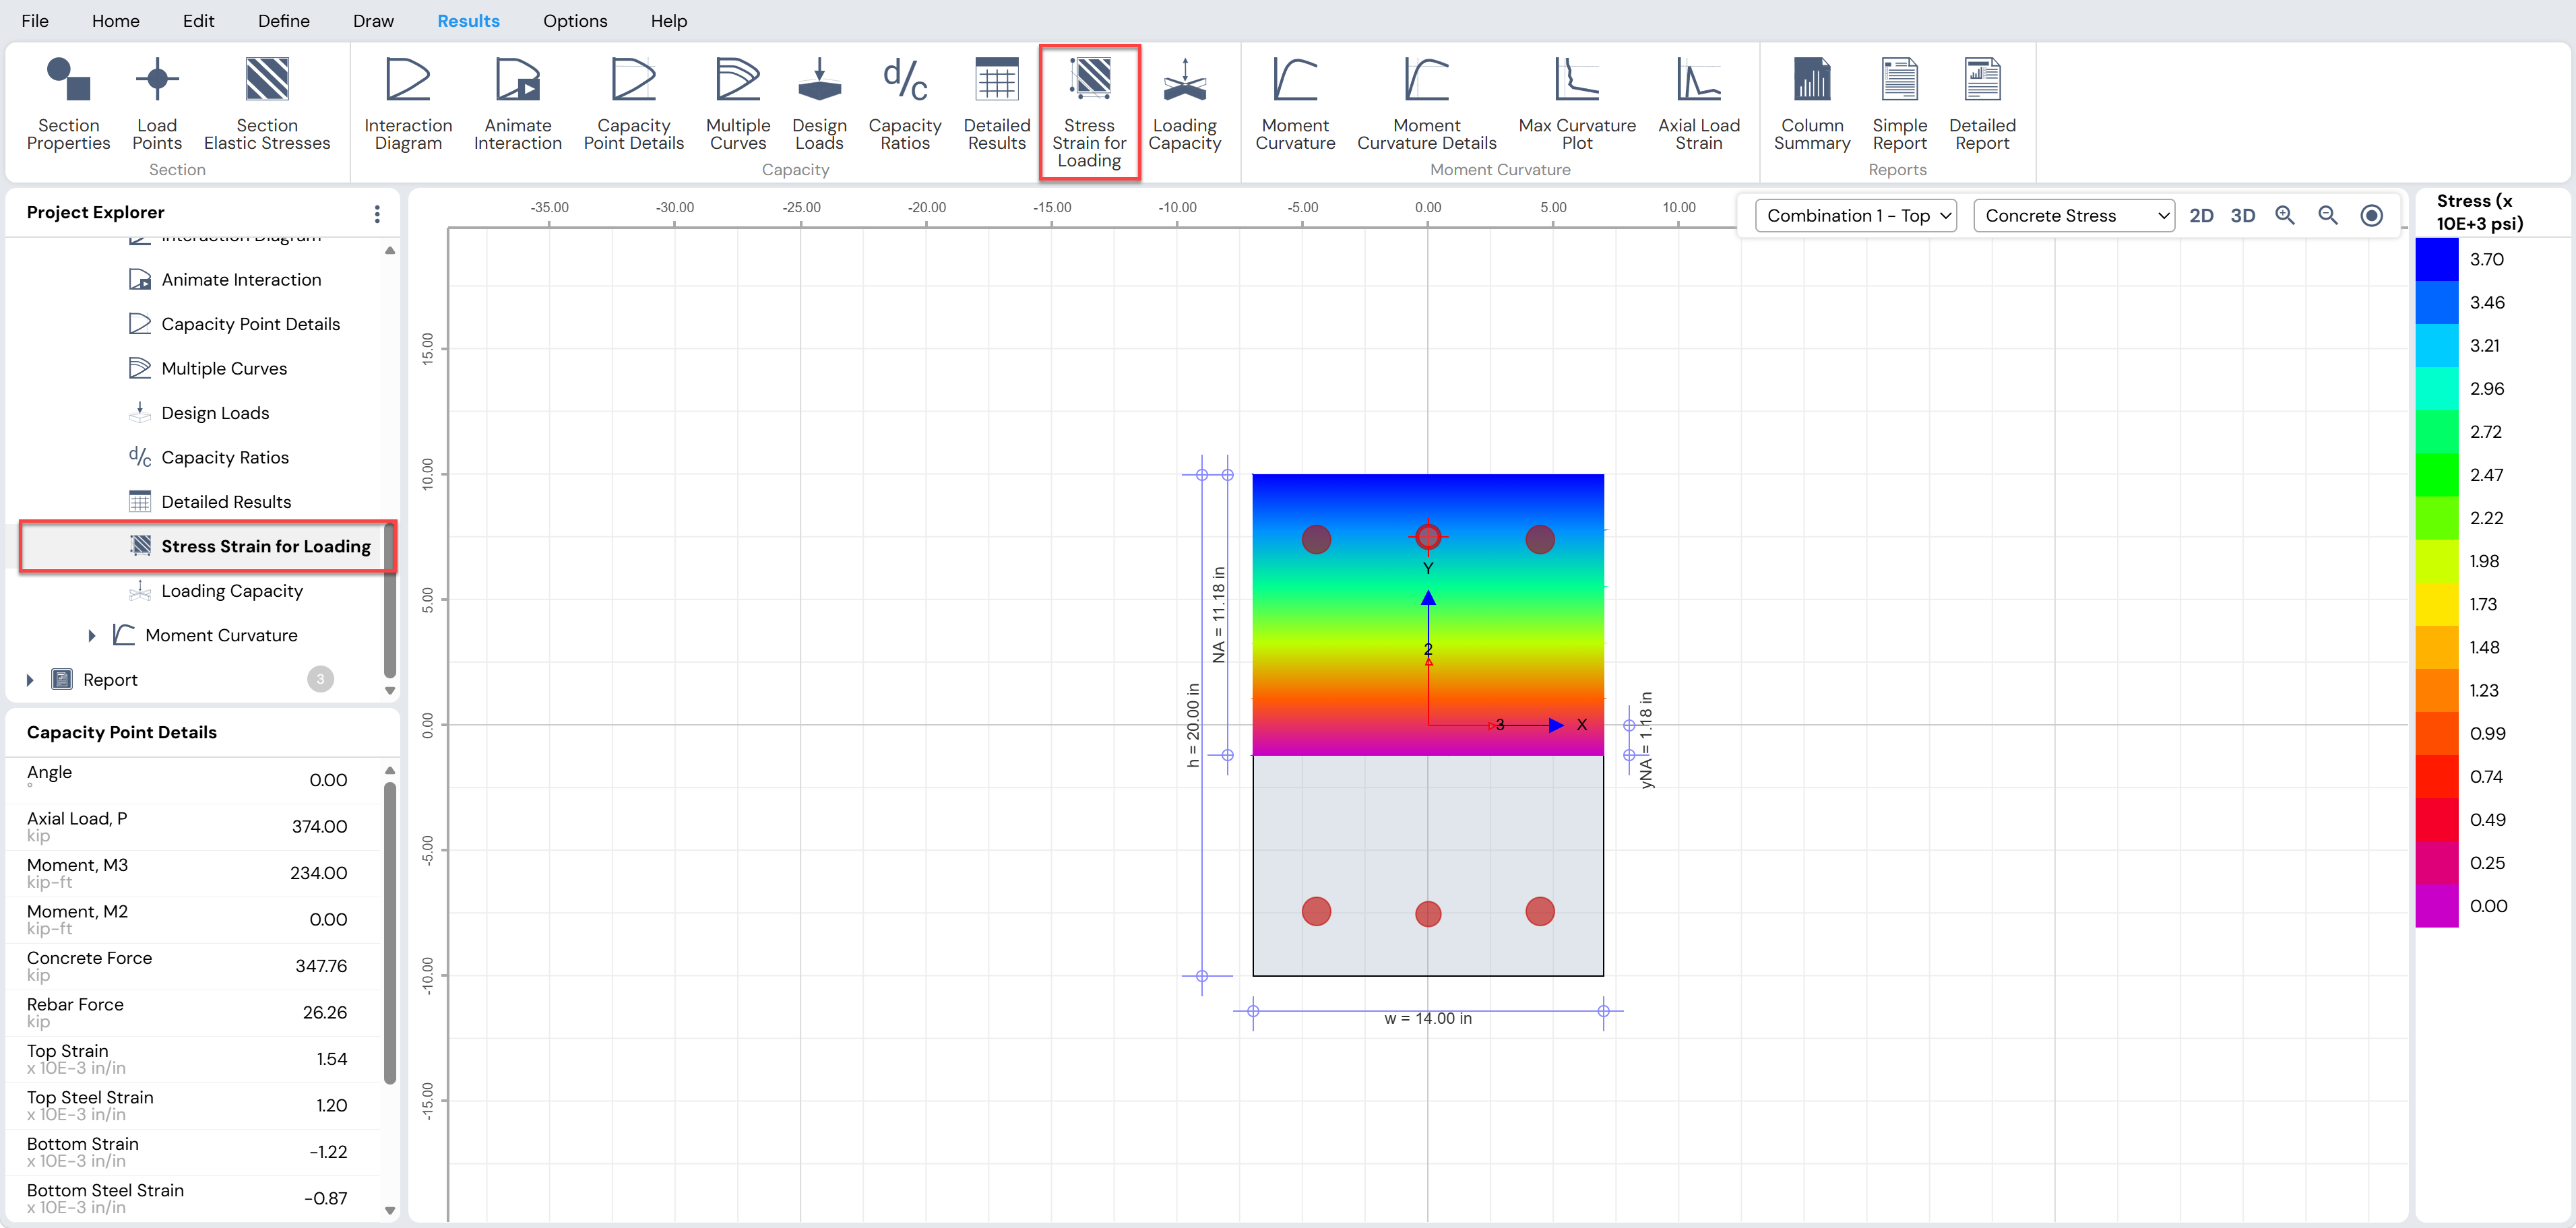
Figure: Units Drop-Down List
Currently supported unit systems:
US Customary
Metric SI
US Customary Units
| Item | Units |
|---|---|
| Angle | ° |
| Length | in |
| Area | in² |
| Section Modulus | in³ |
| Area Moment of Inertia | in⁴ |
| Strain | ×10⁻³ in/in |
| Force | kip |
| Moment | kip-ft |
| Stress | psi |
| Modulus | psi |
| Curvature | ×10⁻³ rad/in |
| Stiffness | kip/ft |
| Mass | lb-s²/ft |
| Mass/Volume | lb-s²/ft⁴ |
| Weight | kip |
| Weight/Volume | lb/ft³ |
| Temperature | °F |
| Thermal Coefficient | 1/°F |
Metric SI Units
| Item | Units |
|---|---|
| Angle | ° |
| Length | mm |
| Area | mm² |
| Section Modulus | mm³ |
| Area Moment of Inertia | mm⁴ |
| Strain | ×10⁻³ mm/mm |
| Force | kN |
| Moment | kN-m |
| Stress | MPa |
| Modulus | MPa |
| Curvature | ×10⁻³ rad/mm |
| Stiffness | N/mm |
| Mass | kg |
| Mass/Volume | kg/m³ |
| Weight | kN |
| Weight/Volume | kN/m³ |
| Temperature | °C |
| Thermal Coefficient | 1/°C |
Code Drop-Down List
The Code drop-down list allows selection of the design code used by Column Designer.
The selected code is used to determine:
Capacity reduction factors
Axial compression limits
Maximum allowable concrete strain
Material reduction factors
Note:
Changing the design code will erase all previously generated results.
The user will be prompted to confirm before the design code is updated.
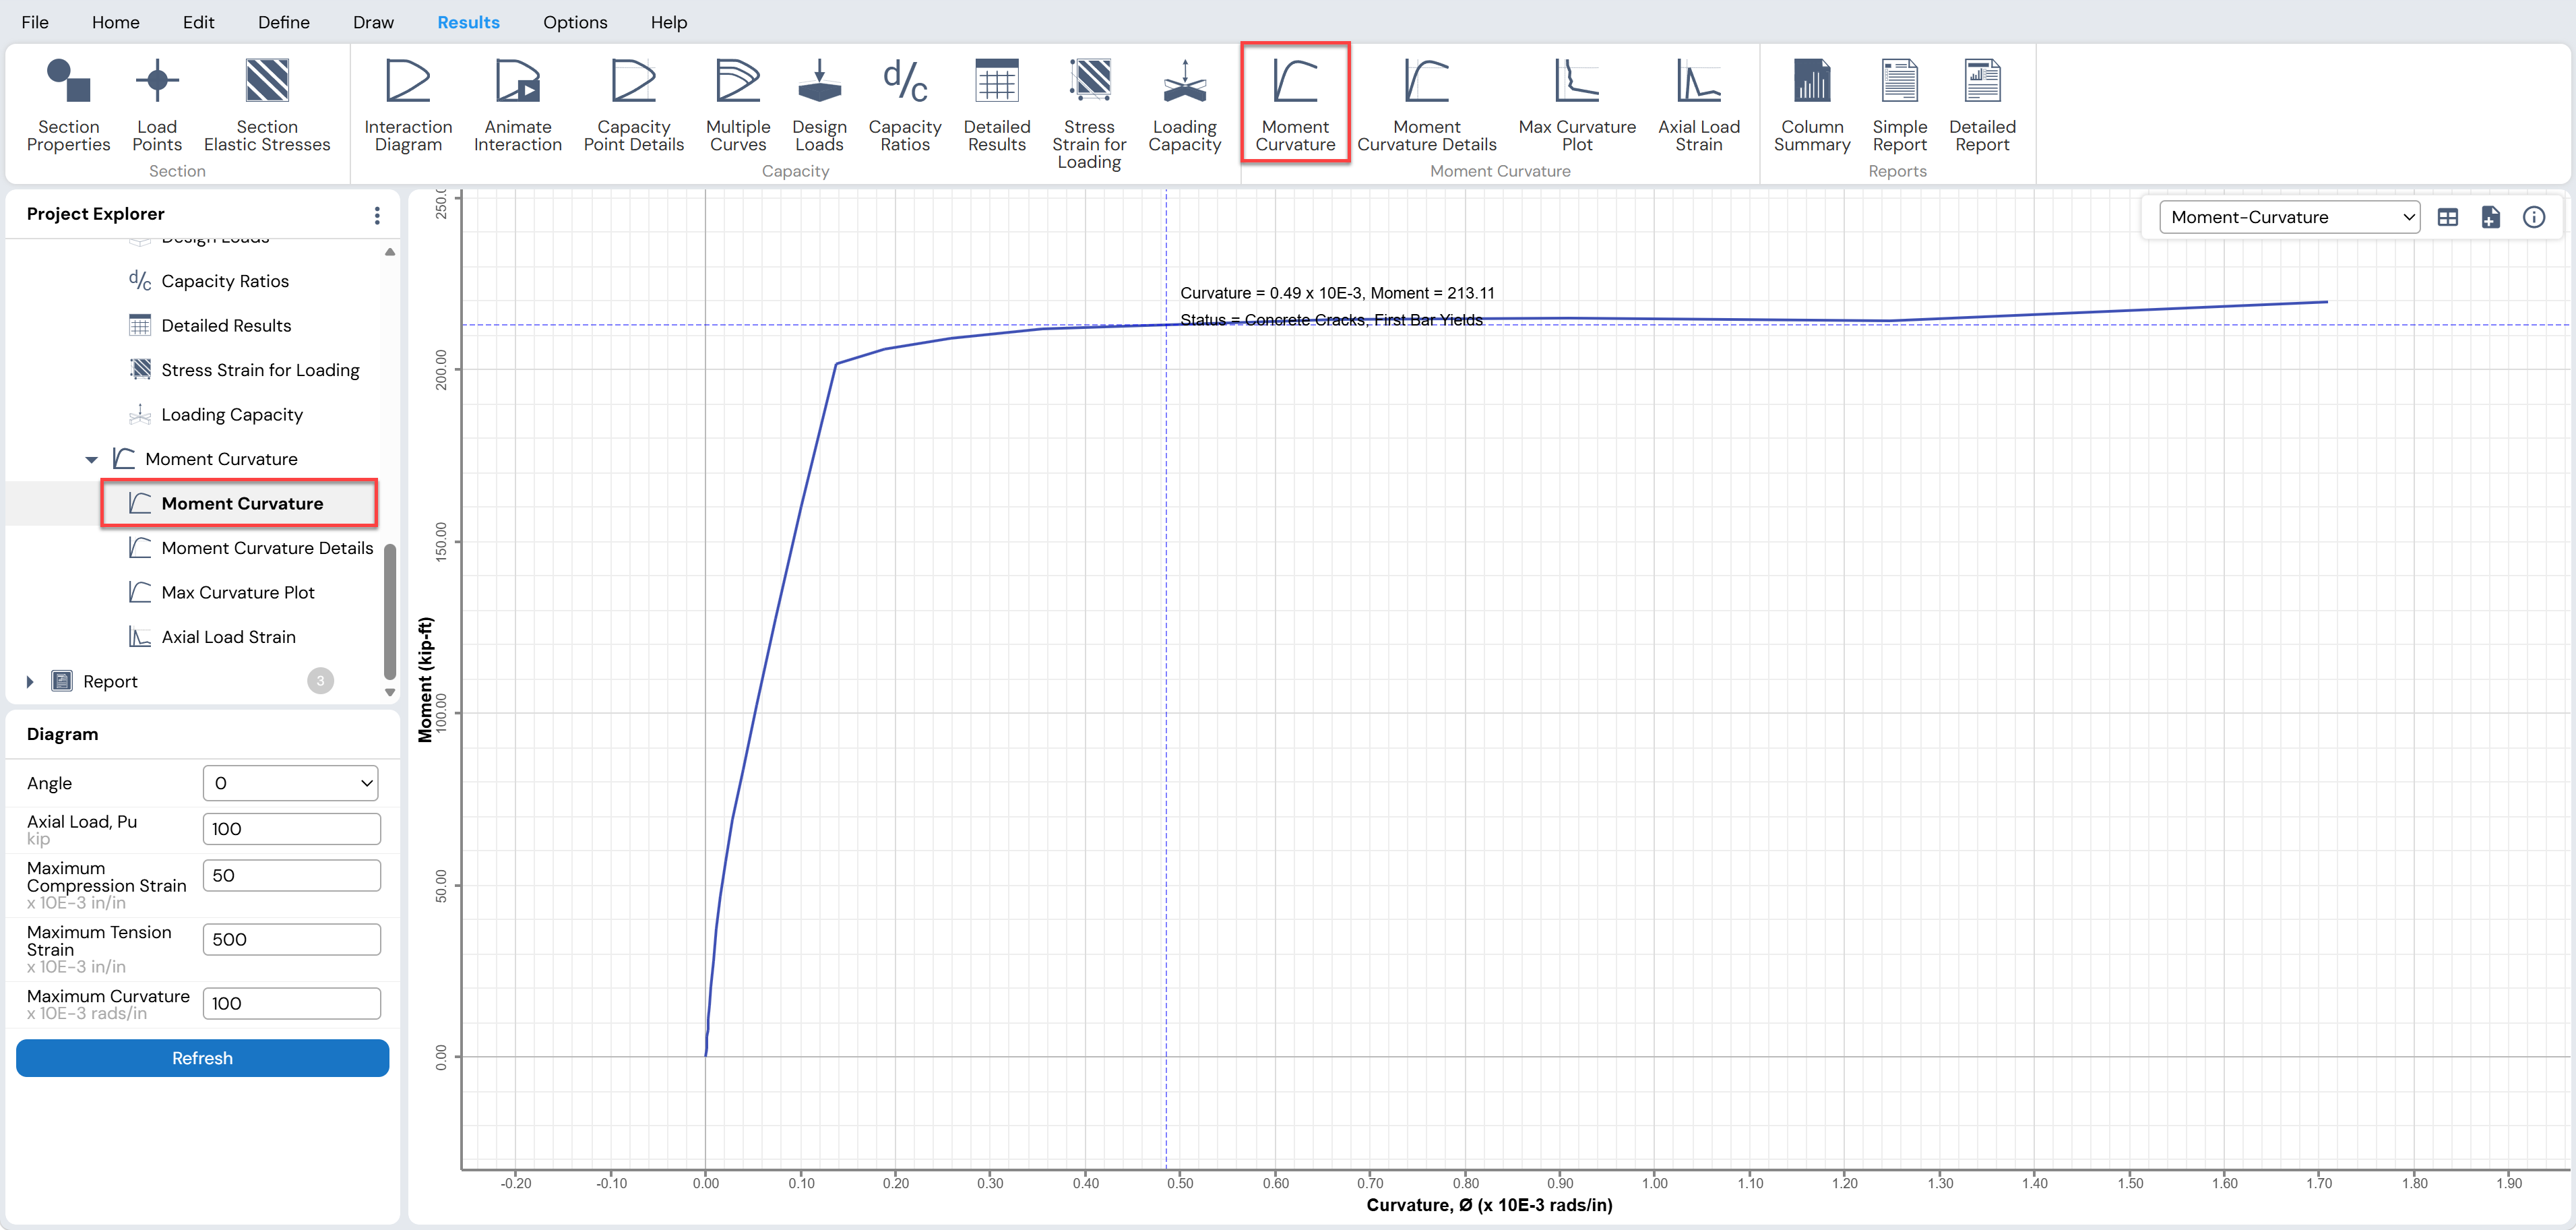
Figure: Code Drop-Down List
Rebar Sets Button
The Rebar Sets button opens the Add Rebar Sets form, allowing the user to:
Add new rebar sizes
Remove existing rebar sizes
Rebars may be added by:
Manually entering bar name and diameter, or
Importing from standard libraries (e.g., ASTM)
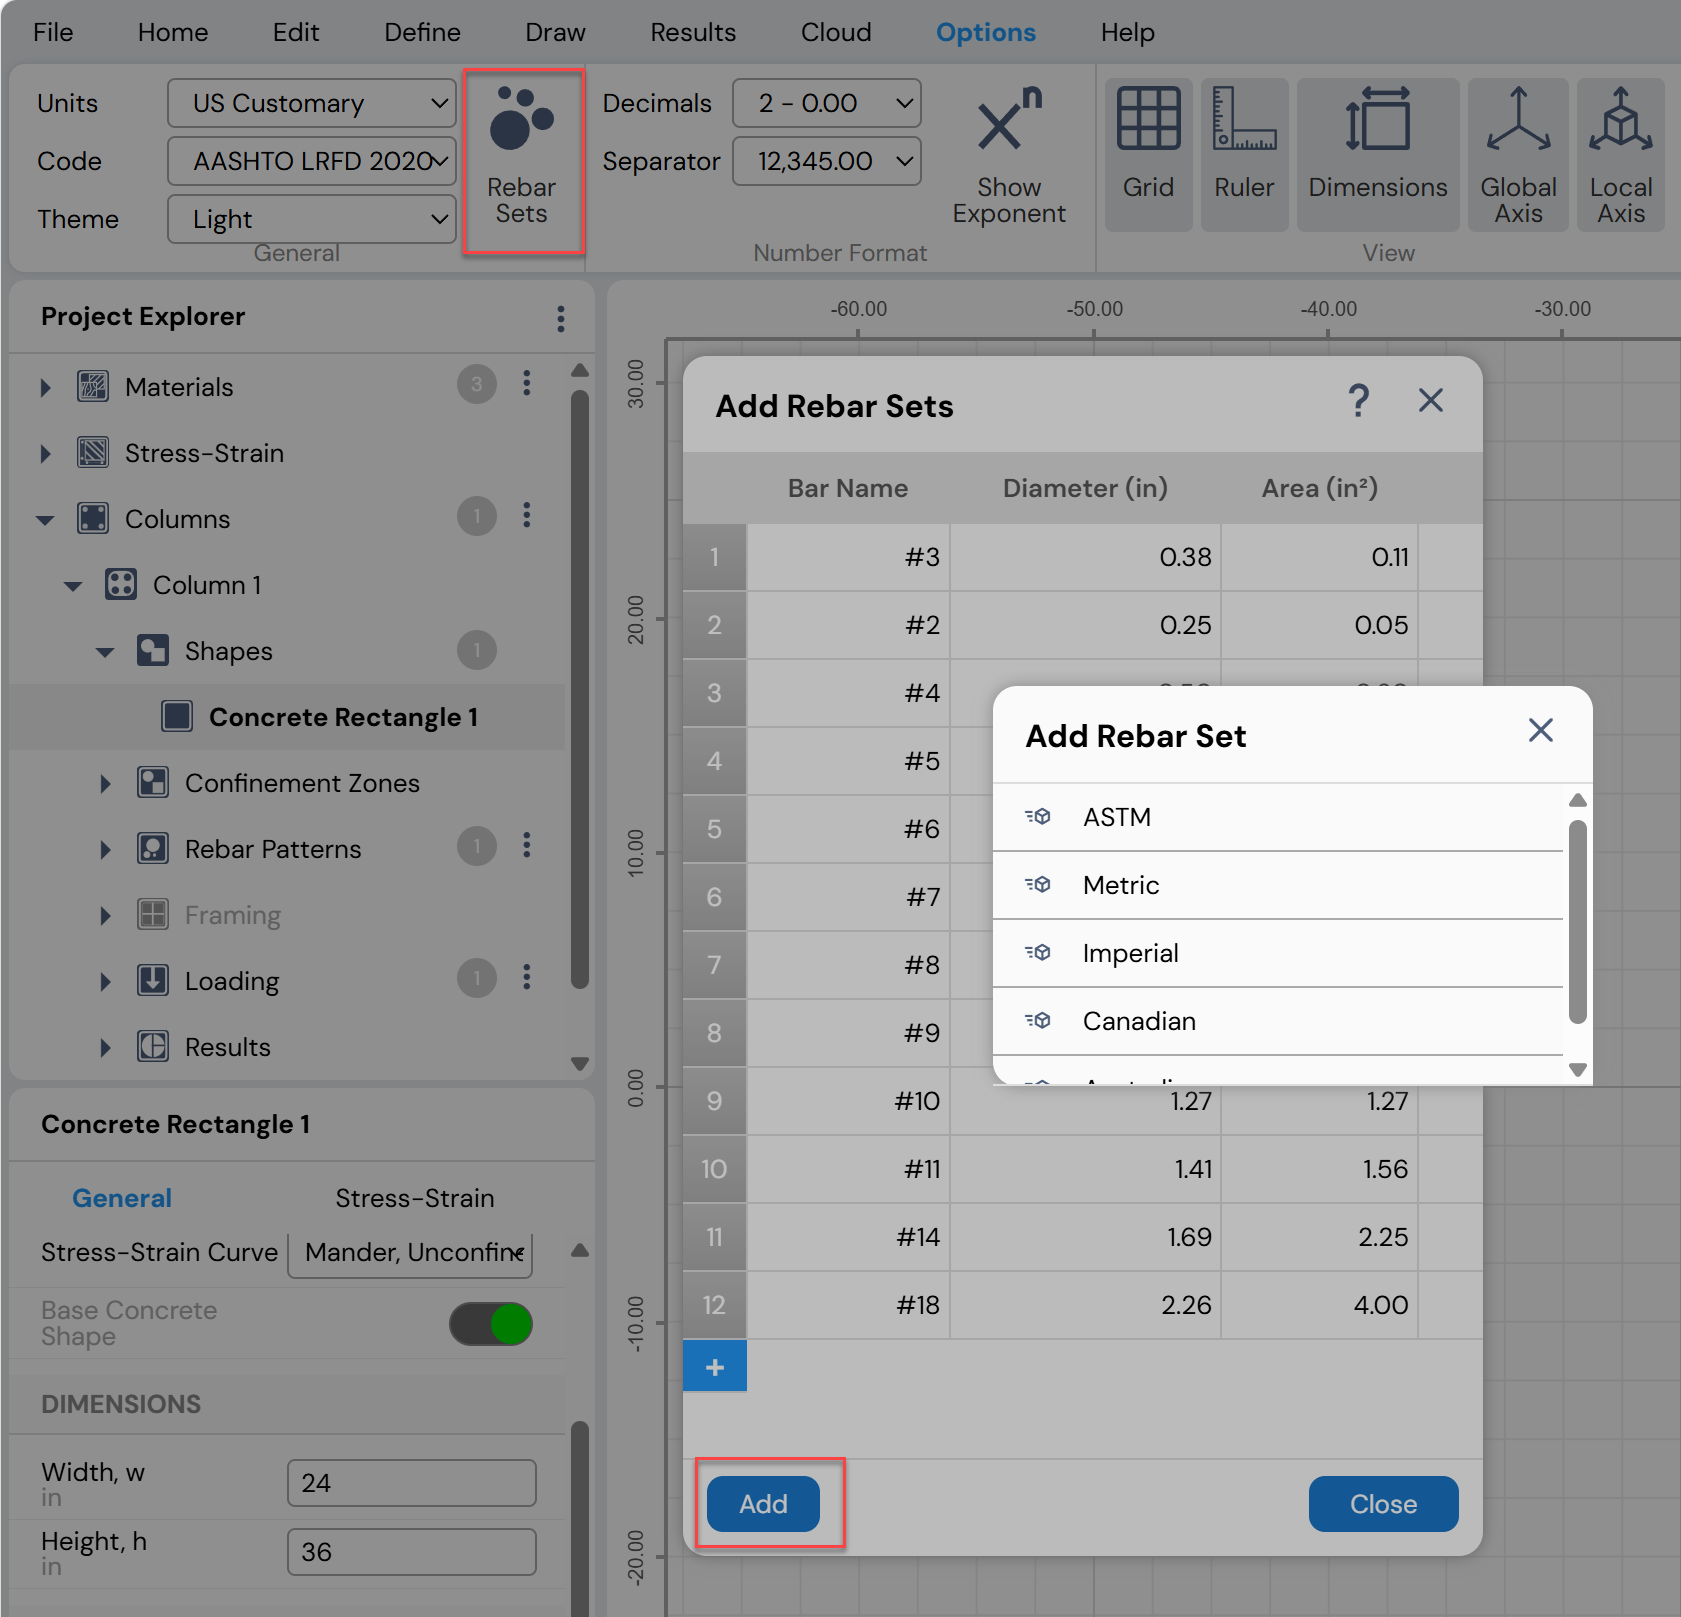
Figure: Rebar Sets Button in Options Menu
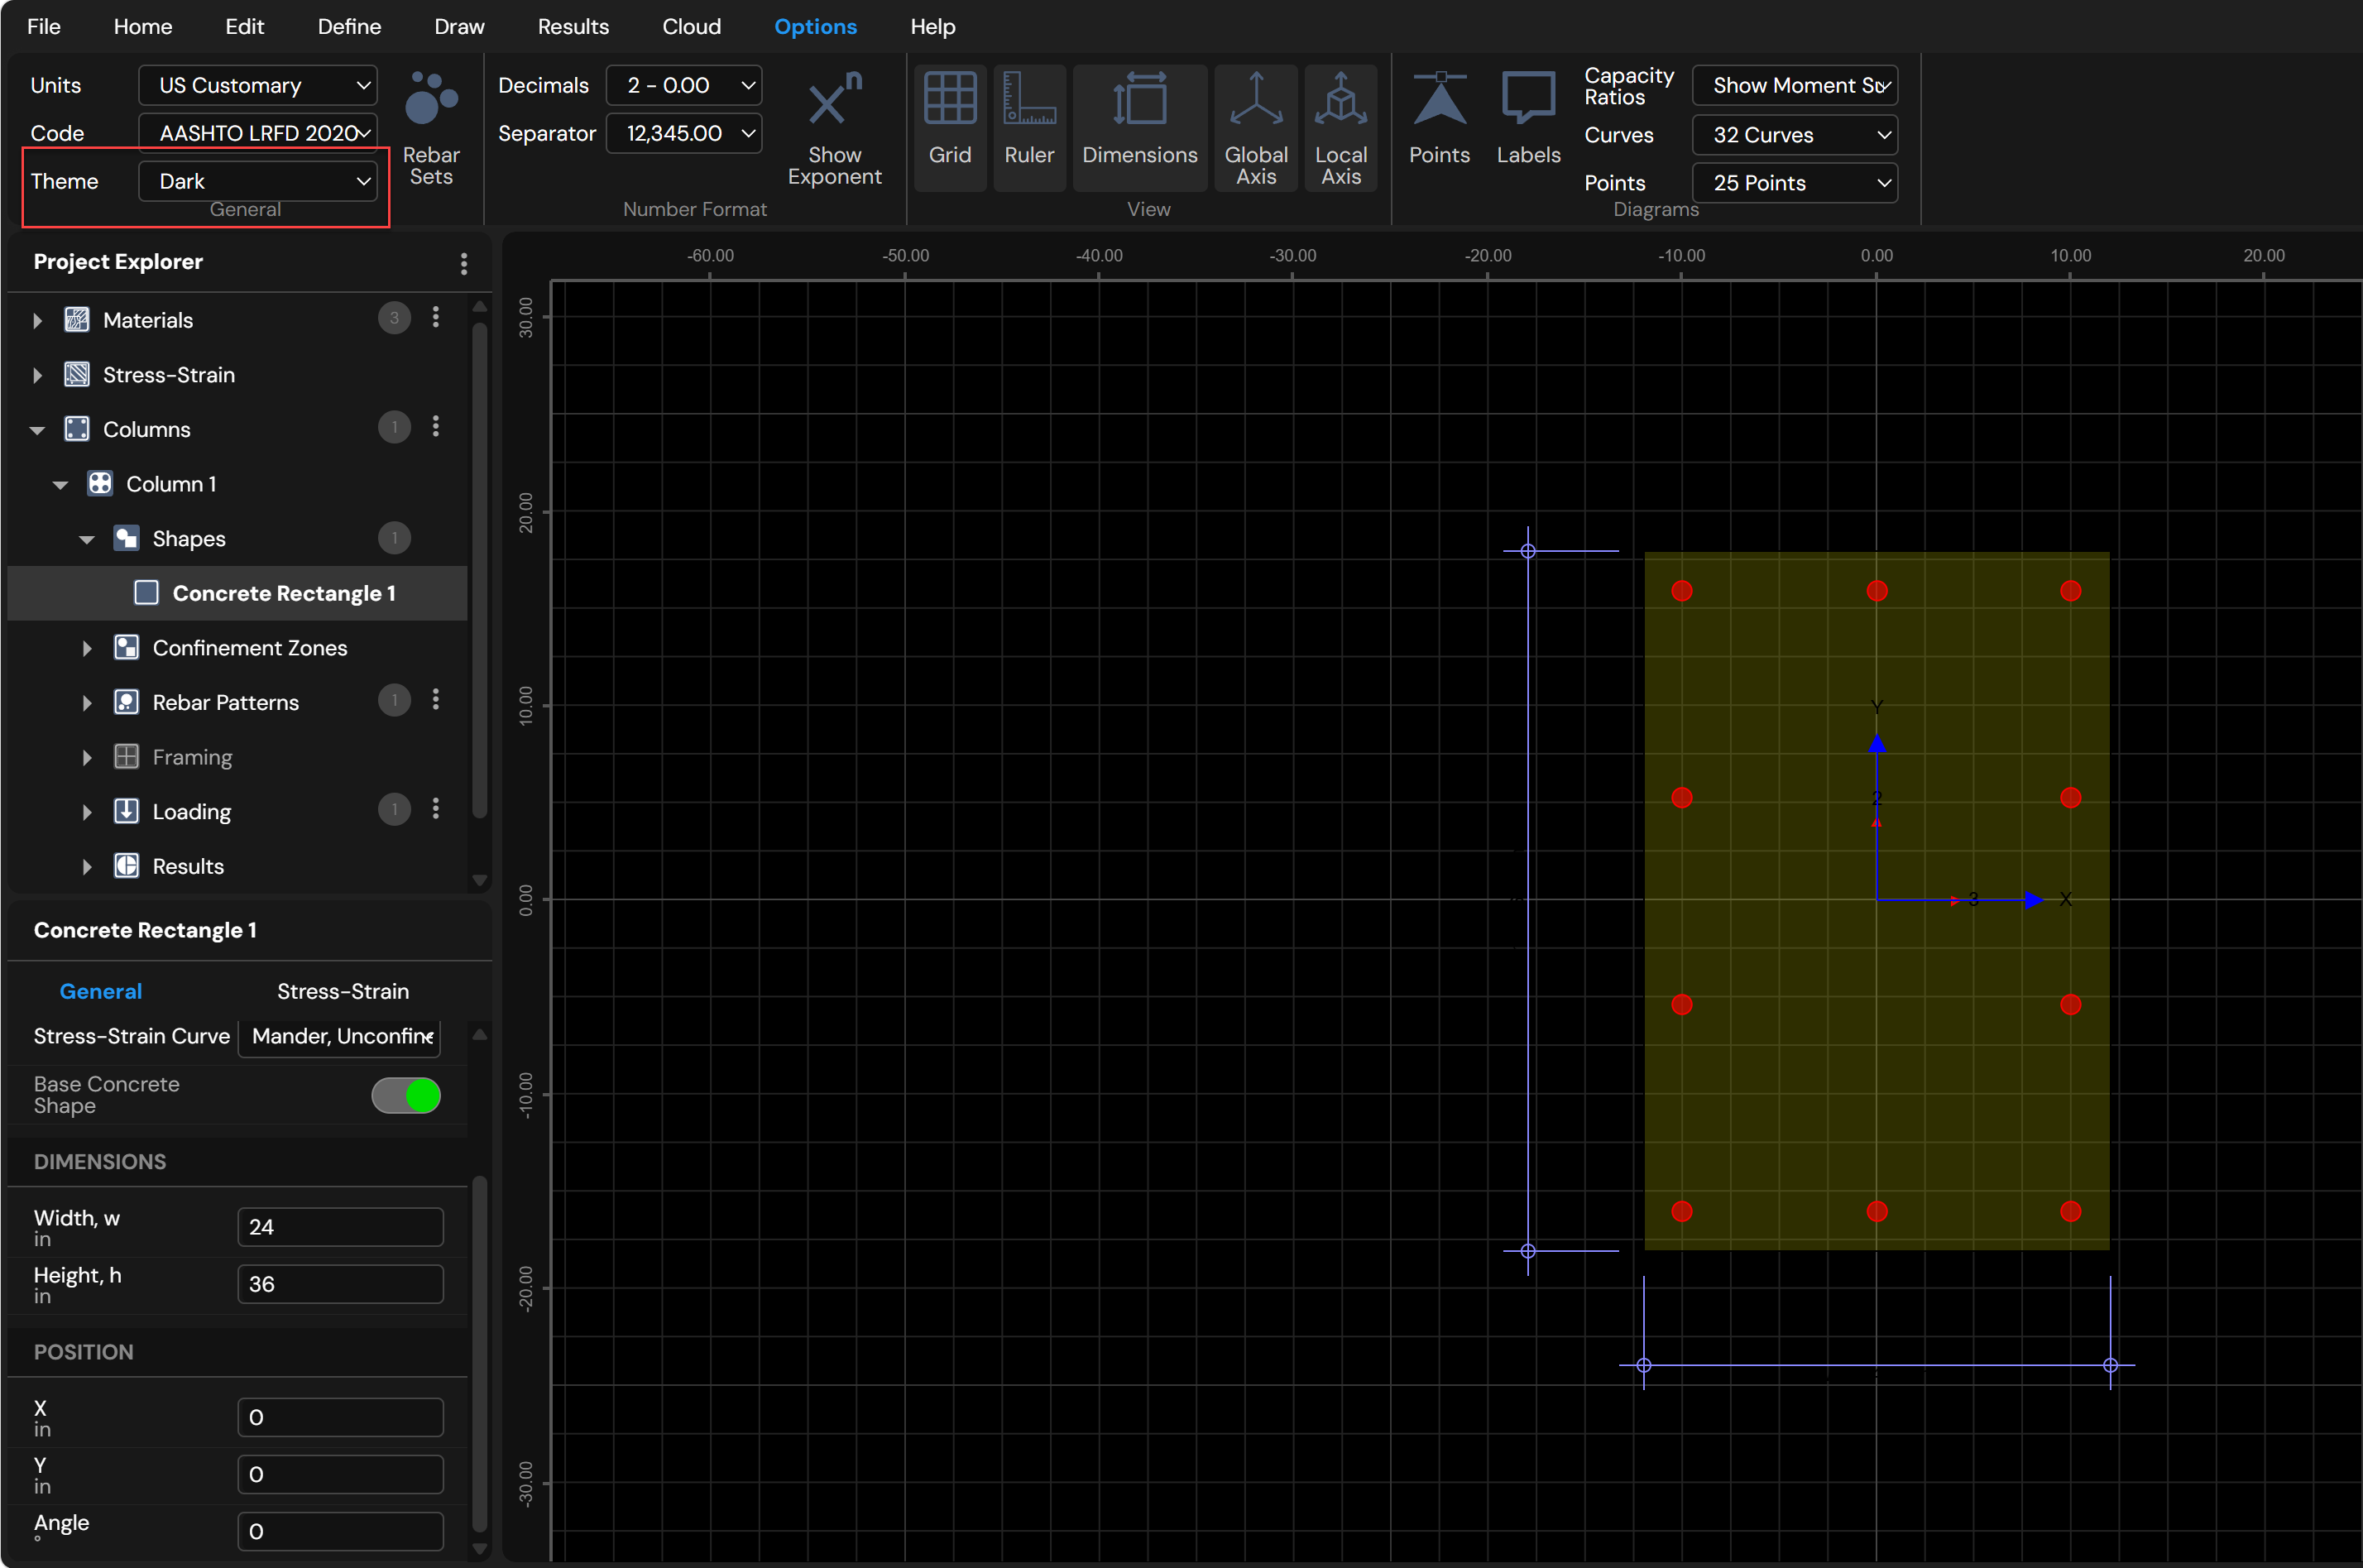
Interface Theme
Column Designer supports both light and dark display themes. Users can switch between them by selecting the desired option from the Theme dropdown, located in the General group under the Options menu.
Number Formatting Options
Number formatting settings are available under Options Menu → Number Format.
Decimals Drop-Down List
Controls the number of decimal places displayed for numeric values.
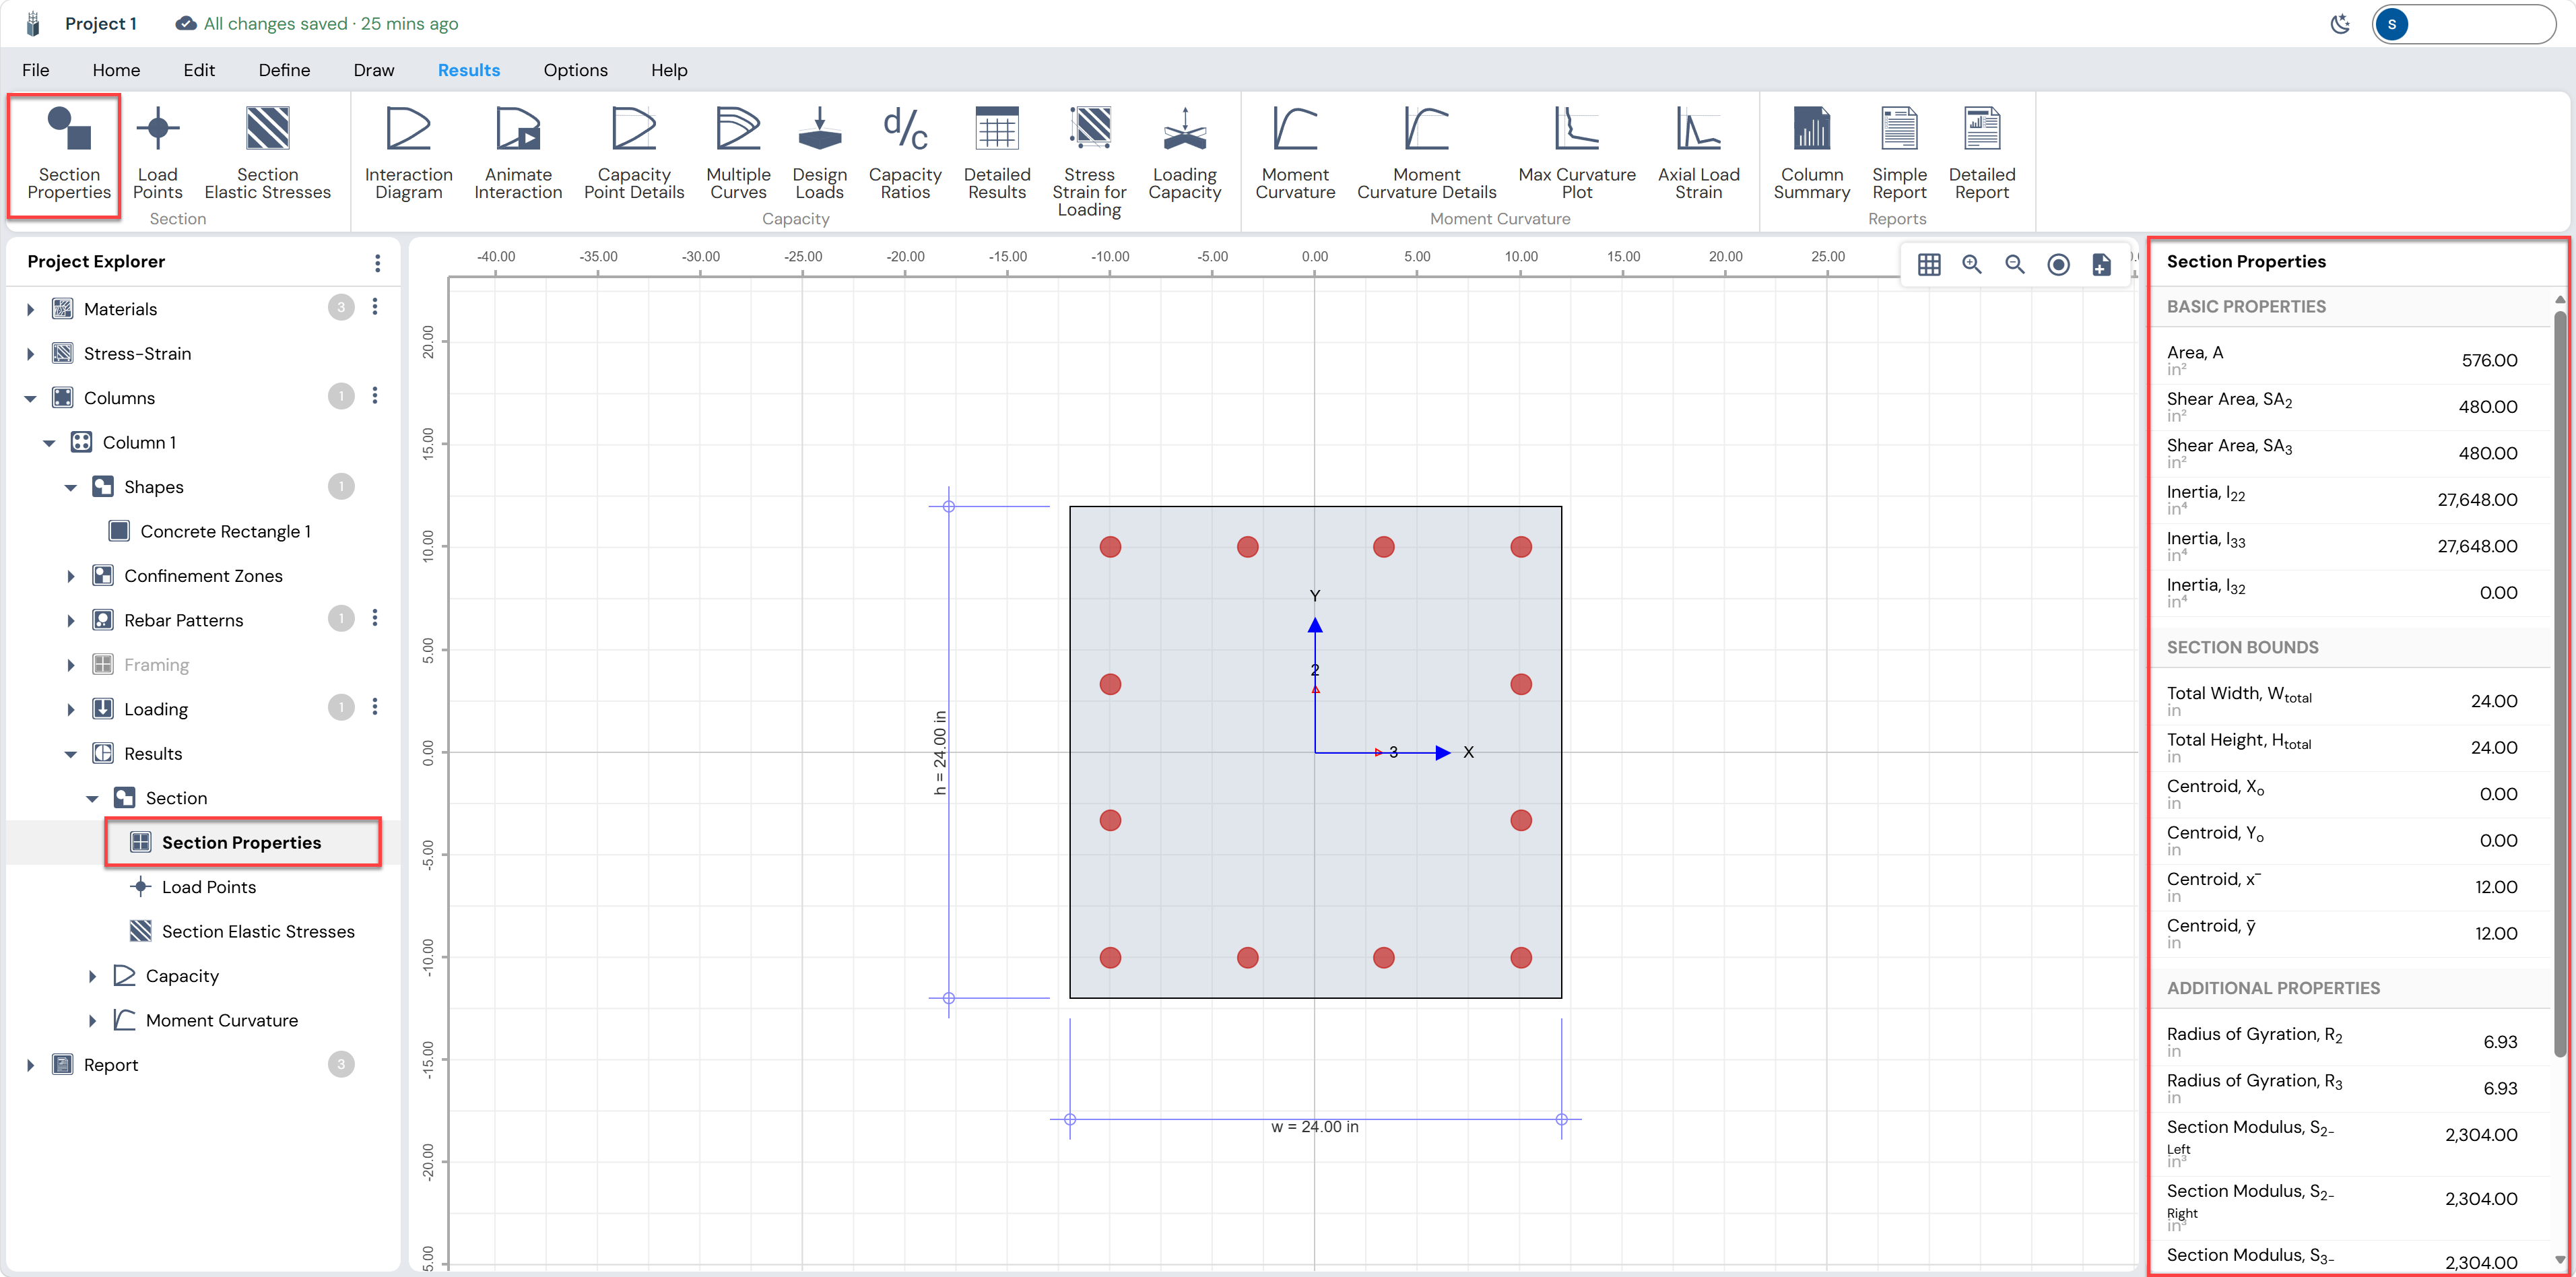
Figure: Decimals Drop-Down List in Options Menu
Separator Drop-Down List
Controls the separators used for thousands and decimal values.
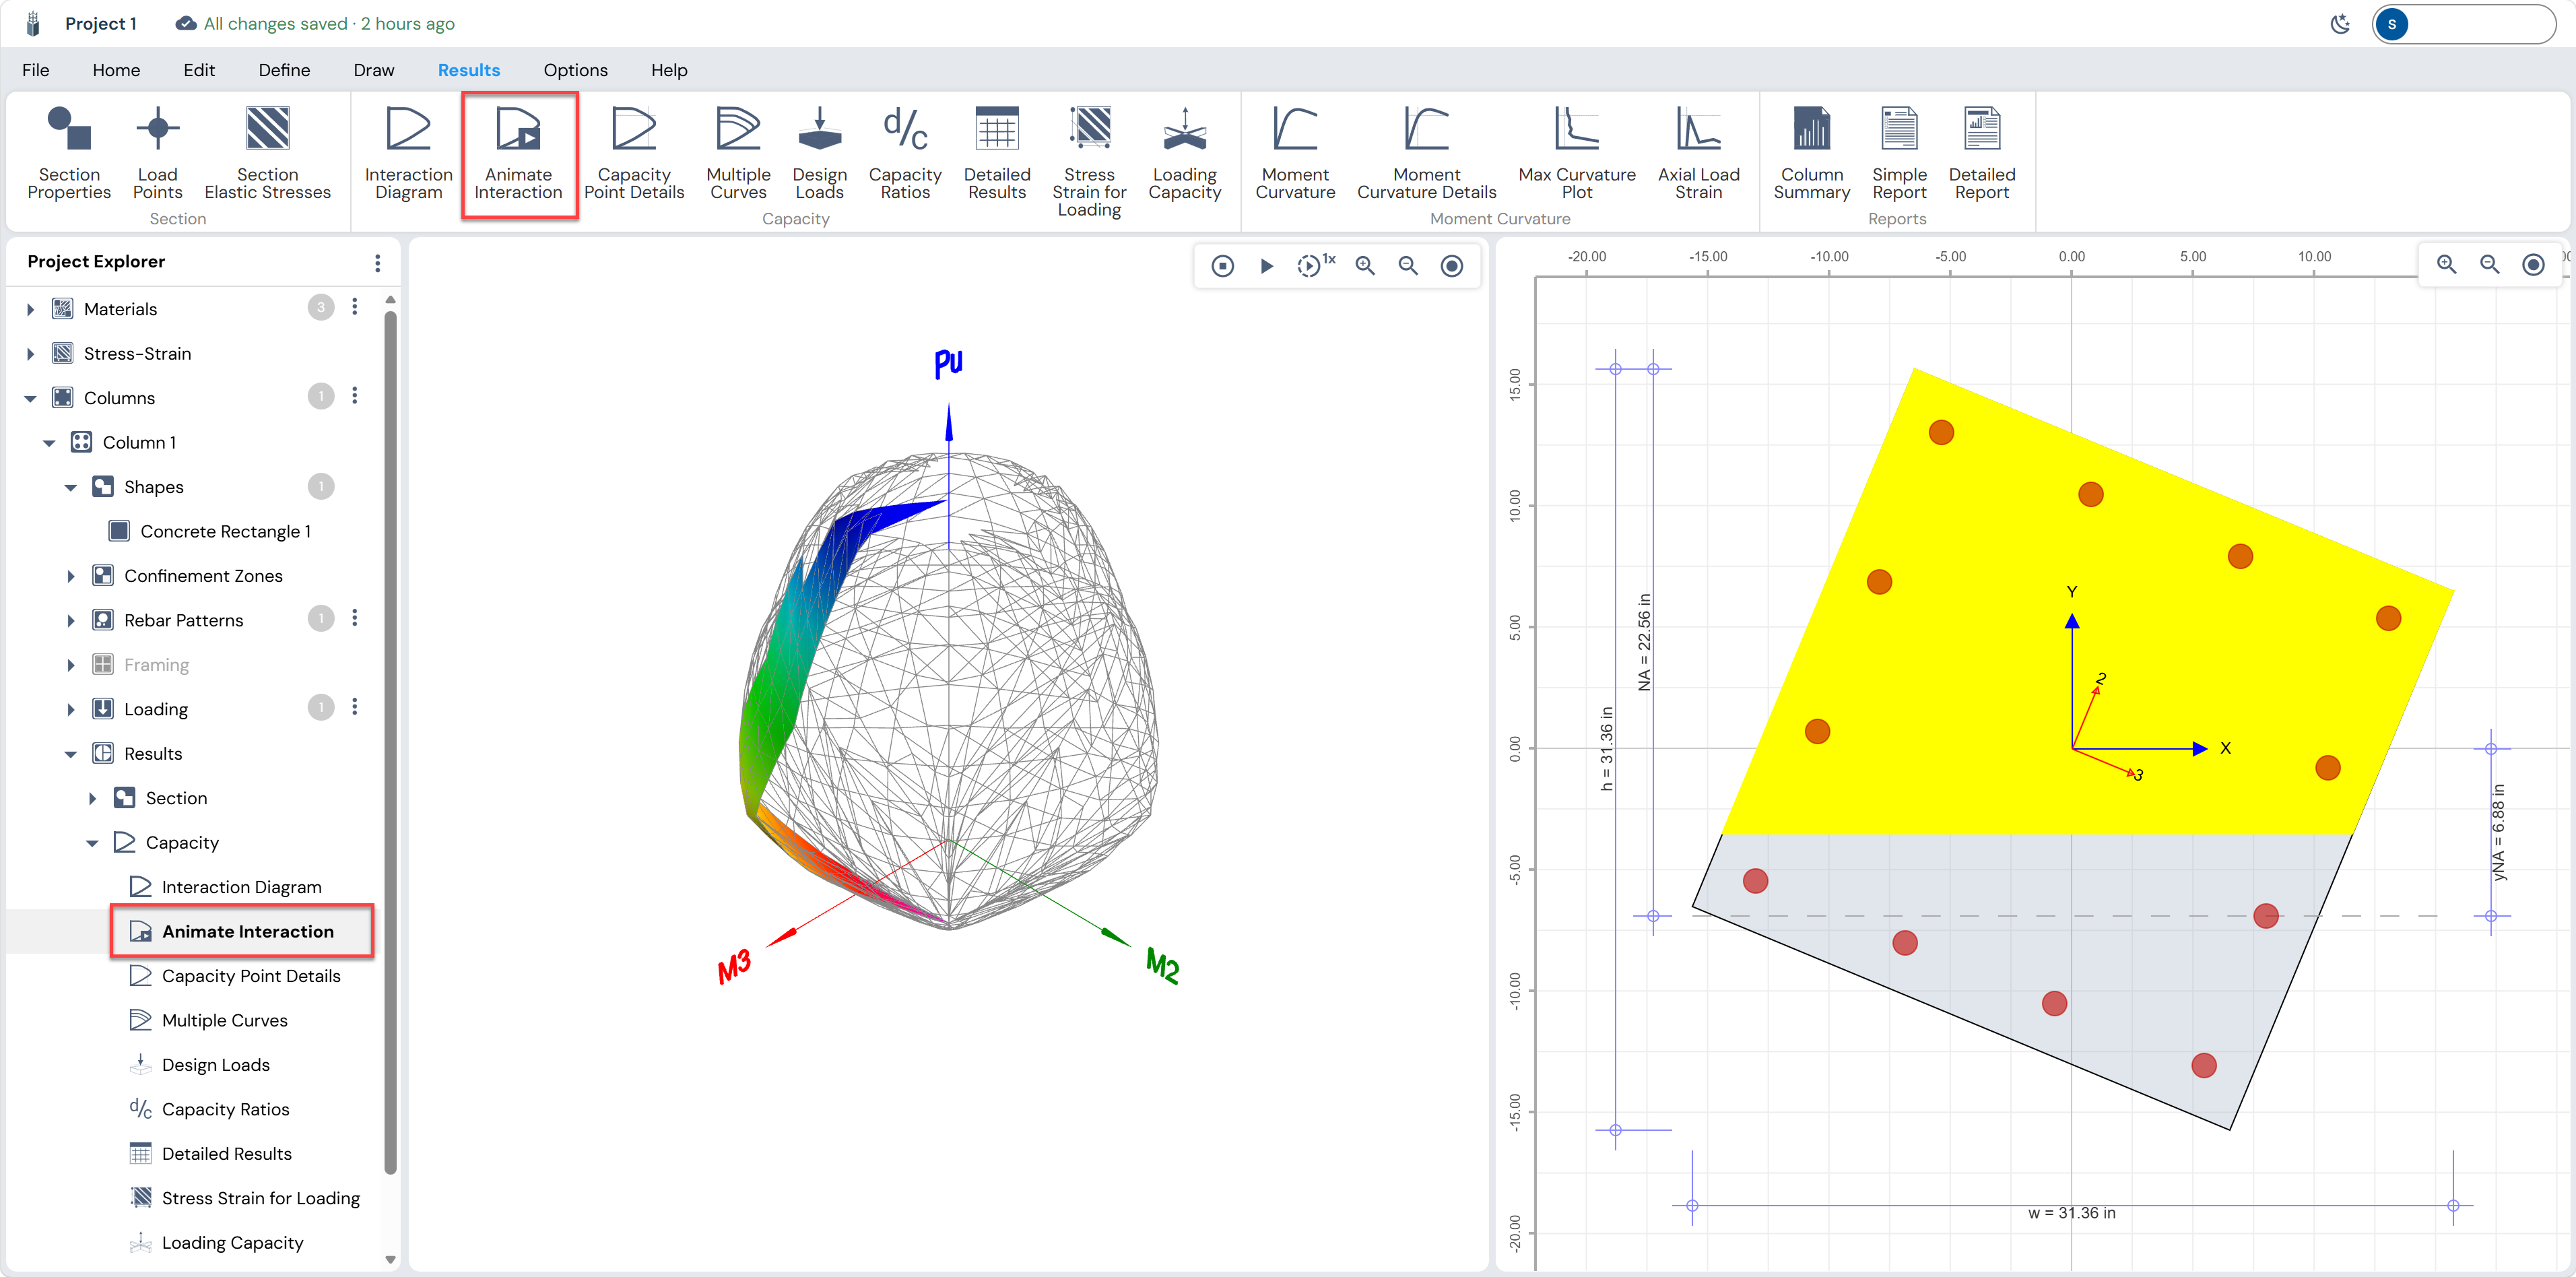
Figure: Separator Drop-Down List in Options Menu
Show Exponent Button
Displays numeric values in exponential notation when enabled.
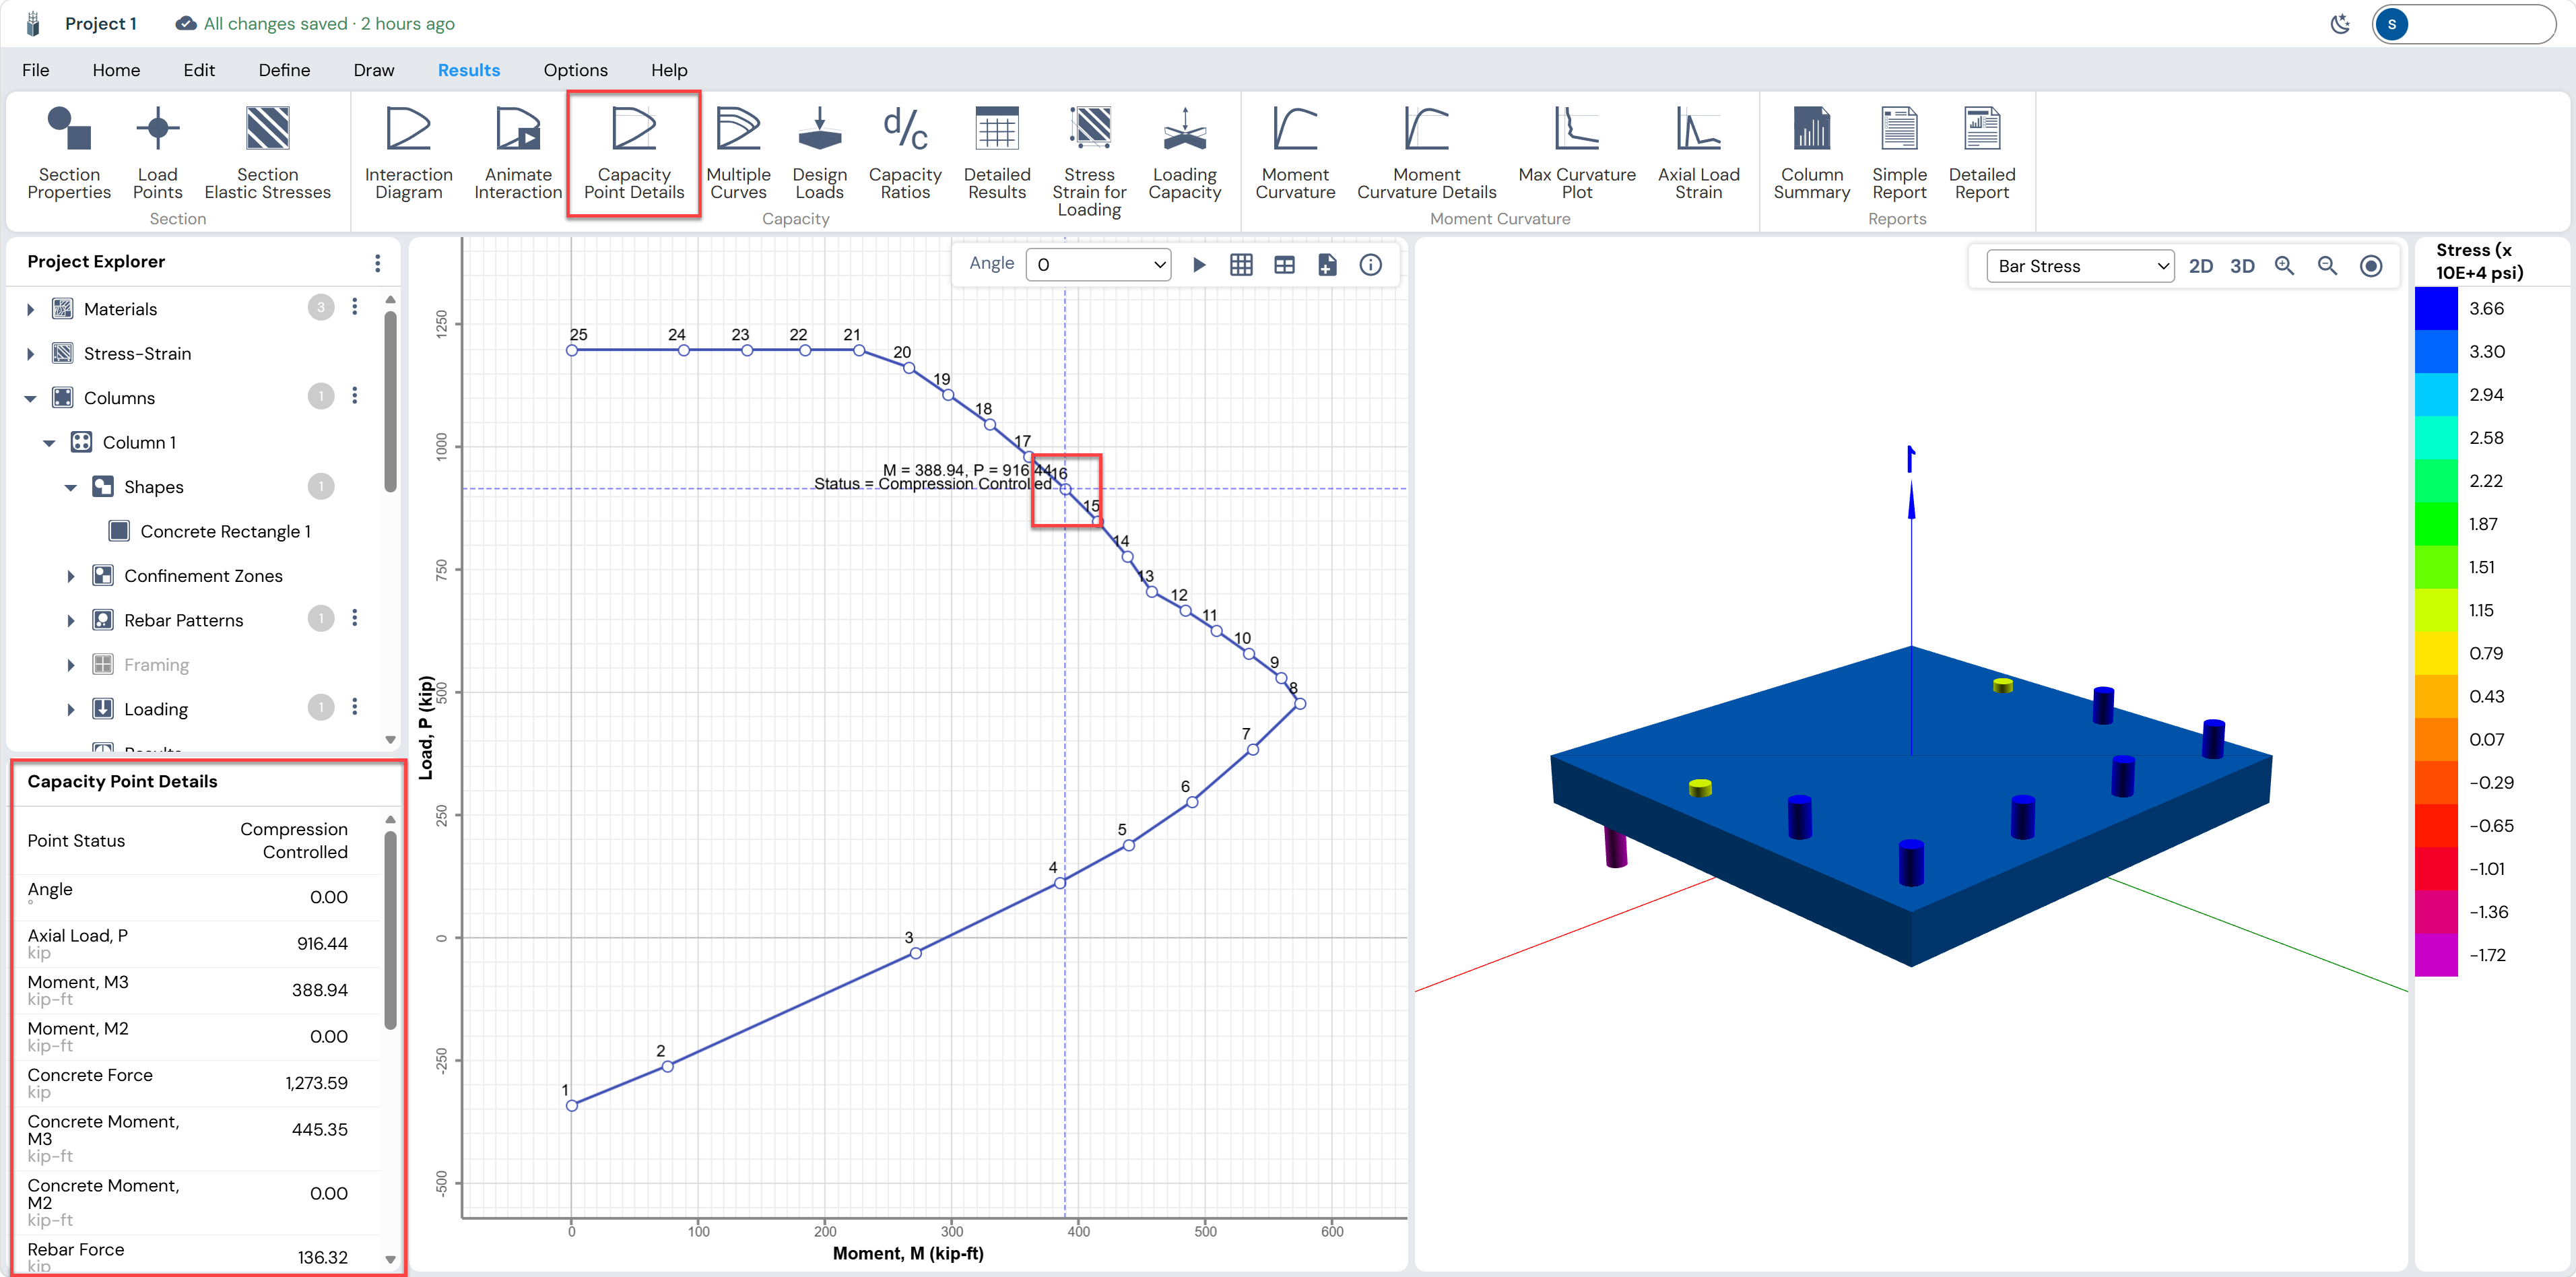
Figure: Show Exponent Button in Options Menu
View Options
View options are available under Options Menu → View and control visibility of working-area elements.
Available toggles:
Grid – Show or hide the working grid
Ruler – Show or hide the ruler
Dimensions – Show or hide shape and rebar dimensions
Global Axis – Show or hide global X and Y axes
Local Axis – Show or hide local 2 and 3 axes

Figure: View Options in Options Menu
Diagram Options
Diagram display settings are available under Options Menu → Diagrams.
Available options:
- Points – Show or hide data points
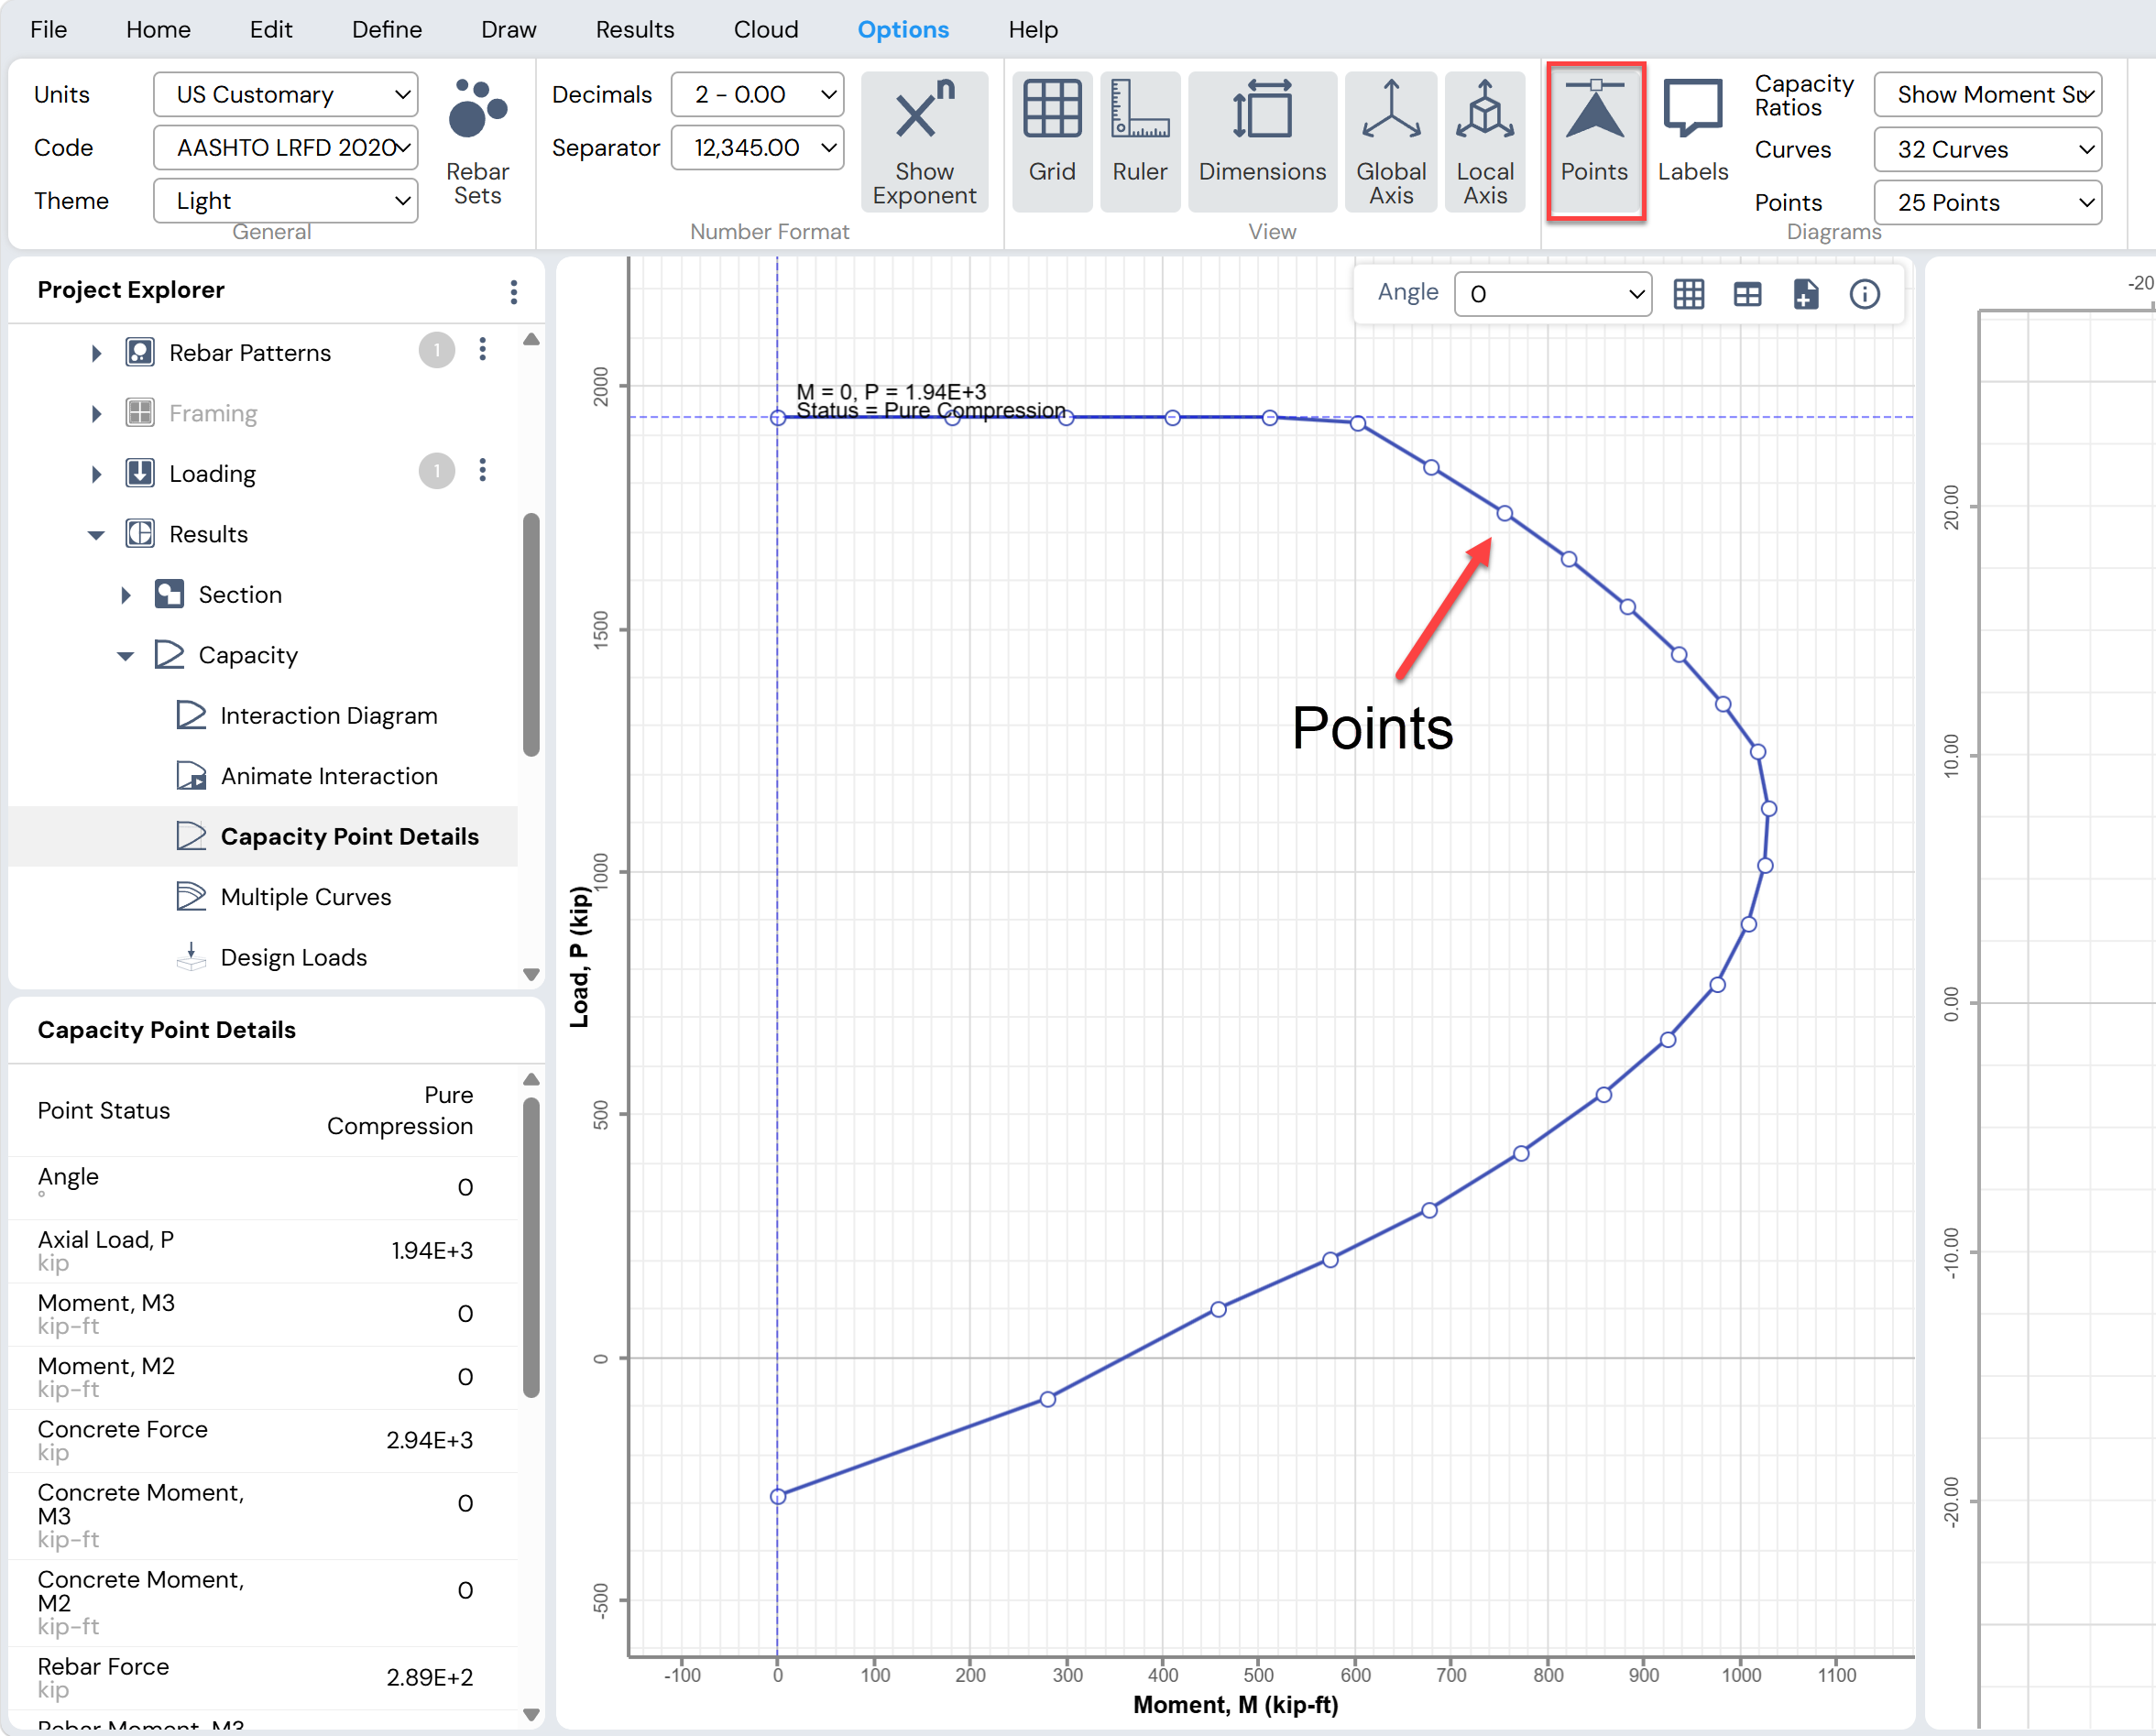
Figure: Diagram Points Option in Options Menu
- Labels – Show or hide data point labels
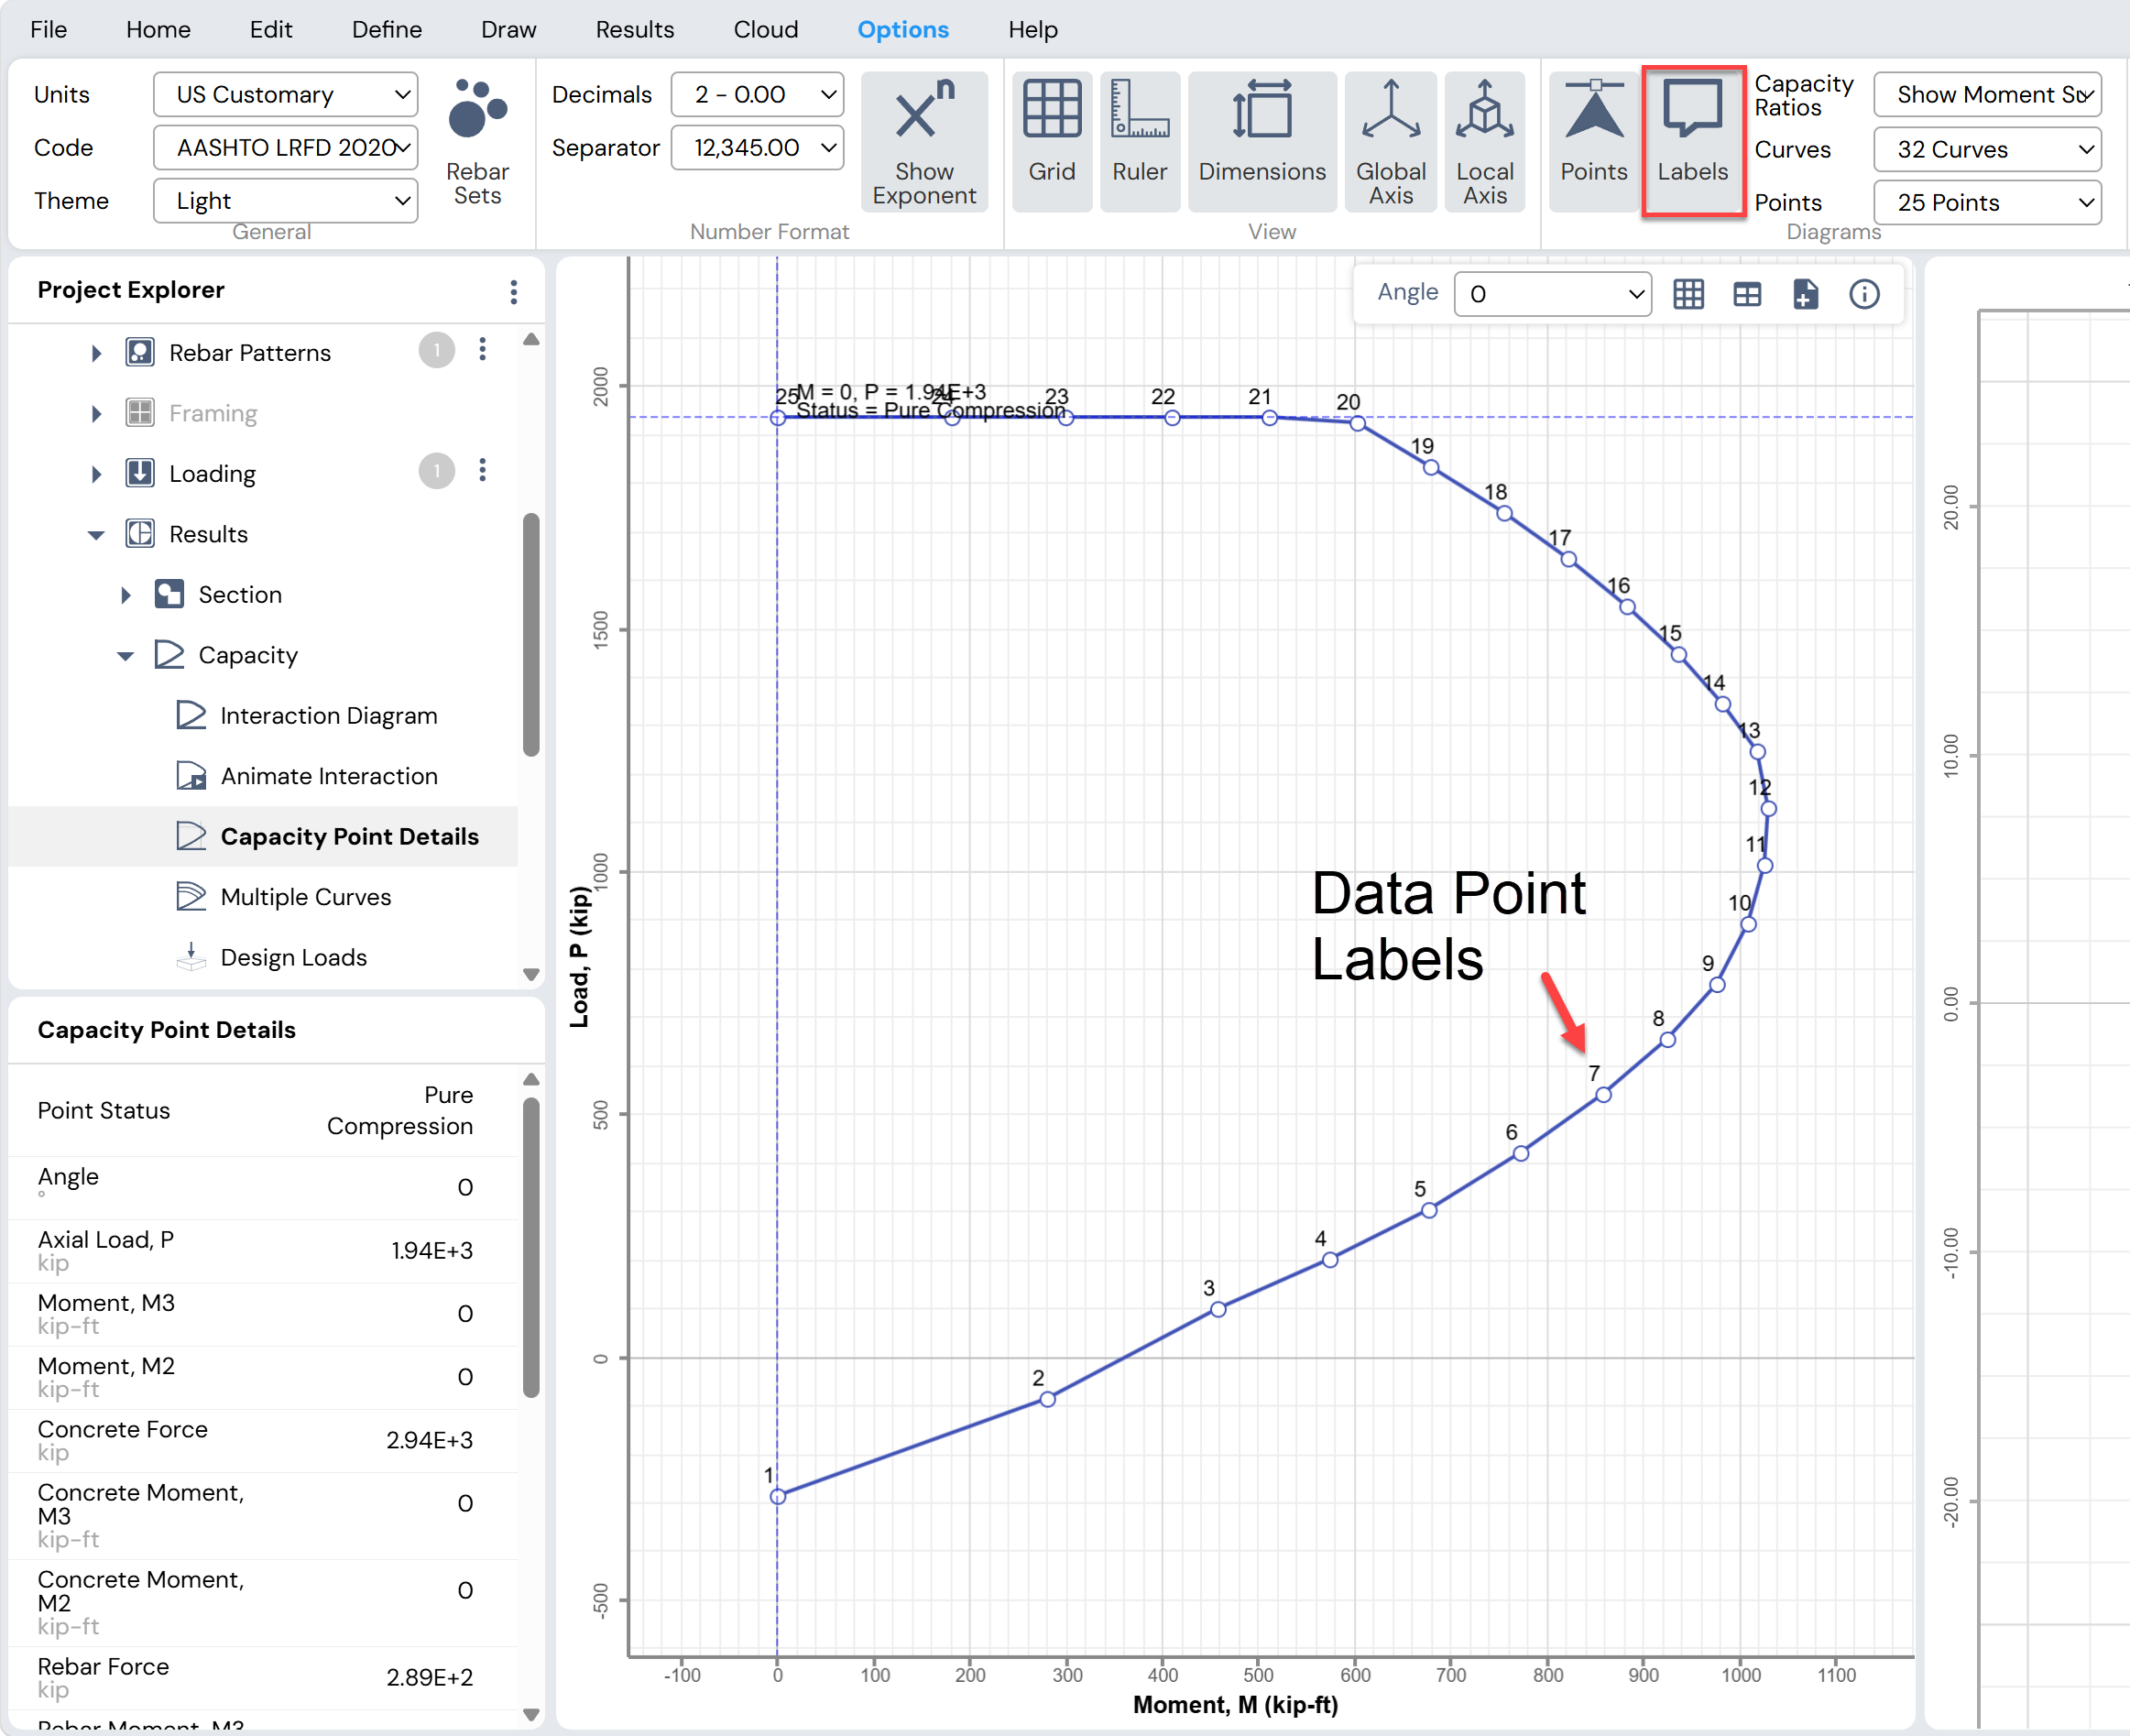
Figure: Data Points Label Option in Options Menu
- Curves Drop-Down List – Specify the number of curves for interaction diagrams
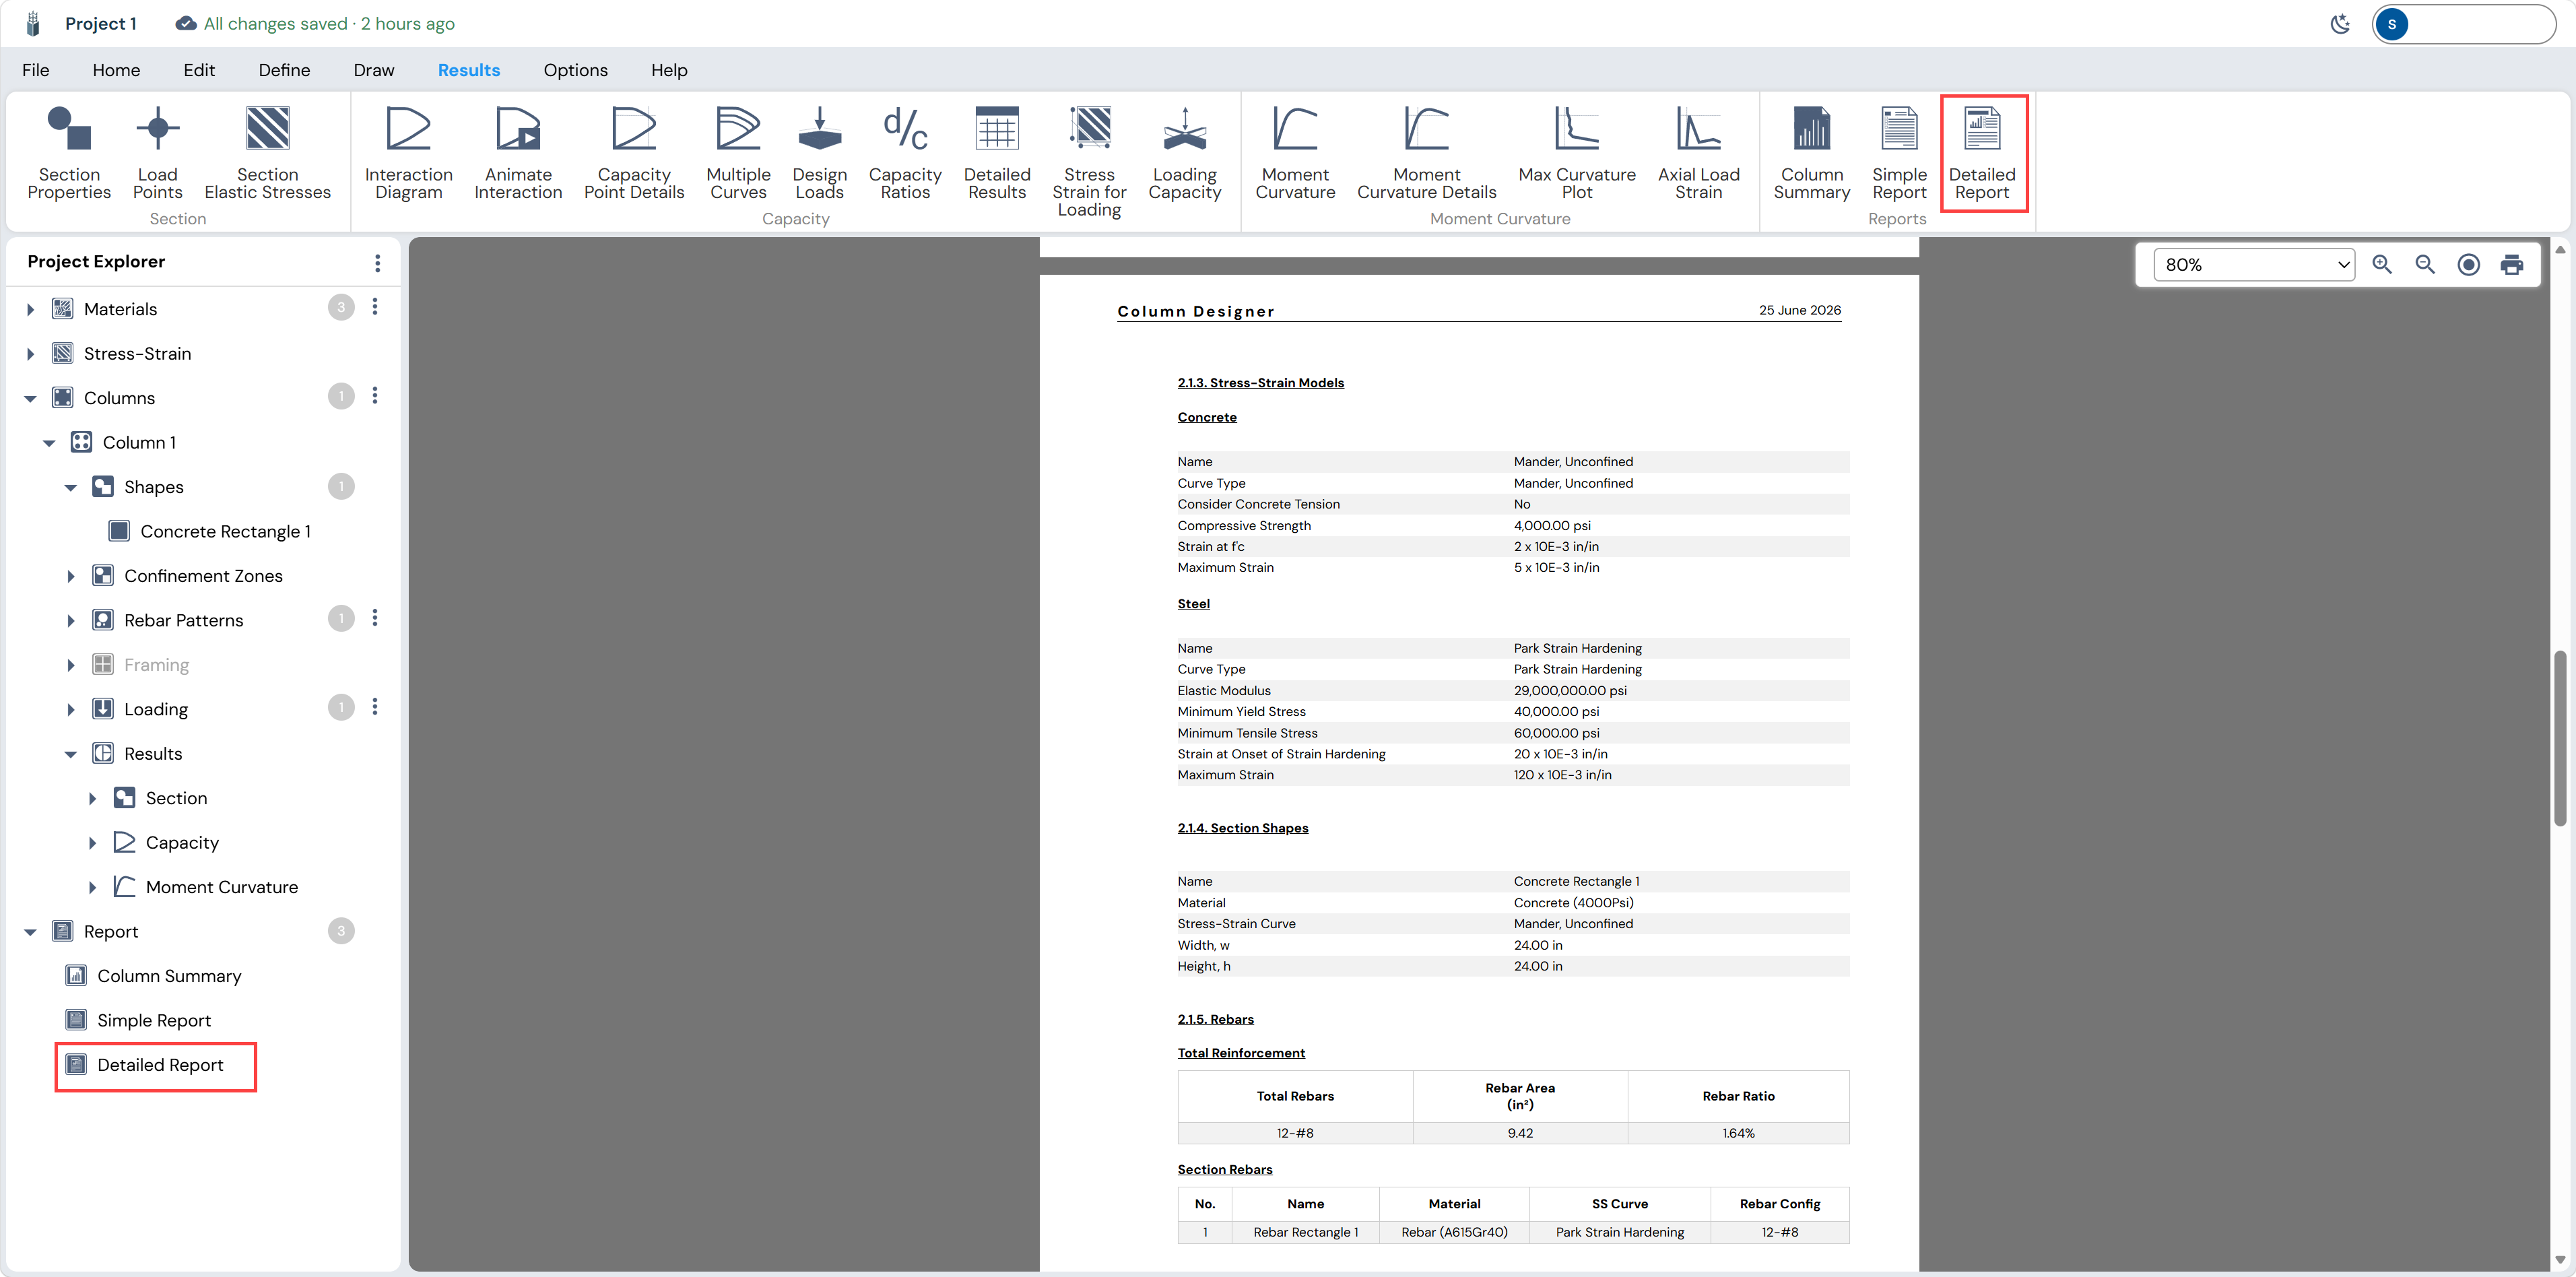
Figure: Curves Drop-Down List in Options Menu
- Points Drop-Down List – Specify the number of points displayed on diagrams
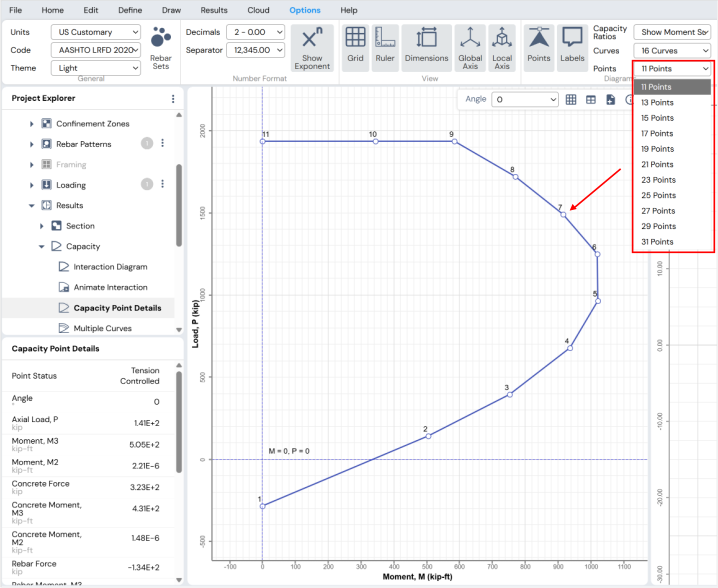
Figure: Points Drop-Down List in Options Menu
Strength Reduction Factors / Partial Safety Factors
Strength reduction factors (or Partial Safety Factors, depending on the selected design code) can be modified under:
- Options Menu → Strength Reduction Factors
These factors are used to generate P–M interaction curves.
Note:
By default, these values are set according to the selected design code.

Designing Columns
This section describes how to use Column Designer to efficiently create column sections and compute their capacities. It also explains the overall column design process implemented in the program.
It is strongly recommended that users read this section before using Column Designer. This section assumes that the user is familiar with:
Basic concepts of structural mechanics
Structural analysis
Fundamental principles of column design
Column Design Problem
In column design, the engineer must determine the following parameters:
Appropriate cross-sectional dimensions
Cross-section shape
Material properties
Amount and distribution of reinforcement
These parameters are selected based on:
Applied actions (axial loads and moments)
Column geometry
Framing and boundary conditions
Column Designer provides a set of convenient and powerful tools to assist engineers in determining the most effective and efficient design parameters for a given set of applied actions.
These tools include:
Quick Design Wizard
Templates
Shape Libraries
Rebar Patterns
Auto Design feature
Tools related to editing shapes within a section are described in Editing Column Cross sections.
Methods for Creating Columns
Column Designer provides several methods for creating column sections. Columns can be created using any of the following approaches.
Quick Design Wizard
File Menu → Quick Design Wizard
This option launches the Quick Design Wizard, which provides access to all the forms required to complete the entire column modeling, analysis, and design process.
Using the Quick Design Wizard, users can:
Define column geometry and cross-section
Specify framing conditions
Apply loads
Generate analysis results
Create design reports
This method represents the default and recommended process for creating rectangular or circular columns.
Blank Model
File Menu → Blank Model
This option opens a blank working area that can be used to create a column of any shape.
With this method:
Shapes must be added using the tools available under the Draw Menu
Shapes are modified using the tools available under the Edit Menu
Column framing and loading must be defined independently using the Define Menu
Analysis results are generated using the Results Menu
Reports can be viewed from:
Results Menu → Reports, or
Project Explorer → Report
This method provides maximum flexibility for creating custom and complex sections.
Rectangular Model
File Menu → Rectangular Model
This option creates a predefined rectangular column section.
After creating the rectangular section:
Column framing and loading must be defined using the Define Menu
Analysis results are generated using the Results Menu
Reports can be viewed from:
Results Menu → Reports, or
Project Explorer → Report
Circular Model
File Menu → Circular Model
This option creates a predefined circular column section.
After creating the circular section:
Column framing and loading must be defined using the Define Menu
Analysis results are generated using the Results Menu
Reports can be viewed from:
Results Menu → Reports, or
Project Explorer → Report
Editing Column Sections
After a column section has been created using any of the methods described above, the shapes comprising the section can be edited using the tools described in Editing Column Cross section.
These tools allow the user to:
Add or delete shapes
Modify shape geometry
Add, change, or distribute reinforcement
Quick Design Wizard
The Quick Design Wizard appears when Column Designer is started.
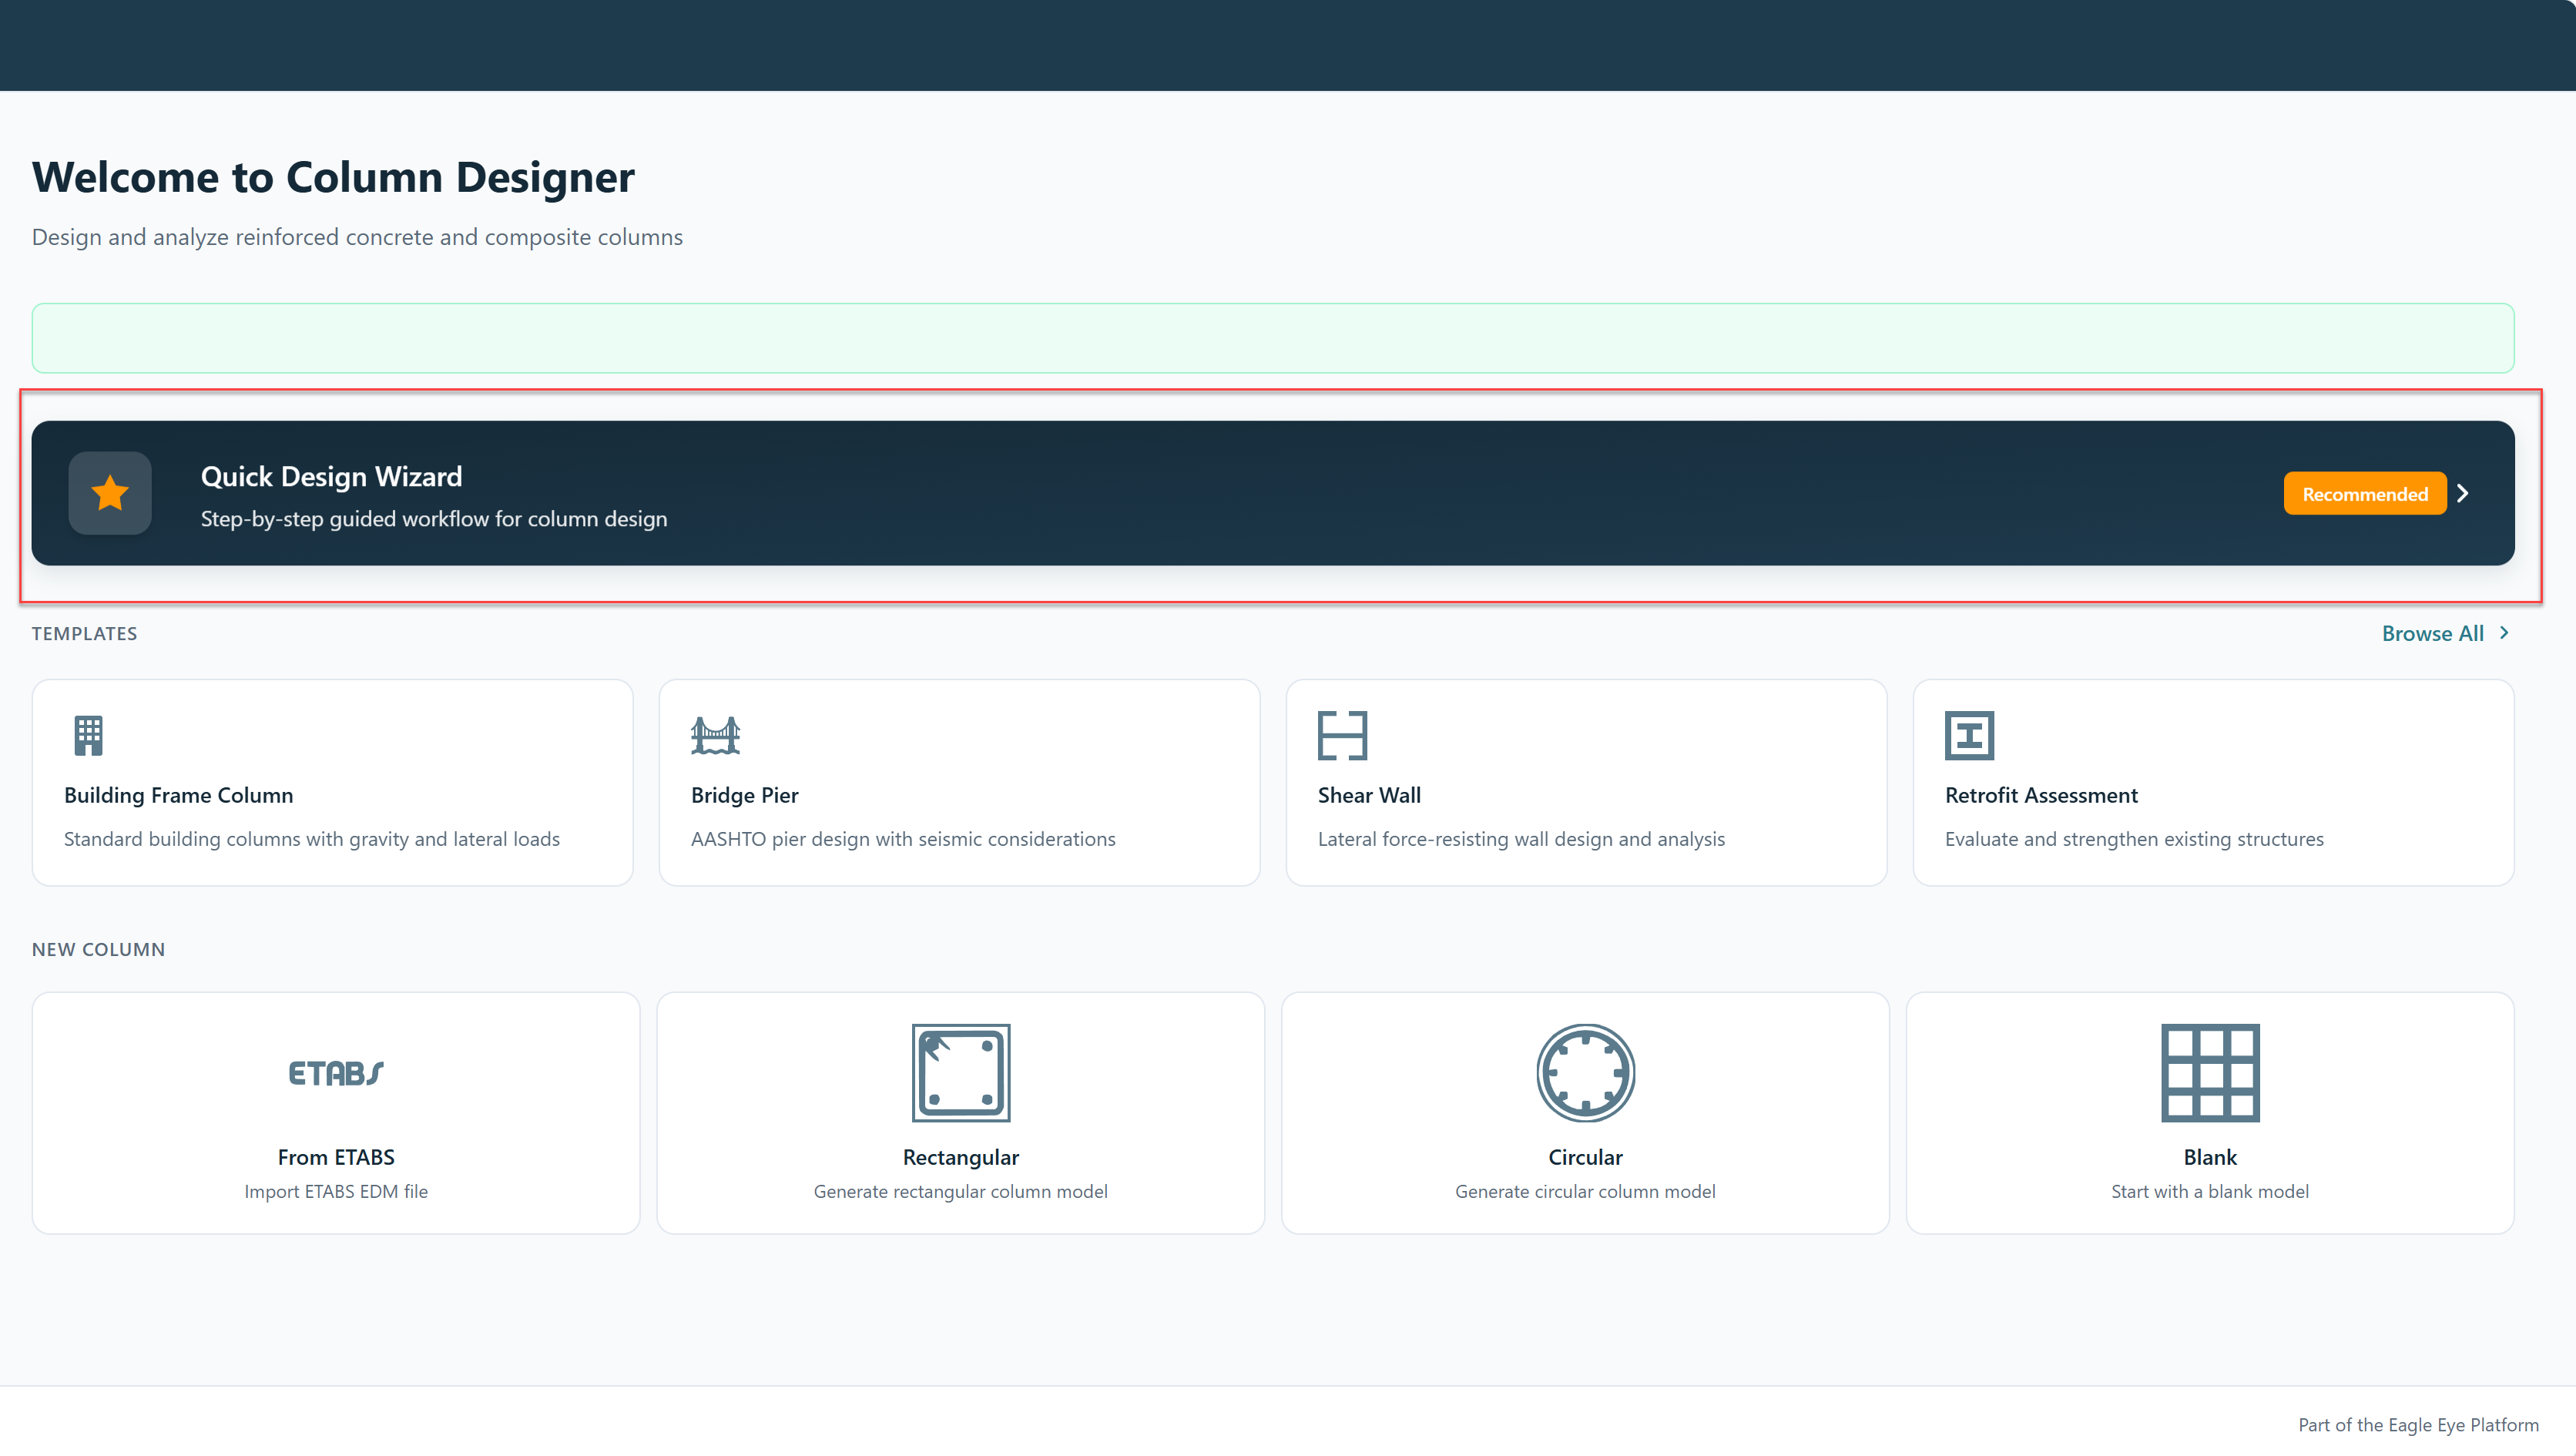
The general process for using the Quick Design Wizard is described below.
Using the Quick Design Wizard
- Access the Quick Design Wizard
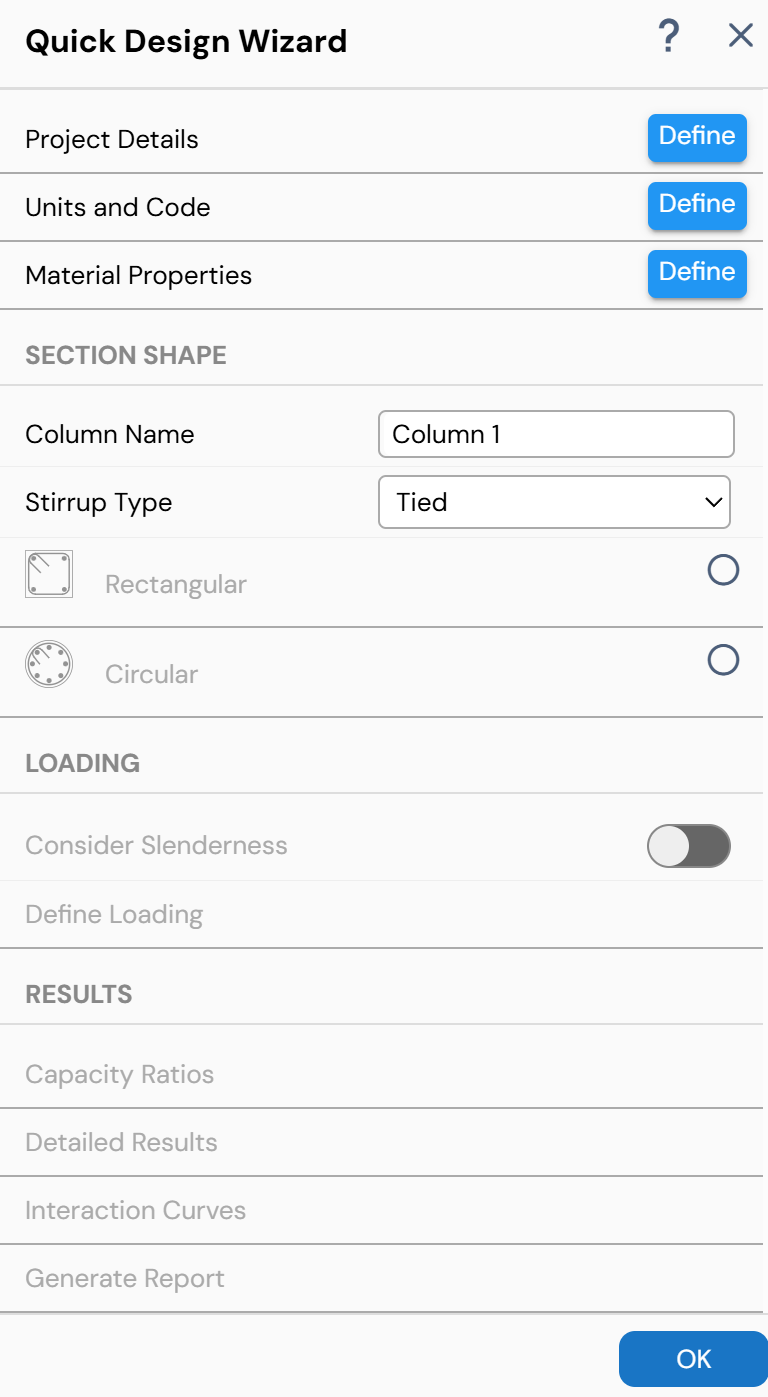
Click Quick Design Wizard to open the Quick Design Wizard form.
Figure: Quick Design Wizard Form
- Project Details
Click the Define button next to Project Details to open the Project Information form.
Figure: Project Details Option in Quick Design Wizard FormEnter project-related information such as:
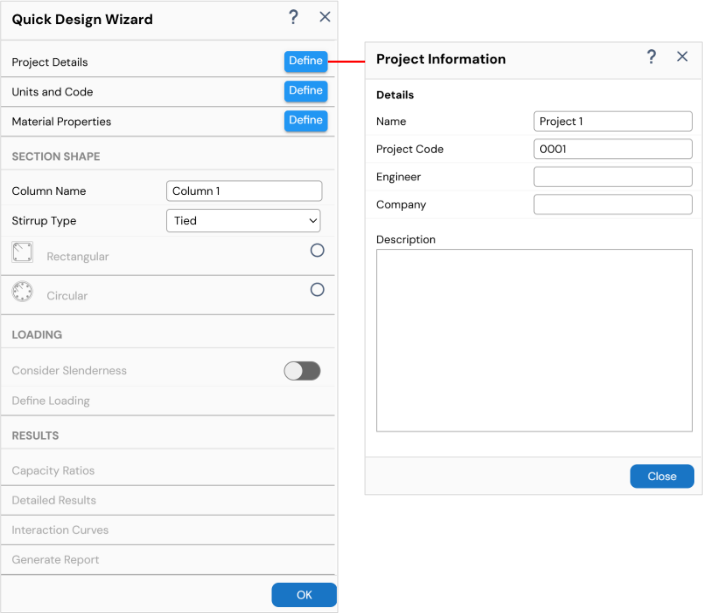
Project Name
Project Code
Engineer
Company
The Project Information form can also be accessed later from:
Define Menu → Project → Project Details

Figure: Project Details Option in Define Menu
The information entered here appears at the beginning of the detailed reports generated for the Project File.
- Units and Code
Click the Define button next to Units and Code to open the Options form.
Figure: Units and Code Option in Quick Design Wizard FormReview and accept the default values or modify parameters such as:
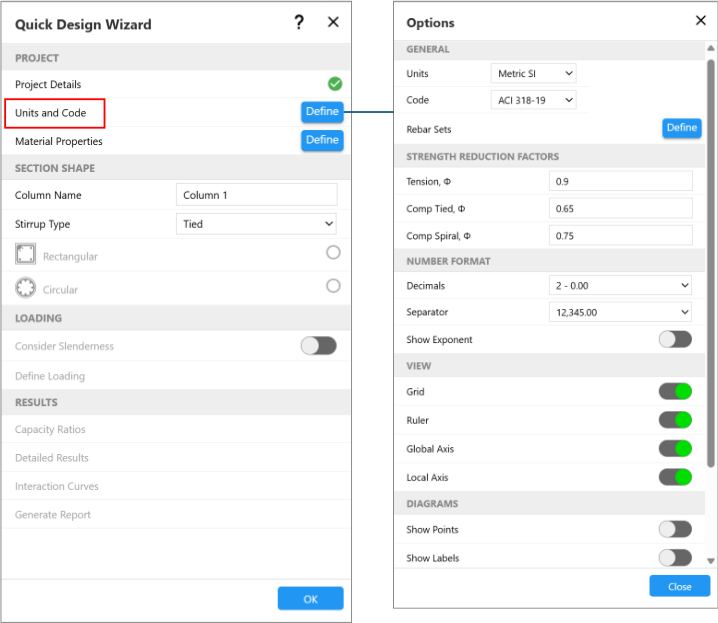
Working units
Design code
Number format
These settings can also be modified later using the drop-down lists under the Options Menu.
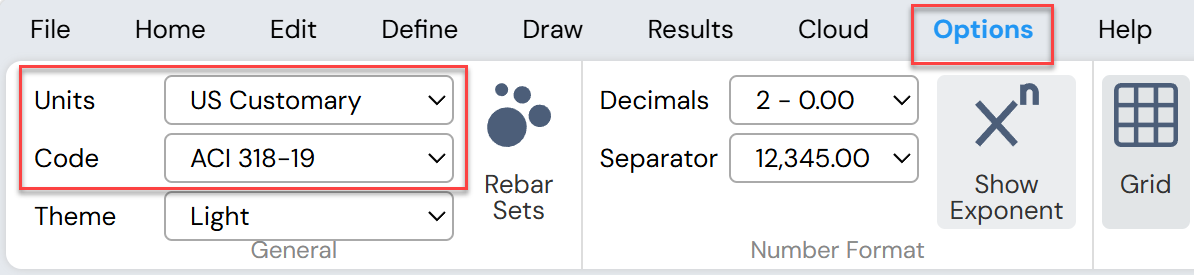
Figure: Units and Code Option in Options Menu
- Material Properties
Click the Define button next to Material Properties to access the Material Properties form.
Figure: Material Properties Option in Quick Design Wizard FormThis form contains separate tabs for:
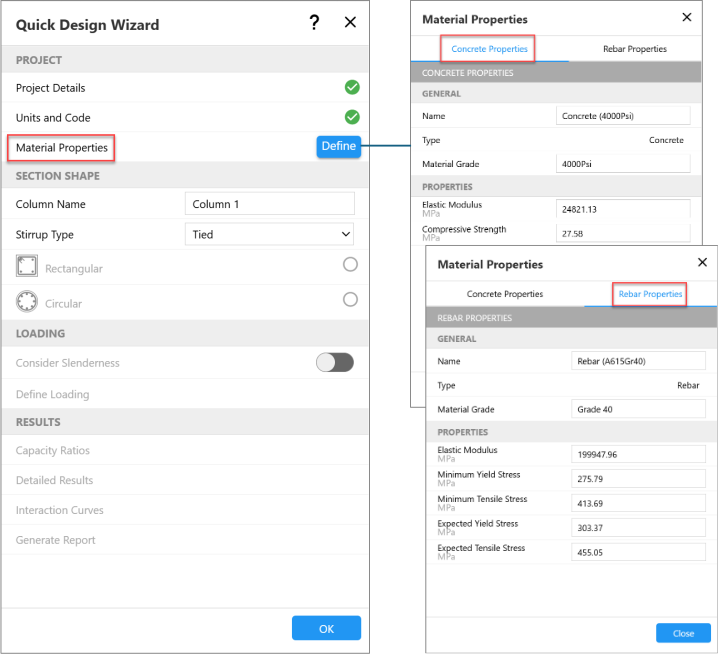
Concrete materials
Rebar materials
Review the default values or enter the desired material properties.
The Material Properties form can also be accessed later from:
Define Menu → Project → Materials, or
The button next to Project Explorer → Materials
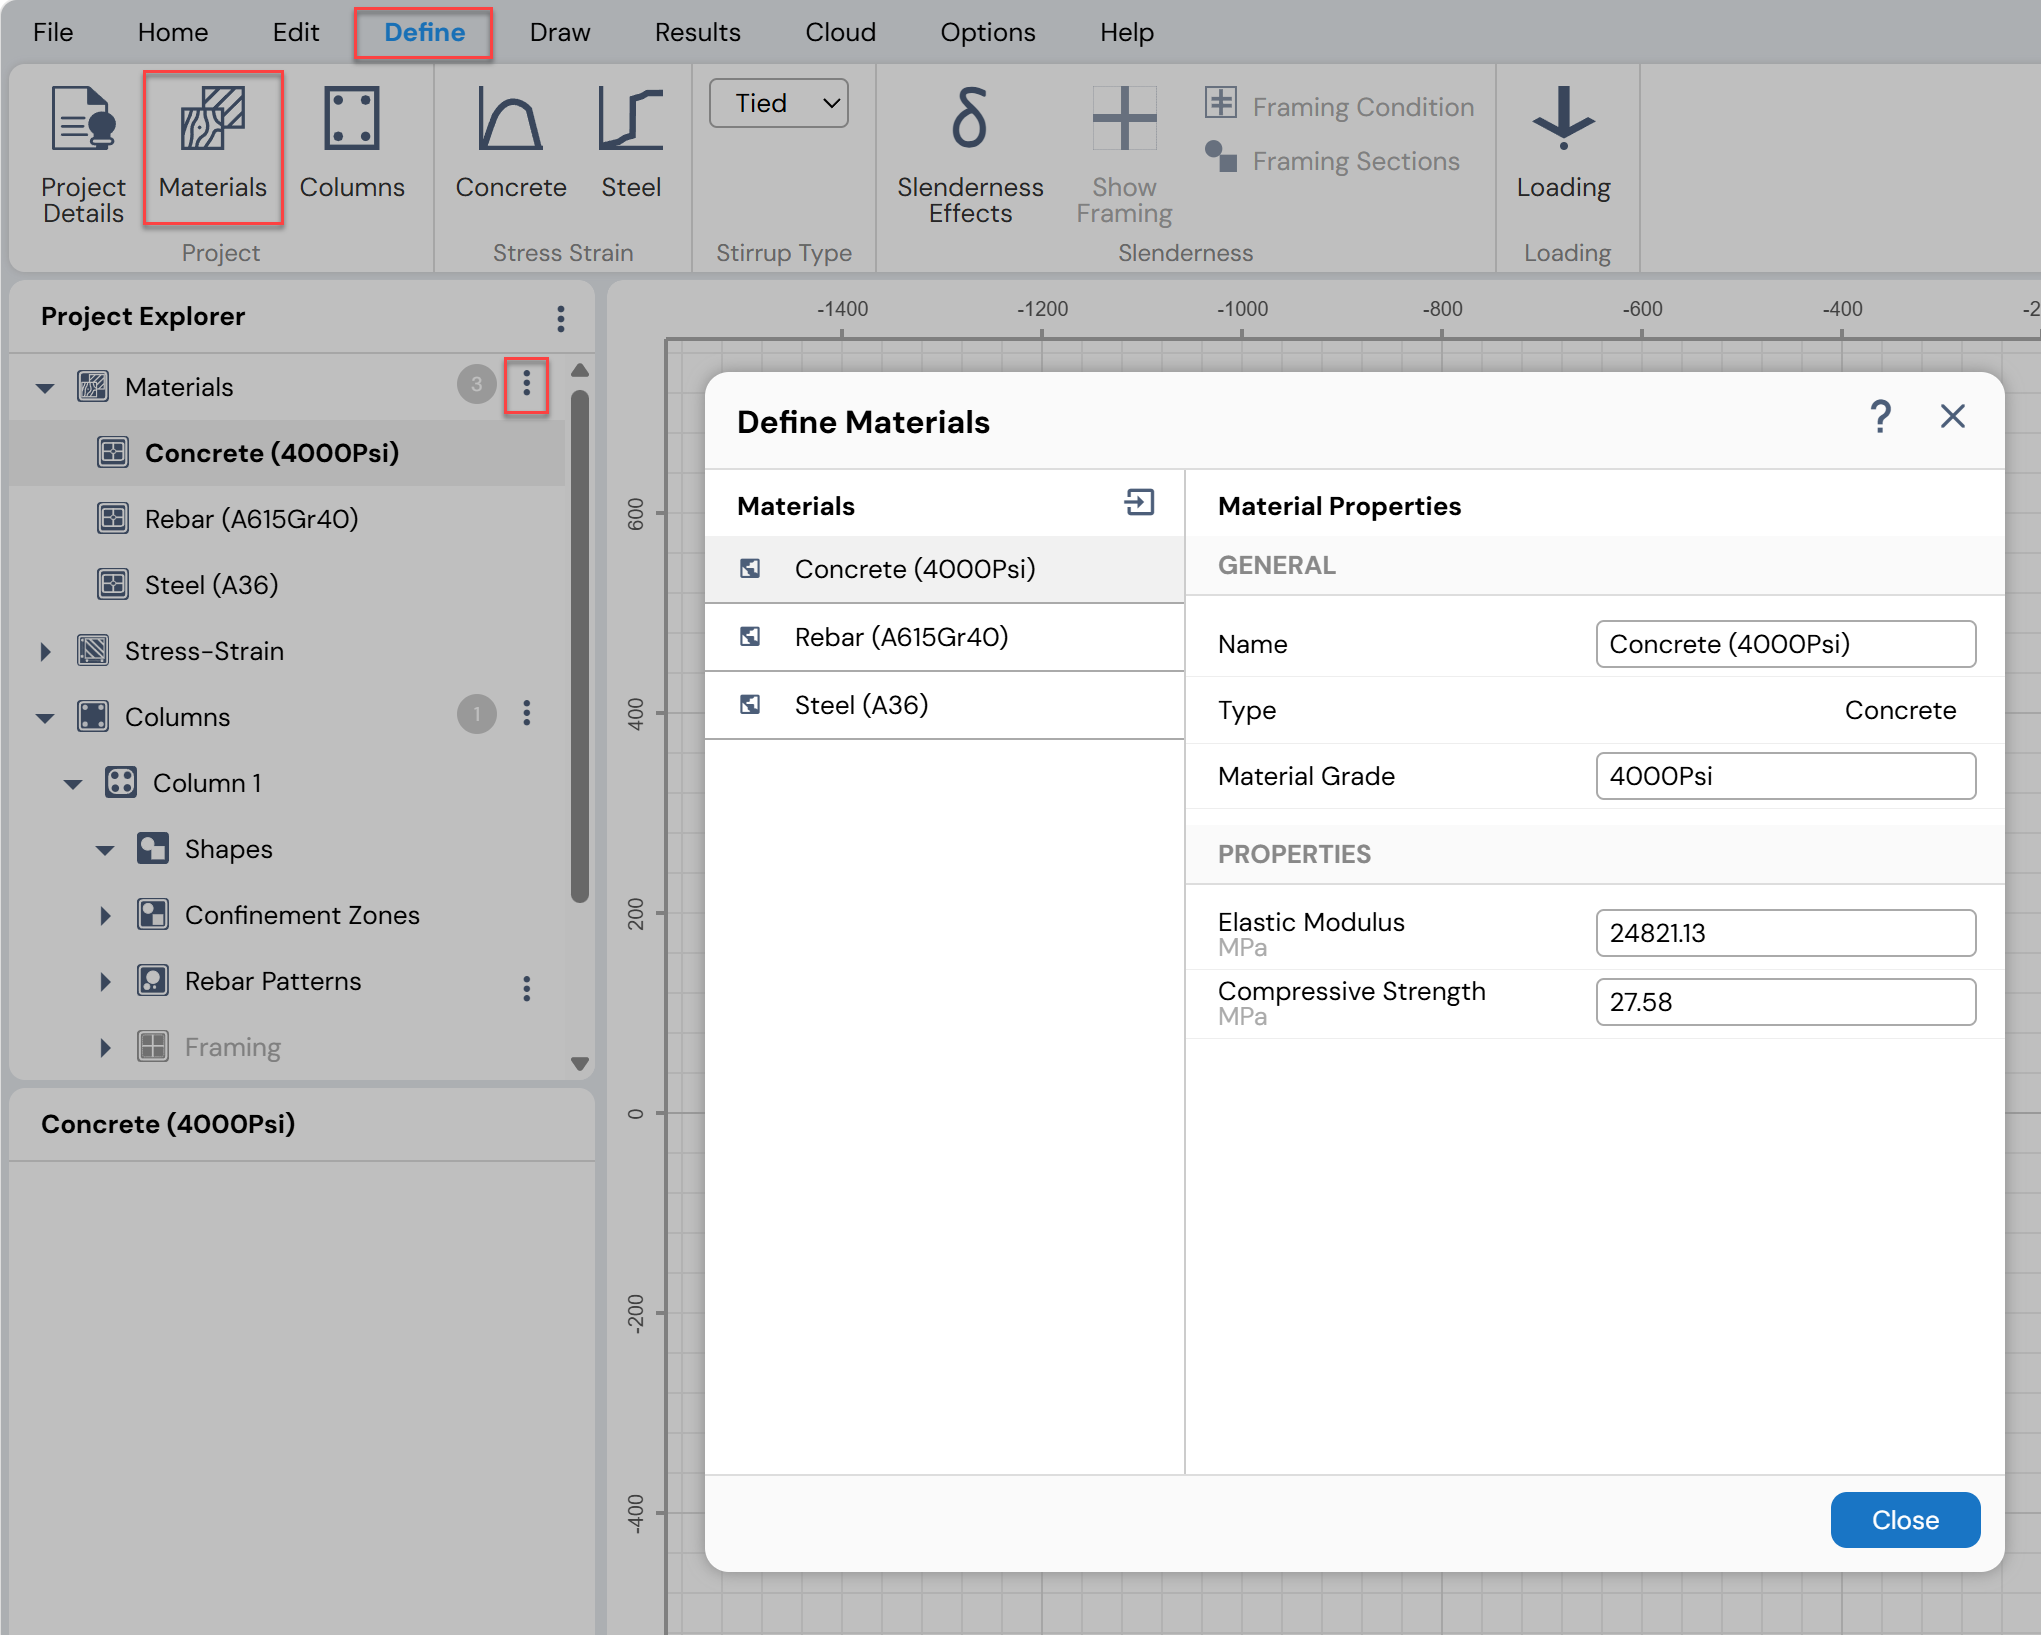
Figure: Material Properties Option in Define Menu and Project Explorer
Column Name
The column name can be defined or modified from:Define Menu → Project → Columns, or
The button next to Project Explorer → Columns
Section Shape
Select the stirrup type (Tied or Spiral) and section shape type (Rectangular or Circular) to open the corresponding form.
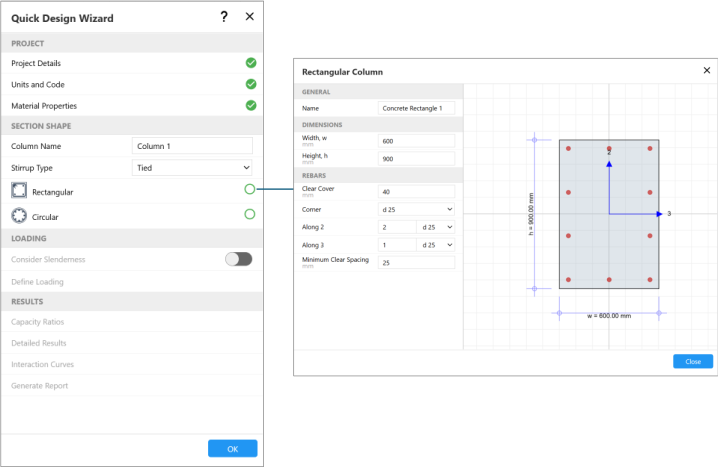
Figure: Section Shape Option in Quick Design Wizard Form
Define:
Shape name
Cross-section dimensions
Clear cover
Rebar size
Rebar distribution
Shapes and reinforcement can be modified later by selecting them and editing their properties in the Property Grid.
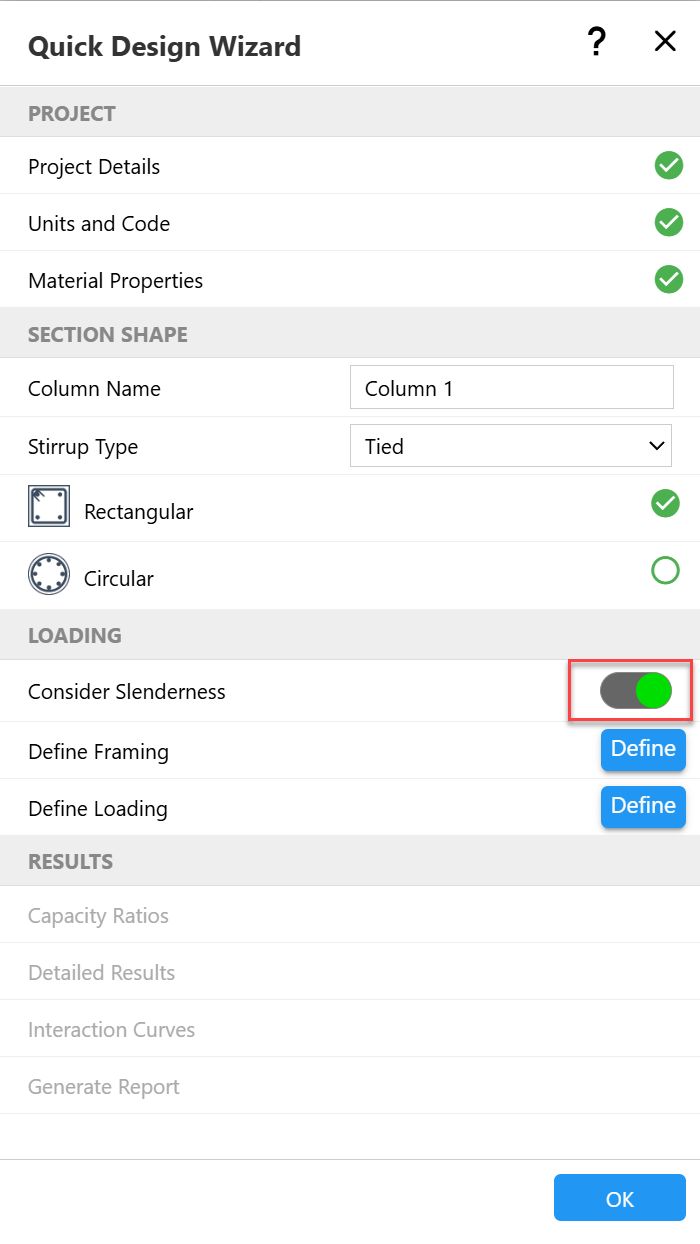
Consider Slenderness Toggle
When this toggle is turned on, Column Designer considers slenderness effects and column framing must be defined using the Define Framing button.
When this toggle is turned off, slenderness effects are ignored, the Define Framing button is disabled, and the user may proceed directly to Step 9.
Figure: Slenderness Option in Quick Design Wizard Form
- Define Framing
This option is available only when slenderness effects are considered.
Clicking Define Framing opens the Column Framing Conditions form.
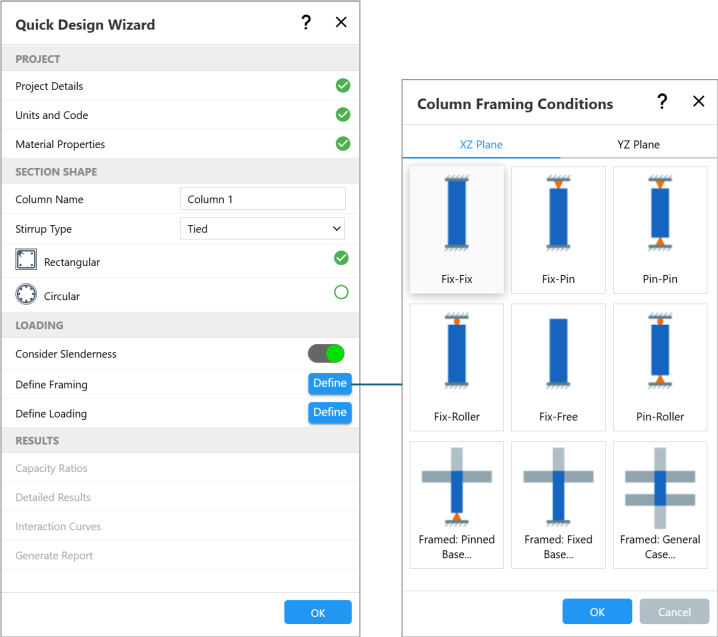
Figure: Framing Option in Quick Design Wizard Form
This form can also be accessed later from:
Define Menu → Slenderness → Framing Conditions, or
The button next to Project Explorer → Columns → Framing → Conditions
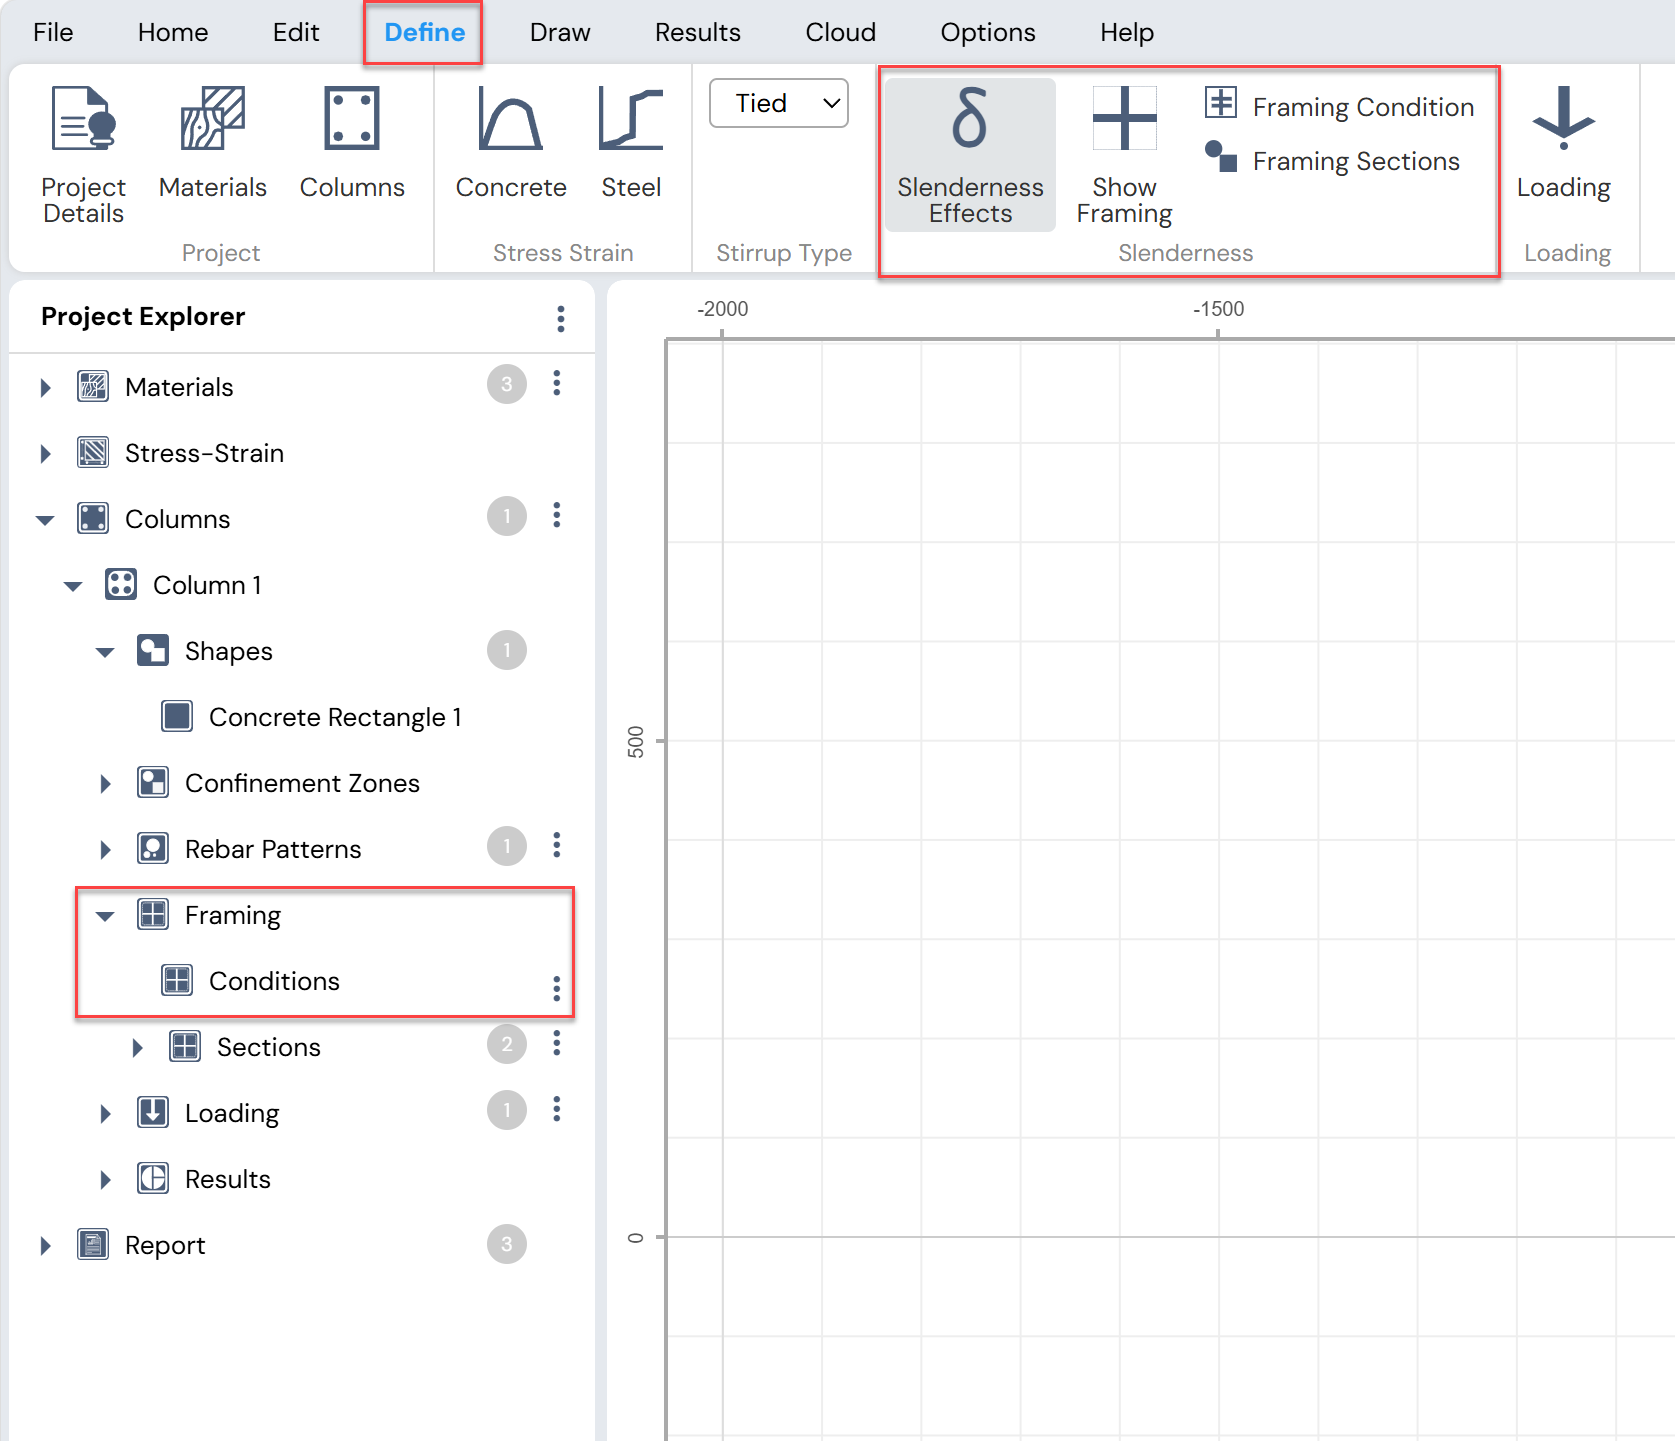
Figure: Slenderness Option in Define Menu and Project Explorer
Define Loading
Either Detailed Loading or Simple Loading can be defined.If the Consider Slenderness toggle is on, the Detailed Loading form is displayed automatically.
If the toggle is off, the Simple Loading form is displayed automatically.
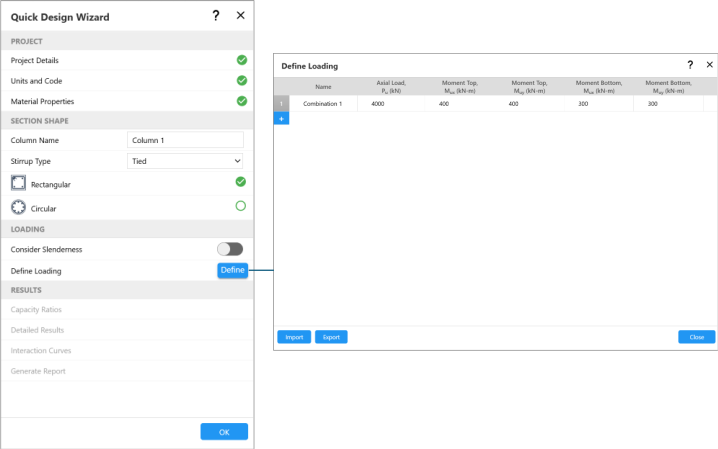
Figure: Load Definition in Quick Design Wizard Form
The loading definition form can also be accessed later from:
Define Menu → Loading → Loading, or
The button next to Project Explorer → Columns → Loading
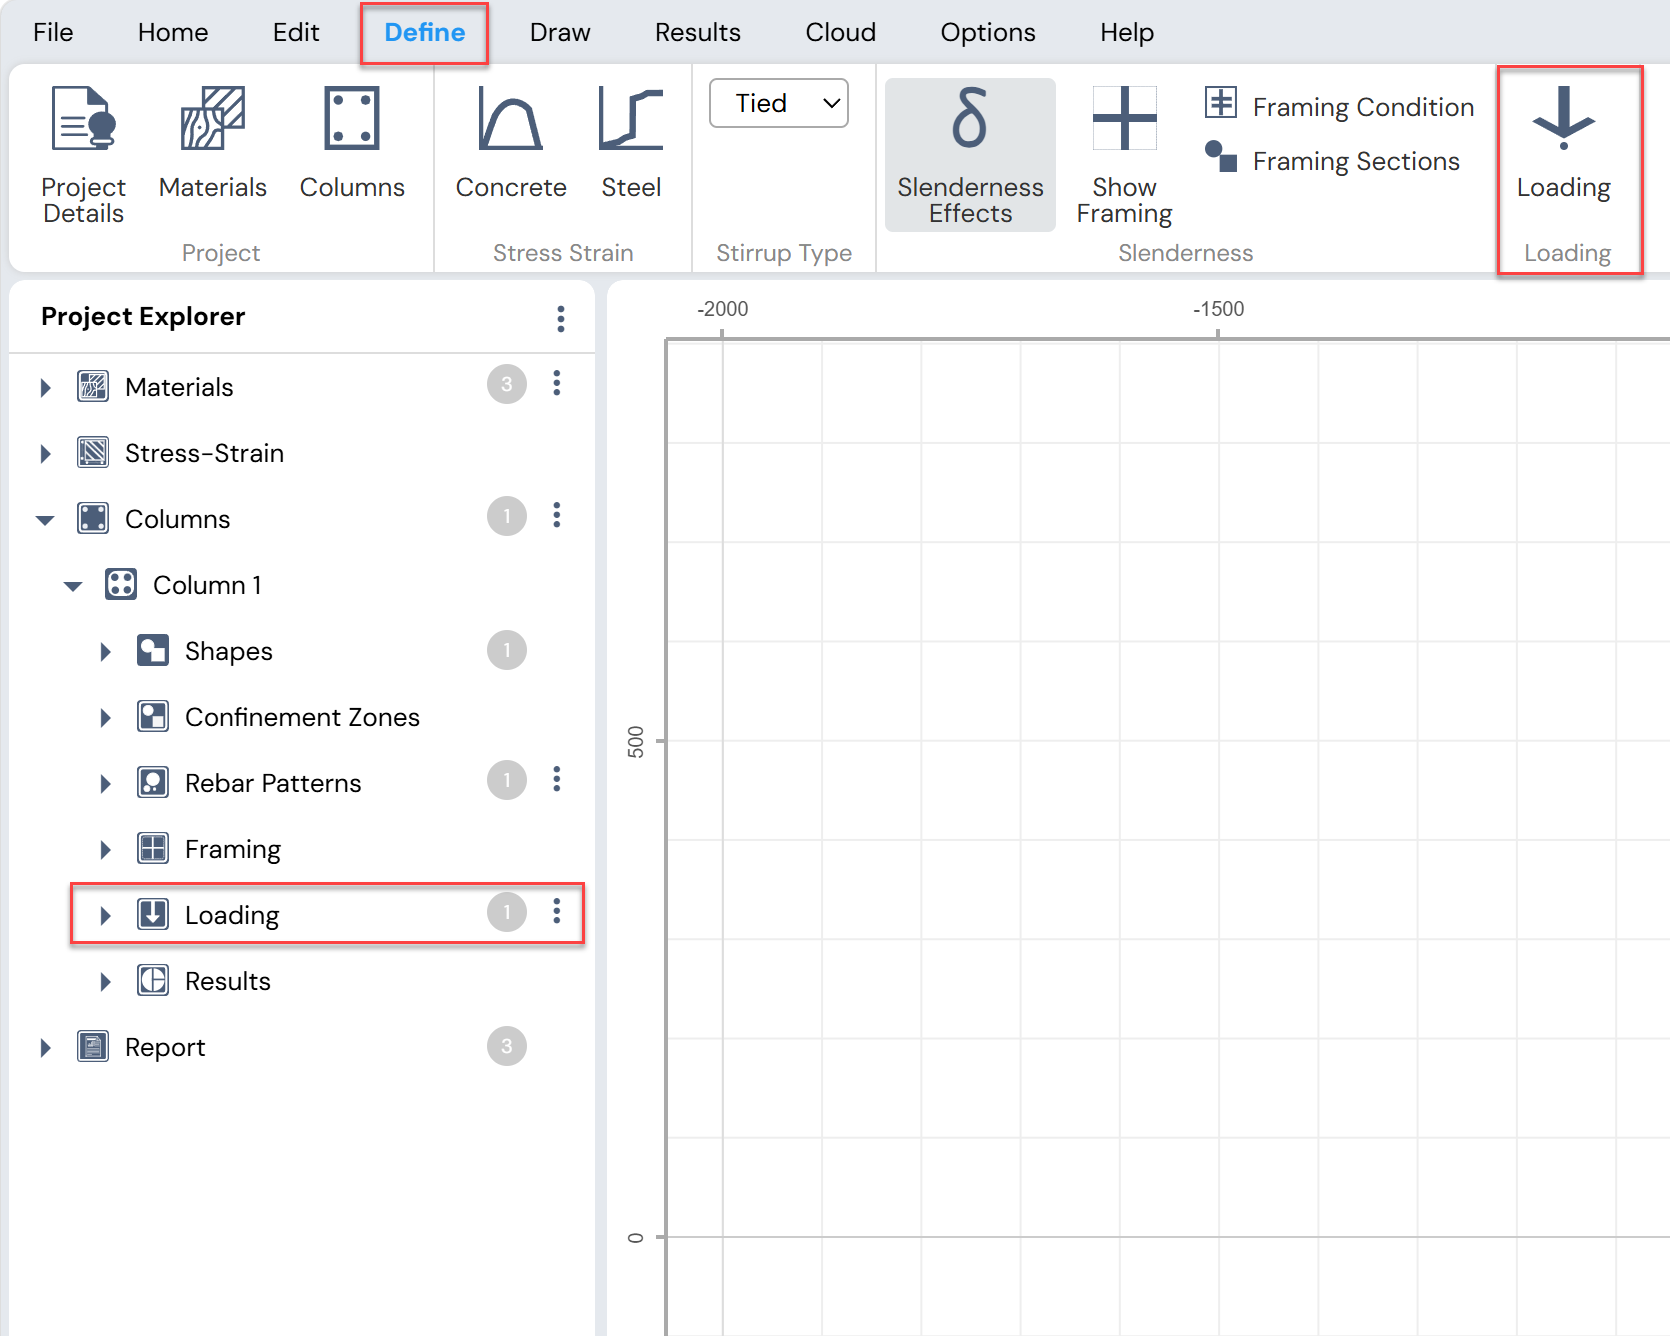
Figure: Load Definition in Define Menu and Project Explorer
- Results
Once the column section, loading, and framing conditions have been defined, results can be viewed using the options available under the Results section of the wizard.
Available result options include:
Capacity Ratio – Determines whether the column section is adequate for the defined loading
Detailed Results – Displays detailed analysis and design results
Interaction Diagrams – Displays PMM interaction diagrams
Generate Report – Creates a one-page report for the defined column
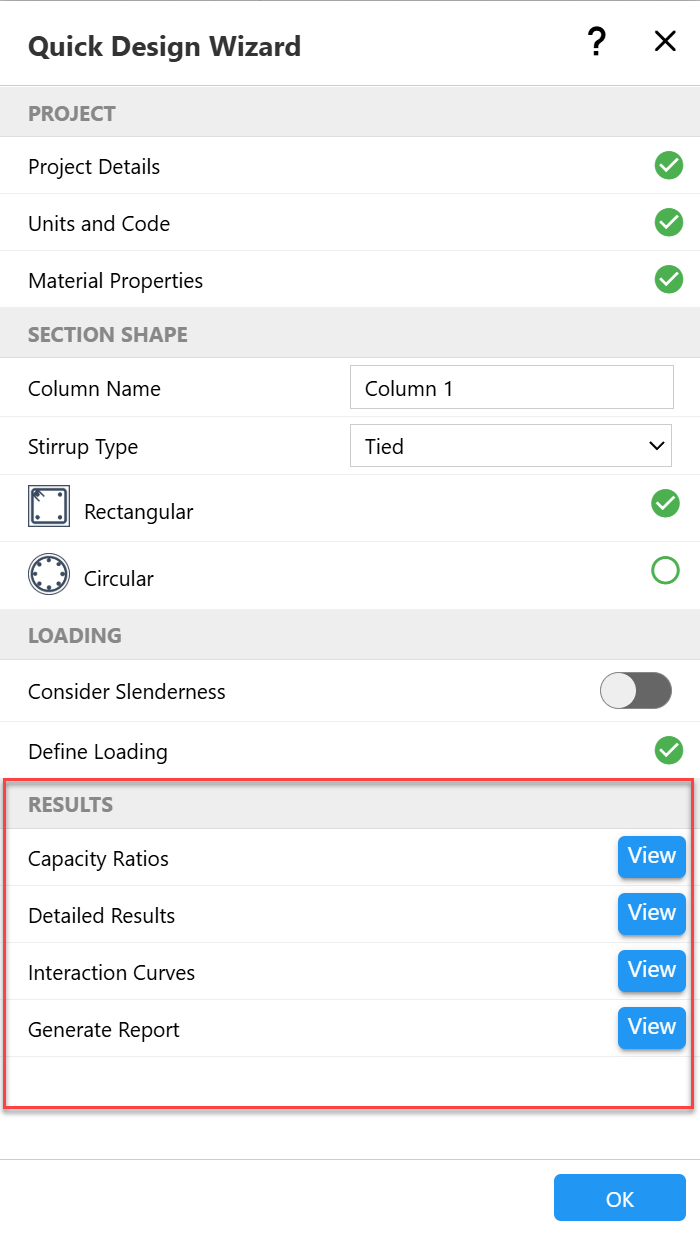
Figure: Result View in Quick Design Wizard Form
After closing the wizard:
All results can be accessed from the Results Menu or Project Explorer → Results
Reports can be viewed from Project Explorer → Report
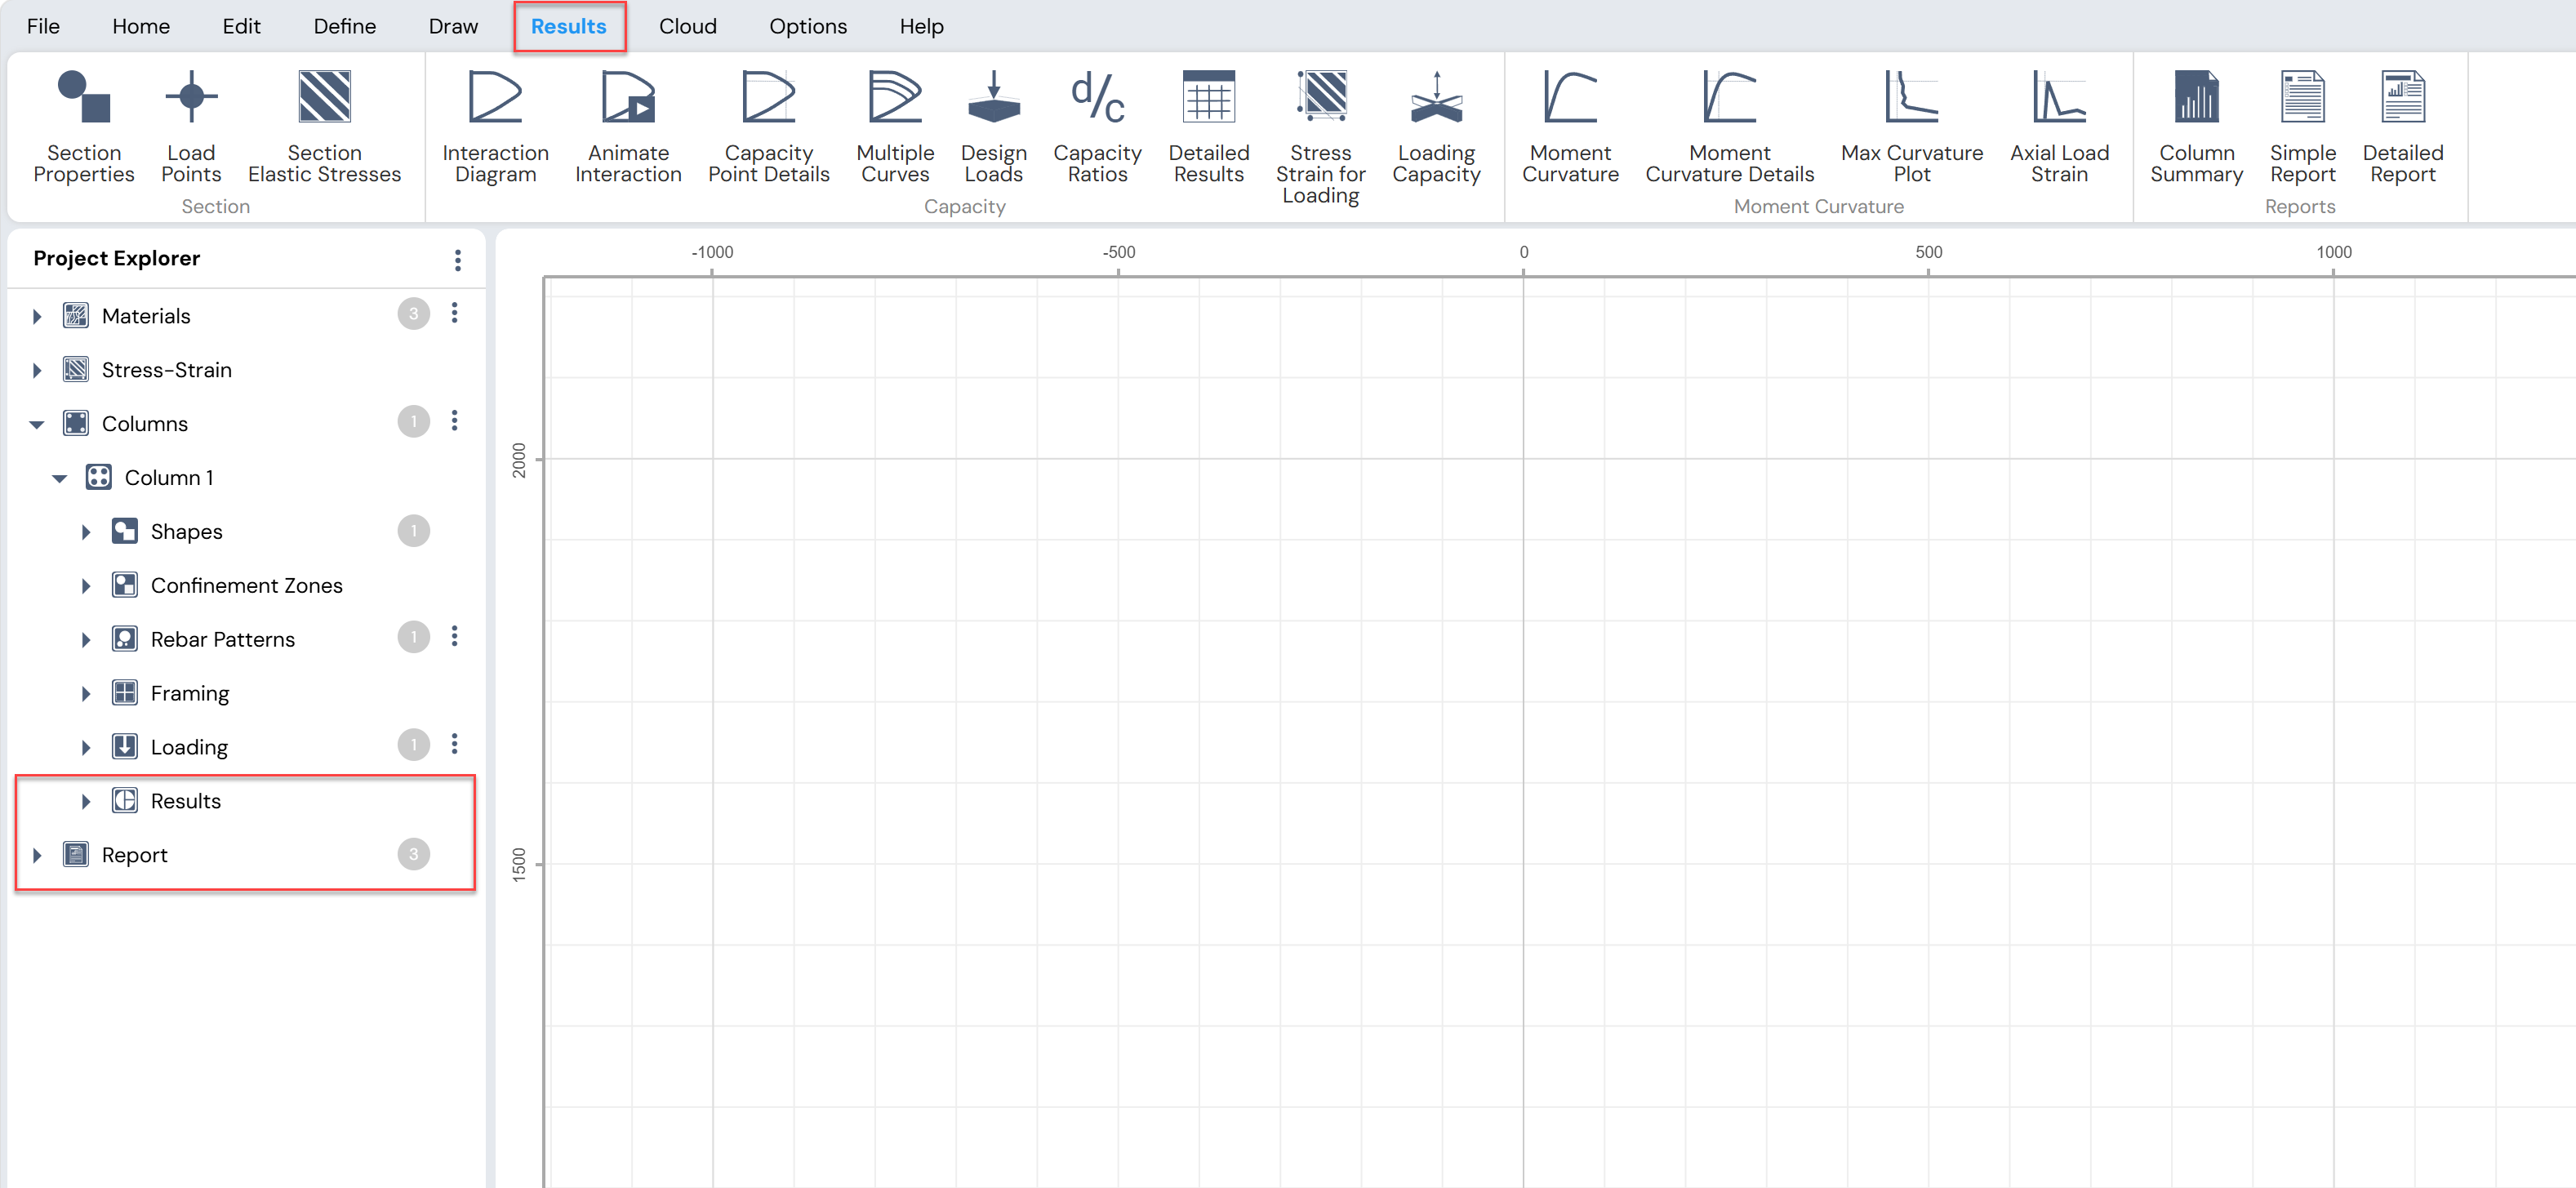
Figure: Result View and Report Generation in Results Menu and Project Explorer
Blank Model
When the Blank Model button is used, Column Designer adds a blank working area to the current Project File.
This method provides maximum flexibility and allows the user to create a column section of any shape.
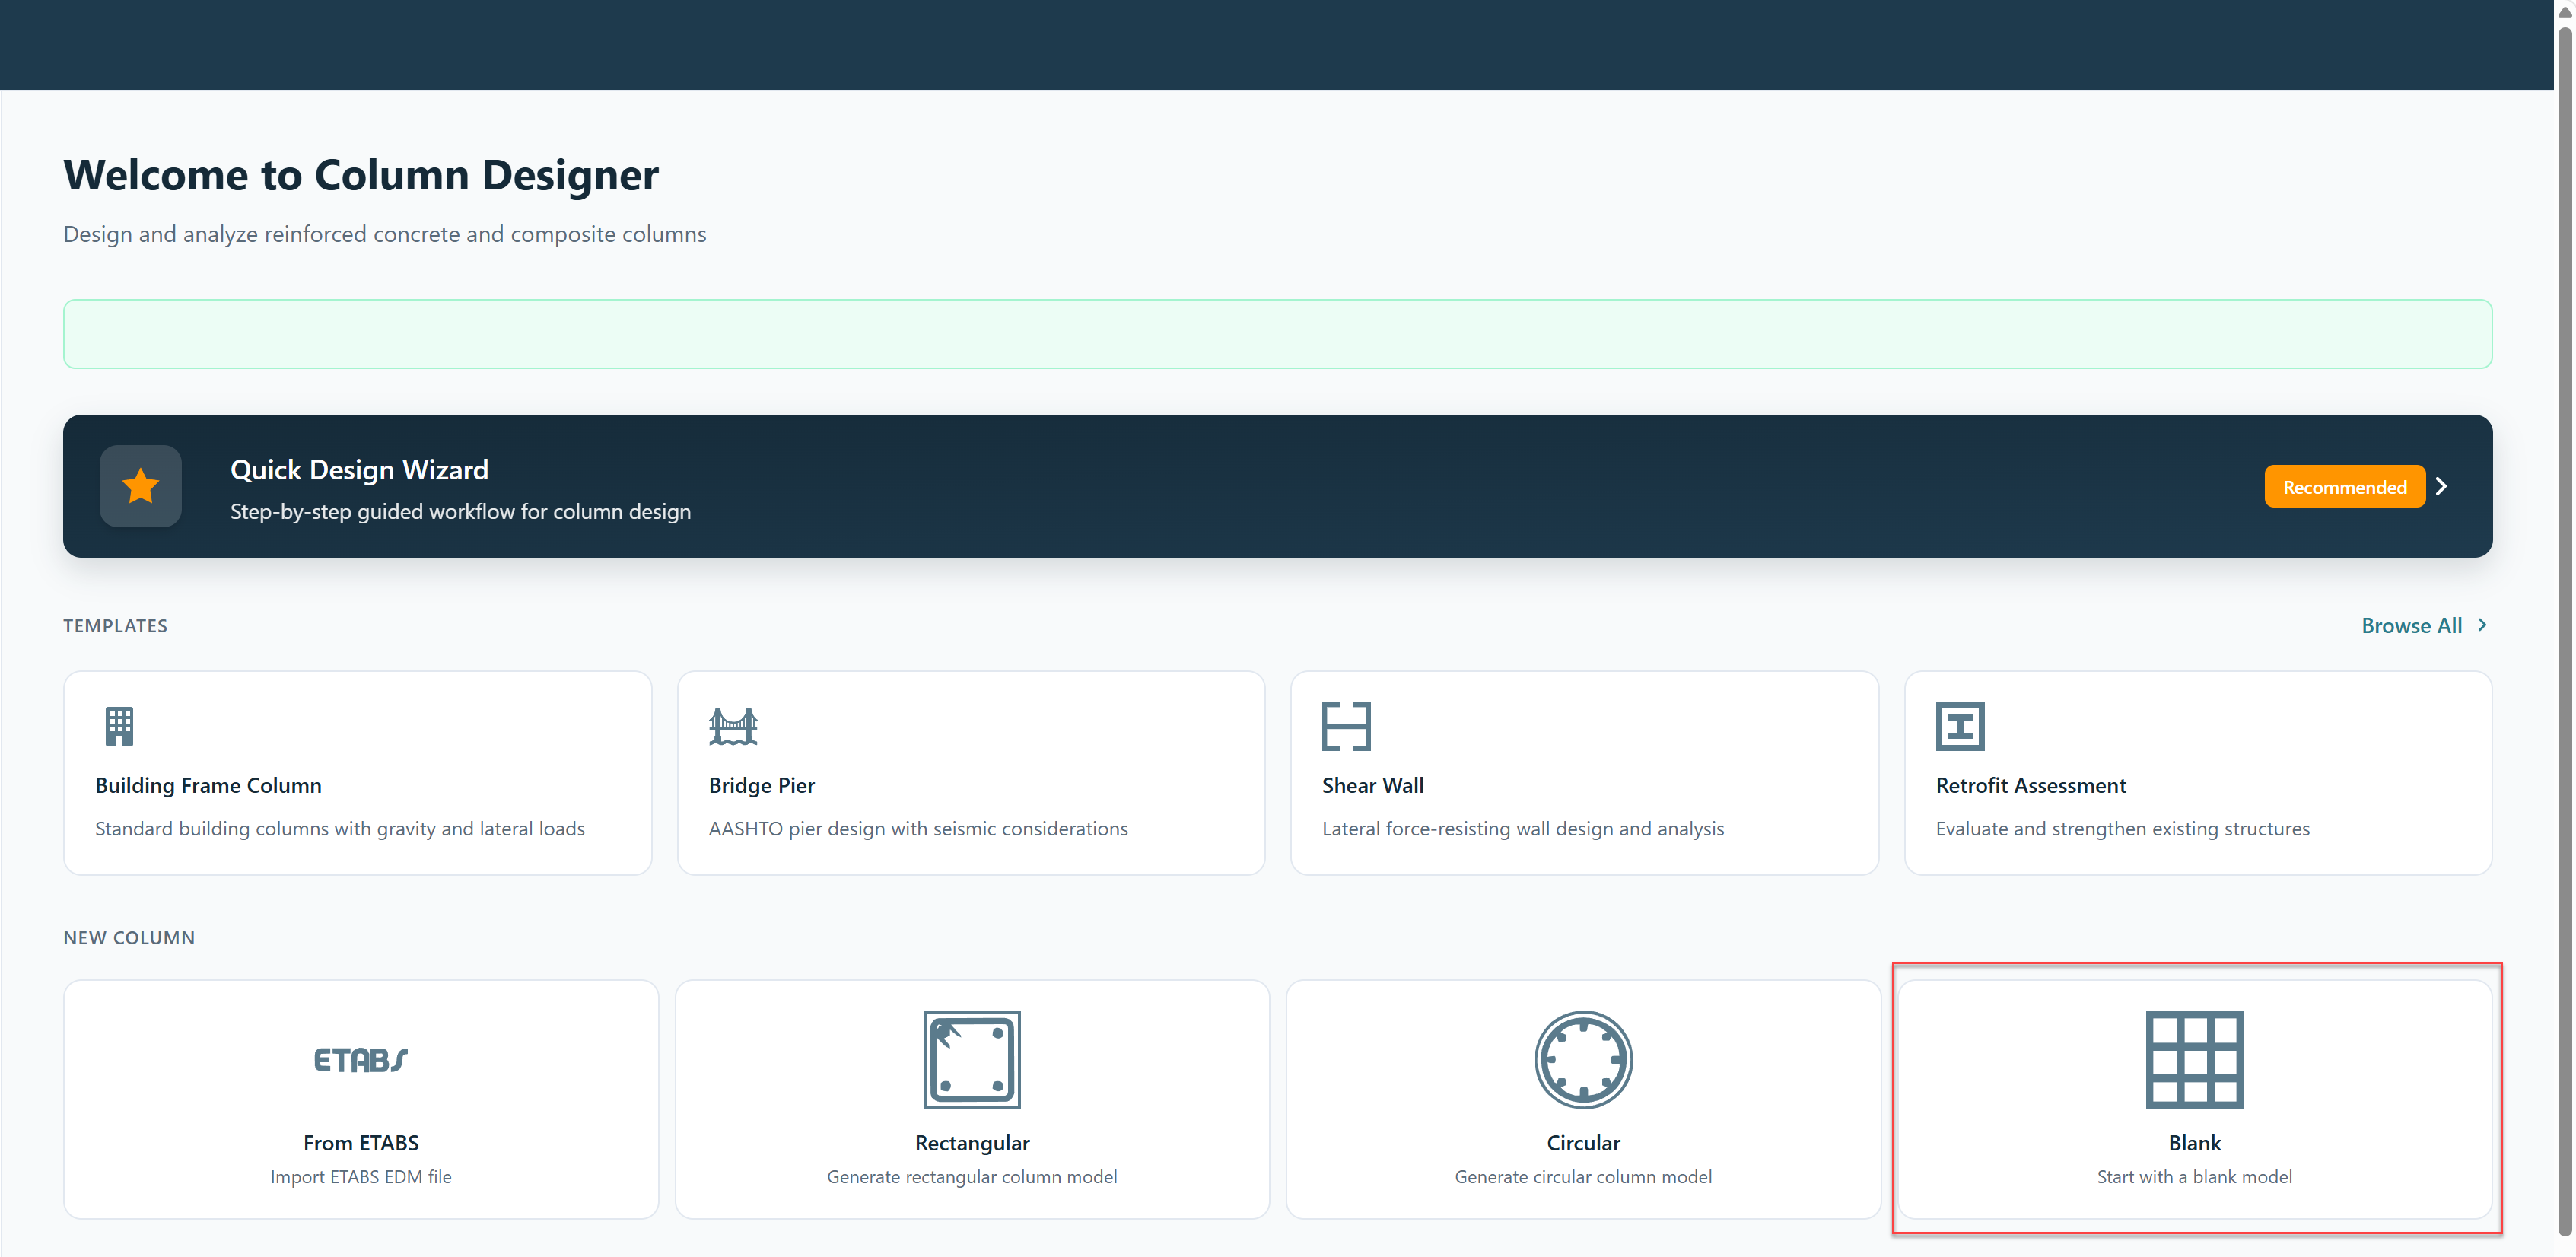
Figure: Blank Model Option in Column Designer
The basic procedure for creating a section using File Menu → Blank Model is described below.
Procedure for Creating a Column Using Blank Model
- Create a Blank Model
Select Blank Model to add a blank working area to the current Project File.
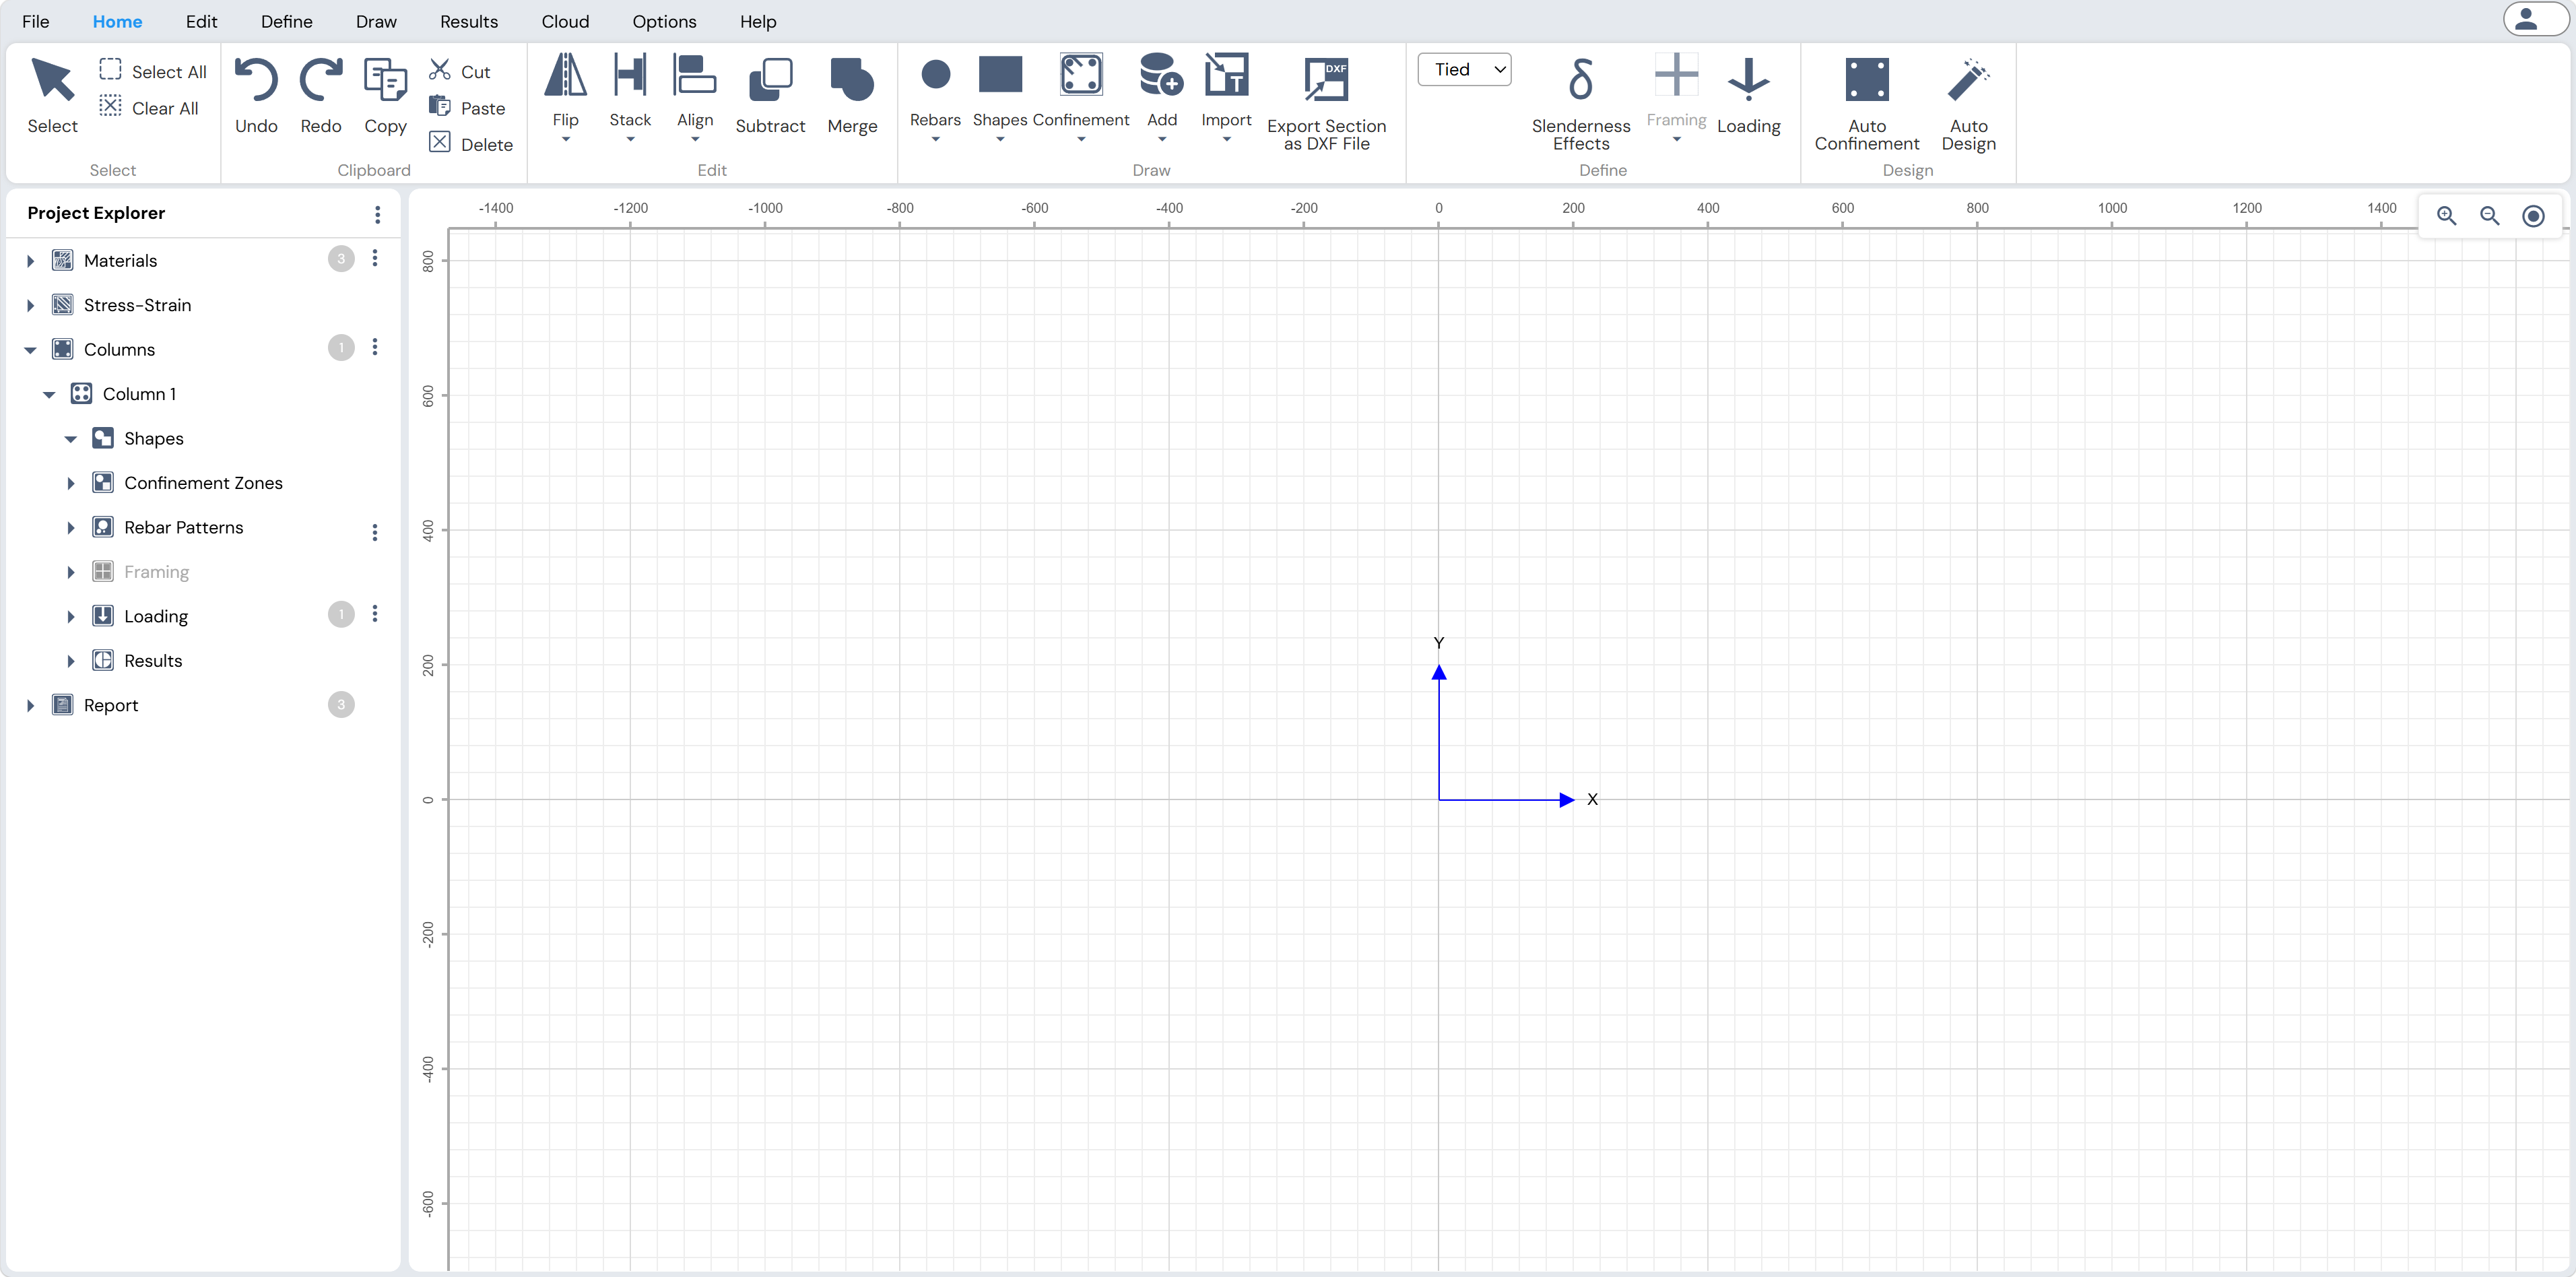
Figure: Blank Working Area in Column Designer
Set Units and Design Code
By default, Column Designer opens using the last selected working units and design code.
If required, modify these settings using:- Options Menu → General
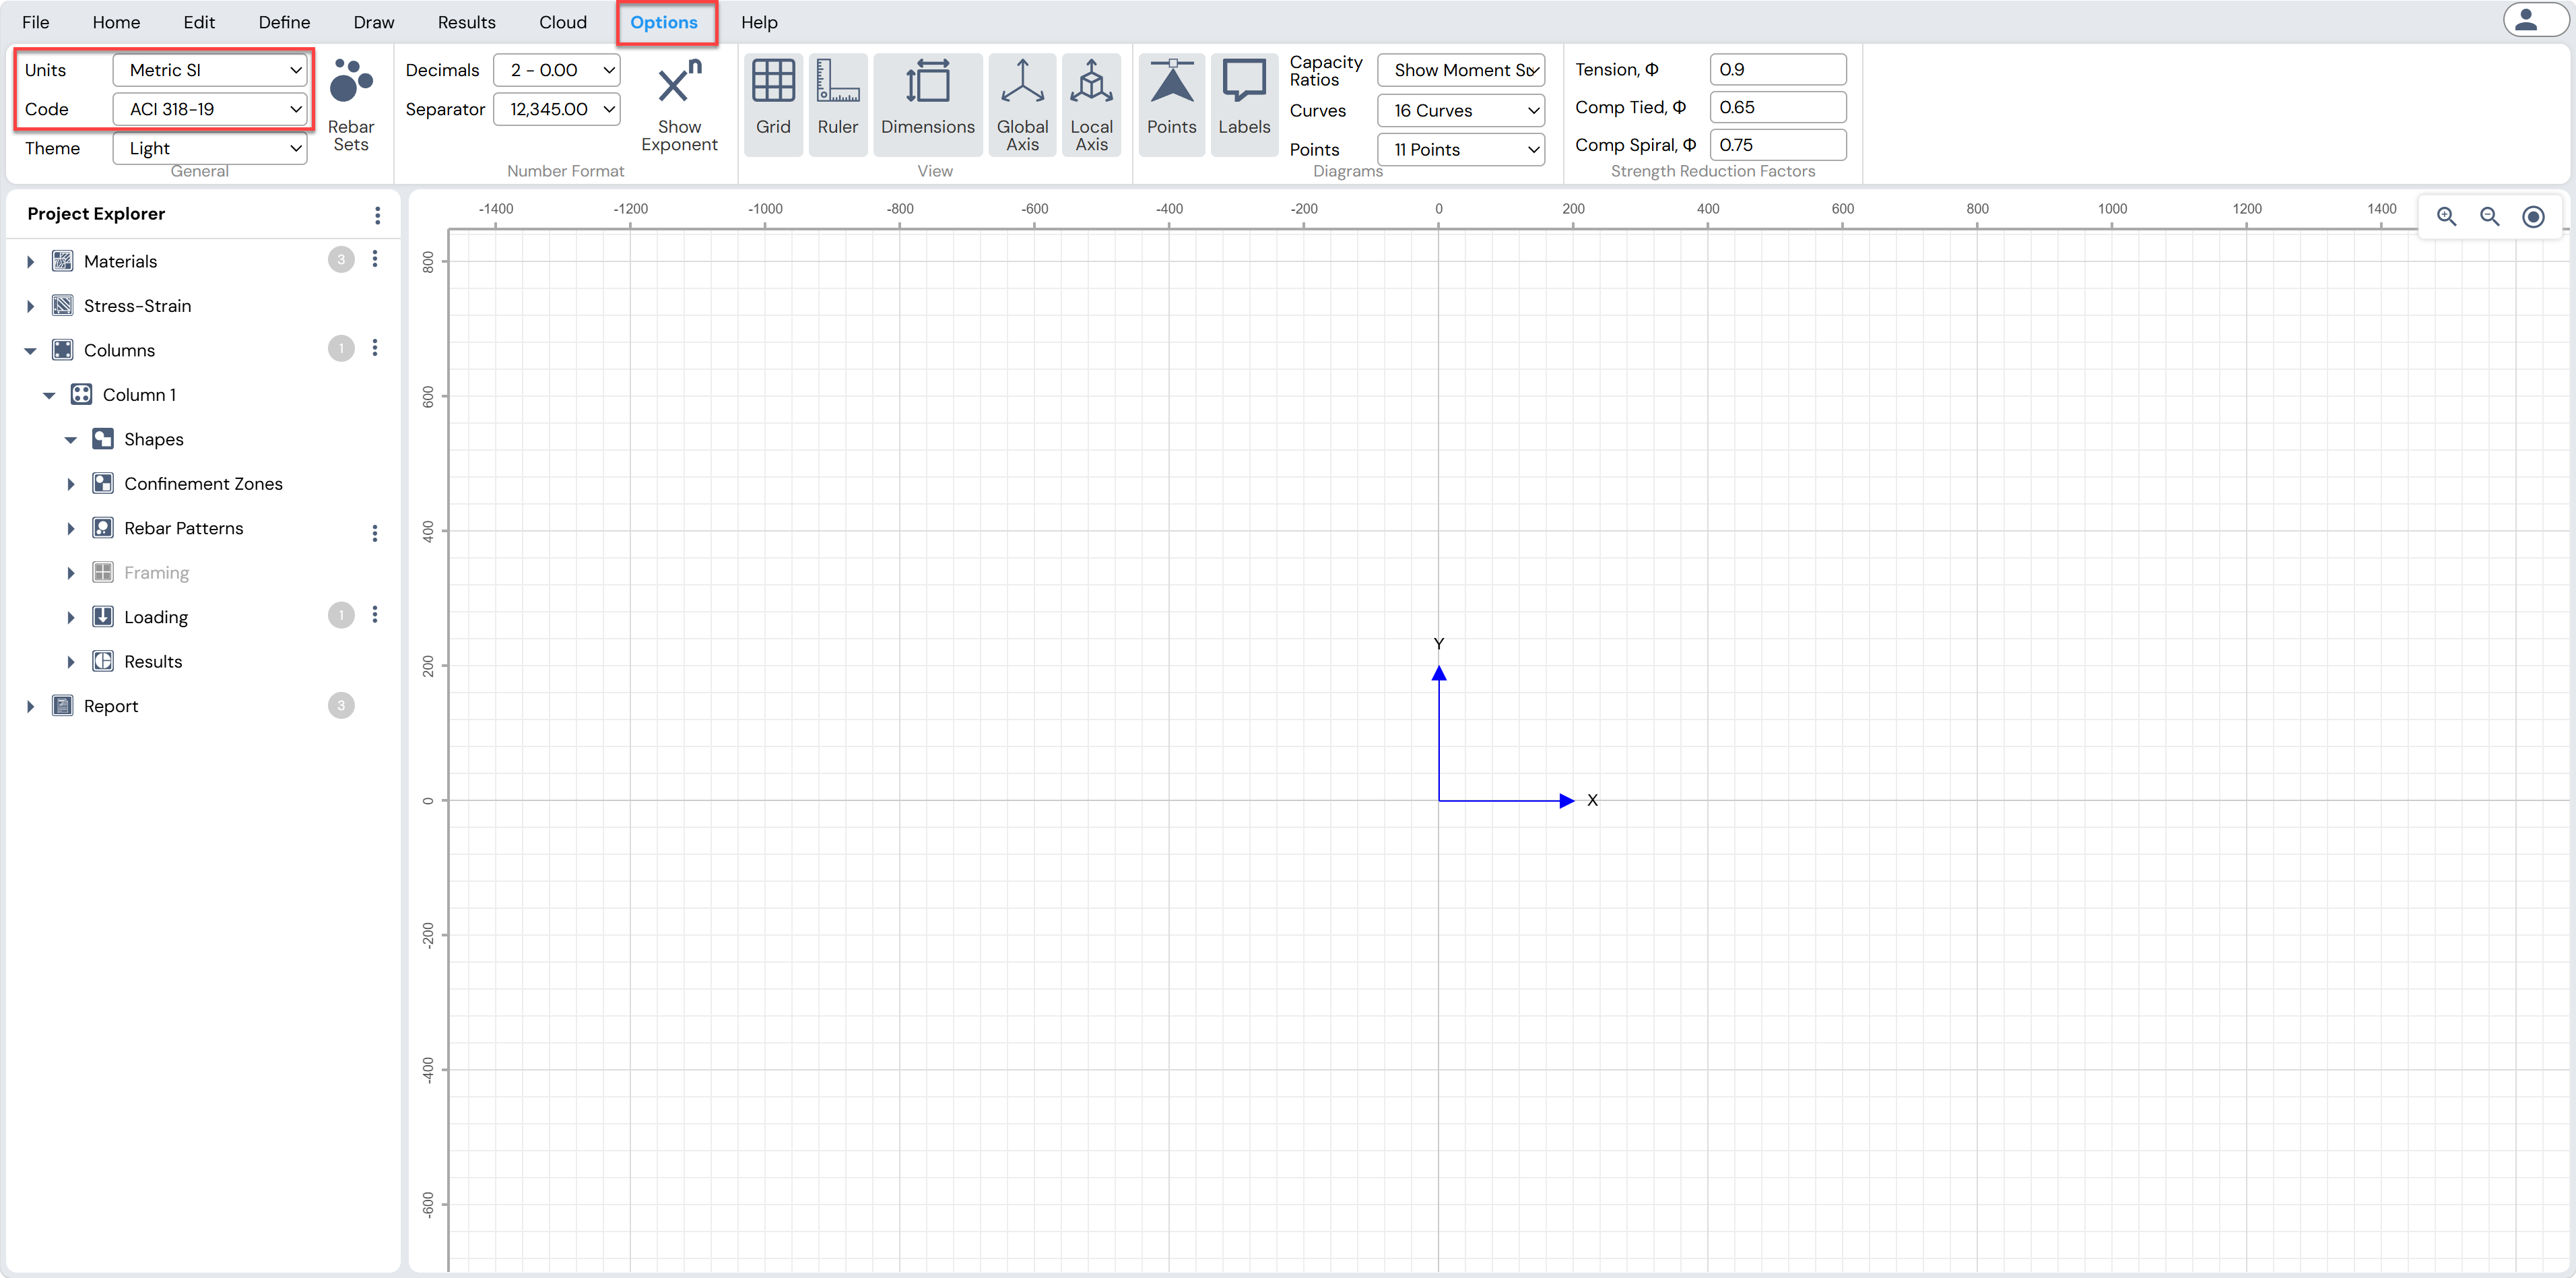
Figure: Setting Units and Design Code in Column Designer
Define Concrete Stress–Strain Model
Use:Define Menu → Stress Strain → Concrete, or
The button next to Project Explorer → Stress-Strain → Concrete
to access the Define Concrete Confinements form and define or modify concrete confinement models.
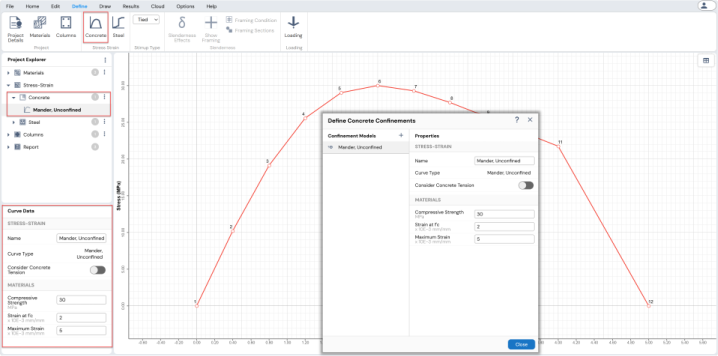
Figure: Defining Concrete Stress-Strain Model in Column Designer
Define Steel Stress–Strain Model
Use:Define Menu → Stress Strain → Steel, or
The button next to Project Explorer → Stress-Strain → Steel
to access the Define Steel Stress–Strain form and define or modify steel stress–strain models.
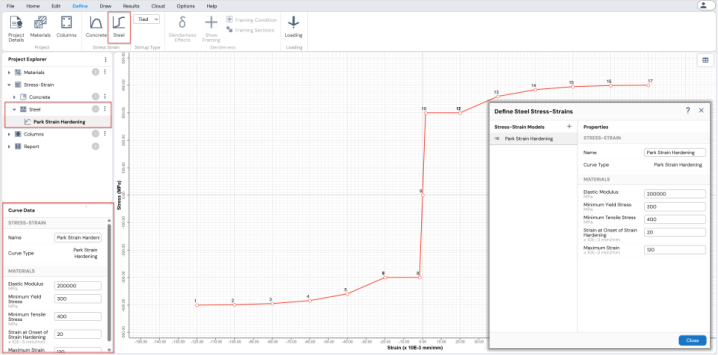
Figure: Defining Steel Stress-Strain Model in Column Designer
Define Material Properties
Use:Define Menu → Project → Materials, or
The button next to Project Explorer → Materials
to access the Material Properties form and define concrete and reinforcement properties.
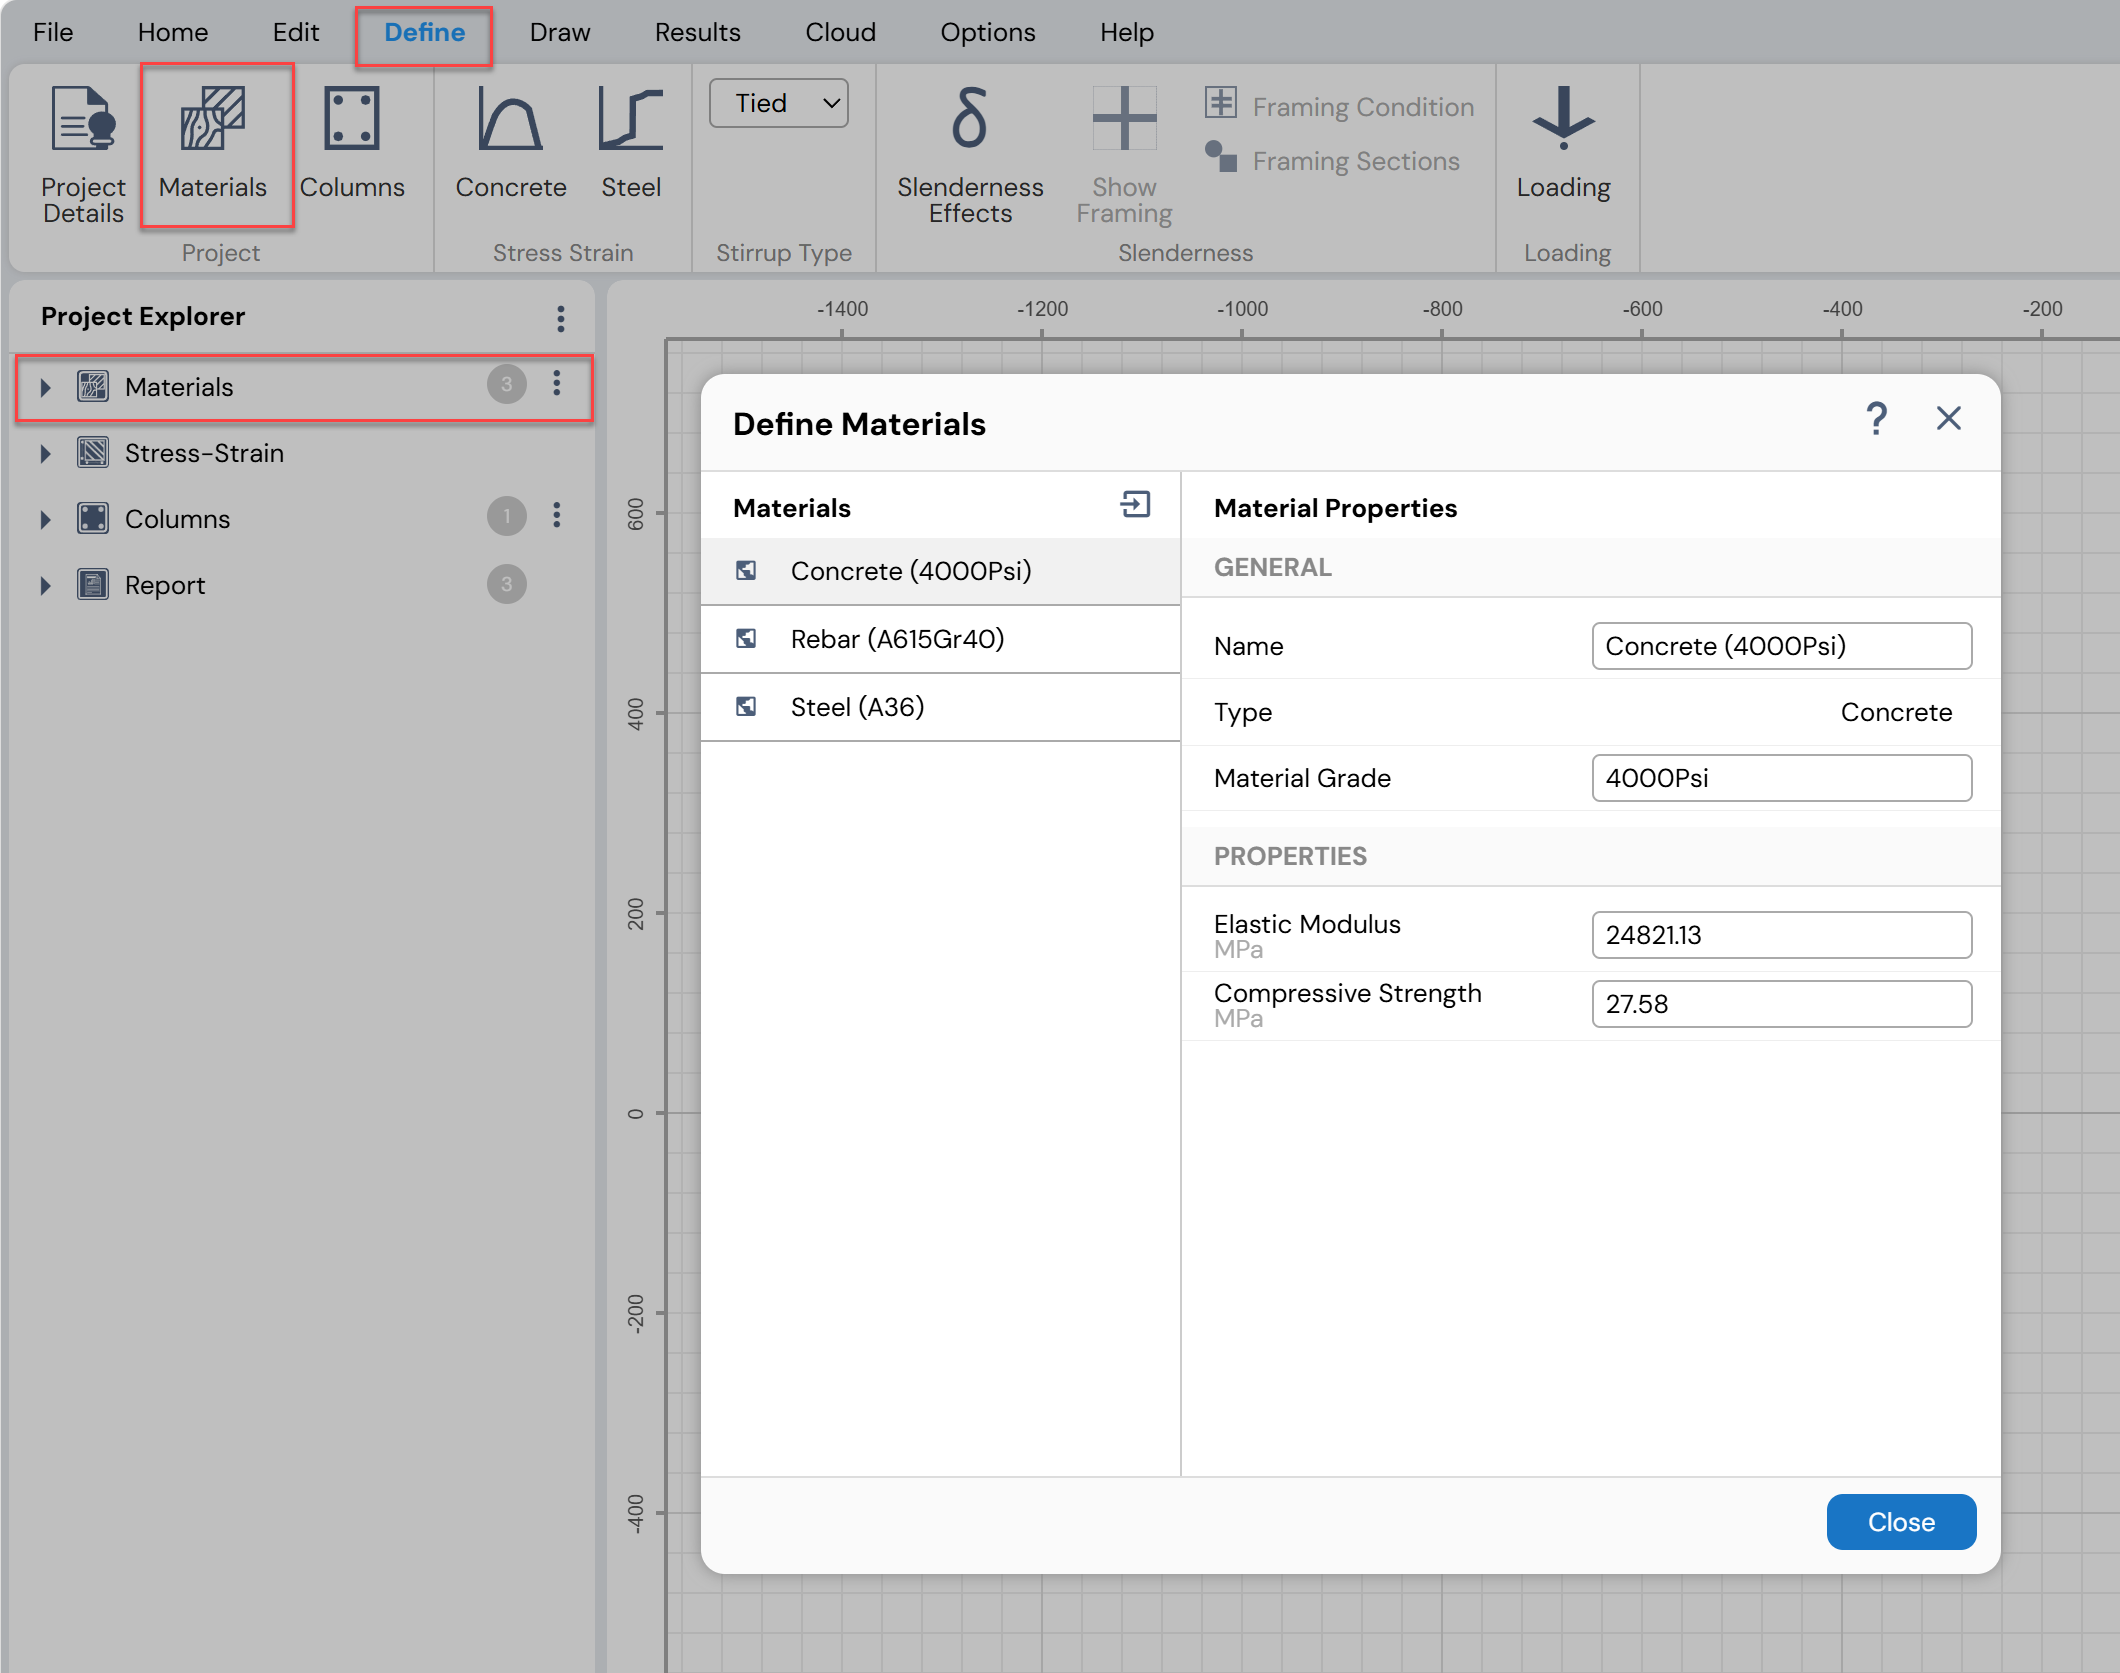
Figure: Defining Material Properties in Column Designer
- Add Shapes to the Section
Use one or more of the following tools to add shapes to the current column section:
a. Draw Menu → Concrete Shapes
Draw basic concrete shapes directly in the working area.
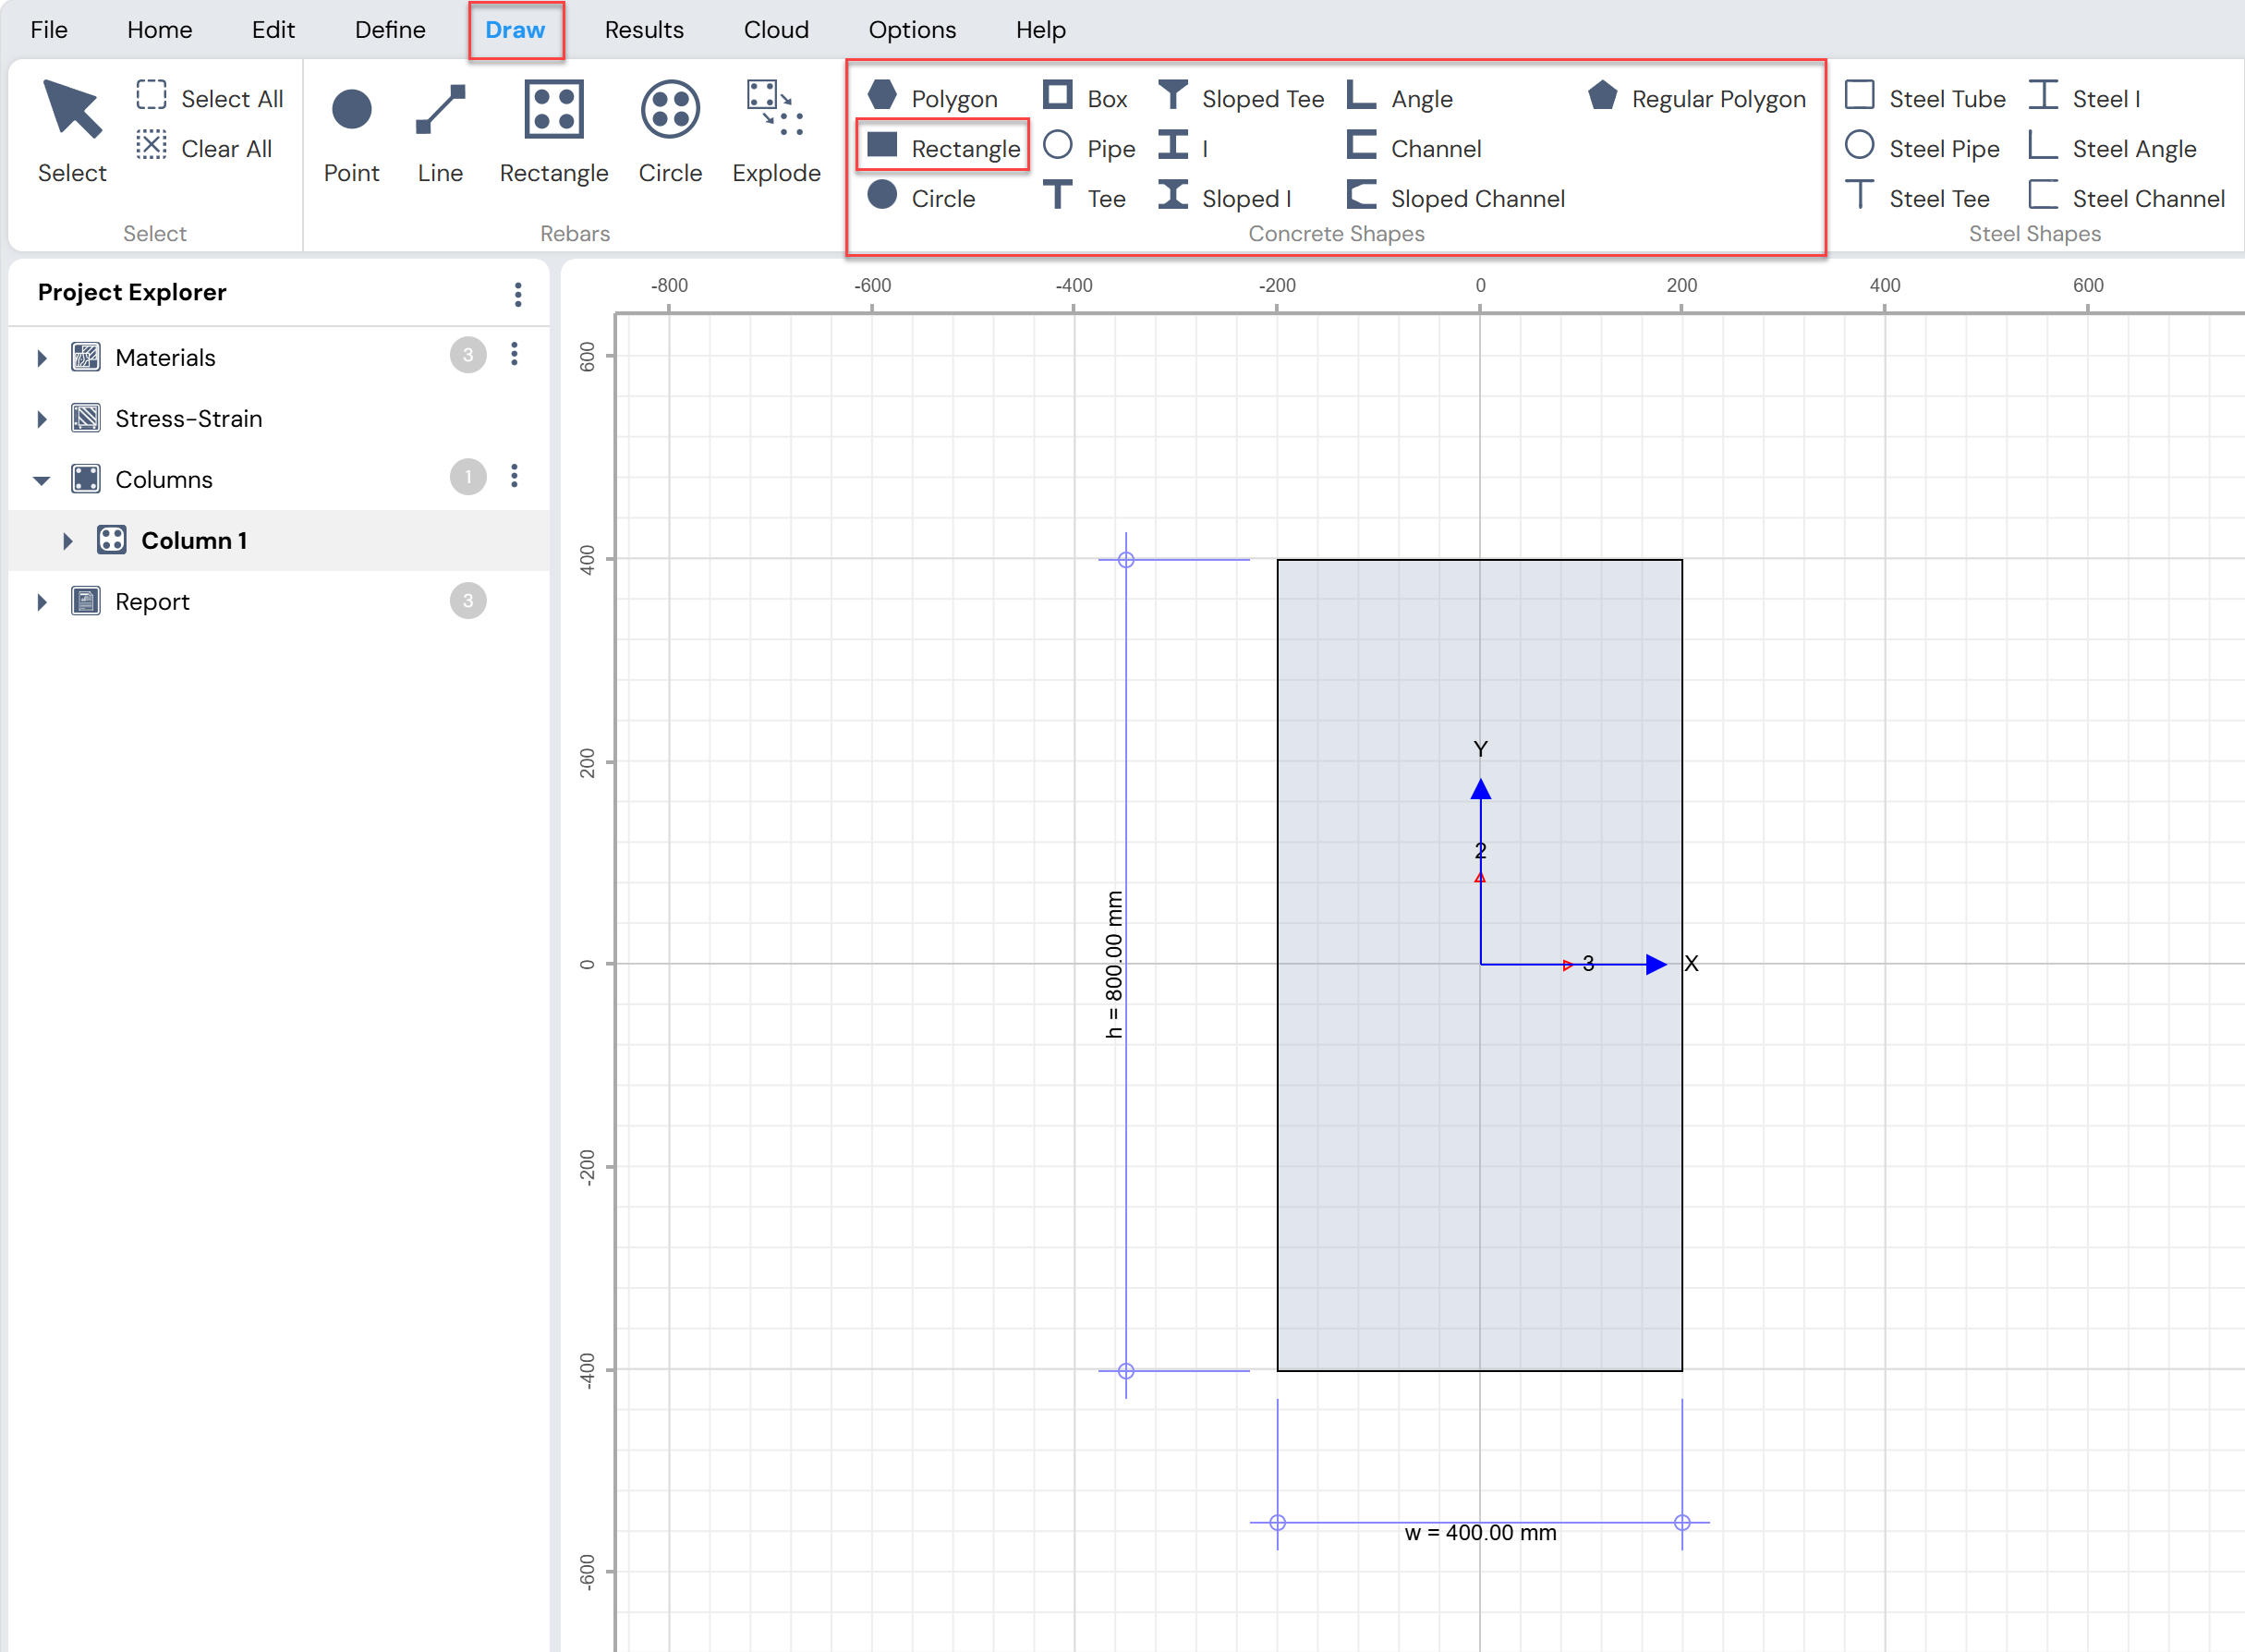
Figure: Drawing Concrete Shapes in Column Designer
b. Draw Menu → Steel Shapes
Draw basic steel shapes directly in the working area.
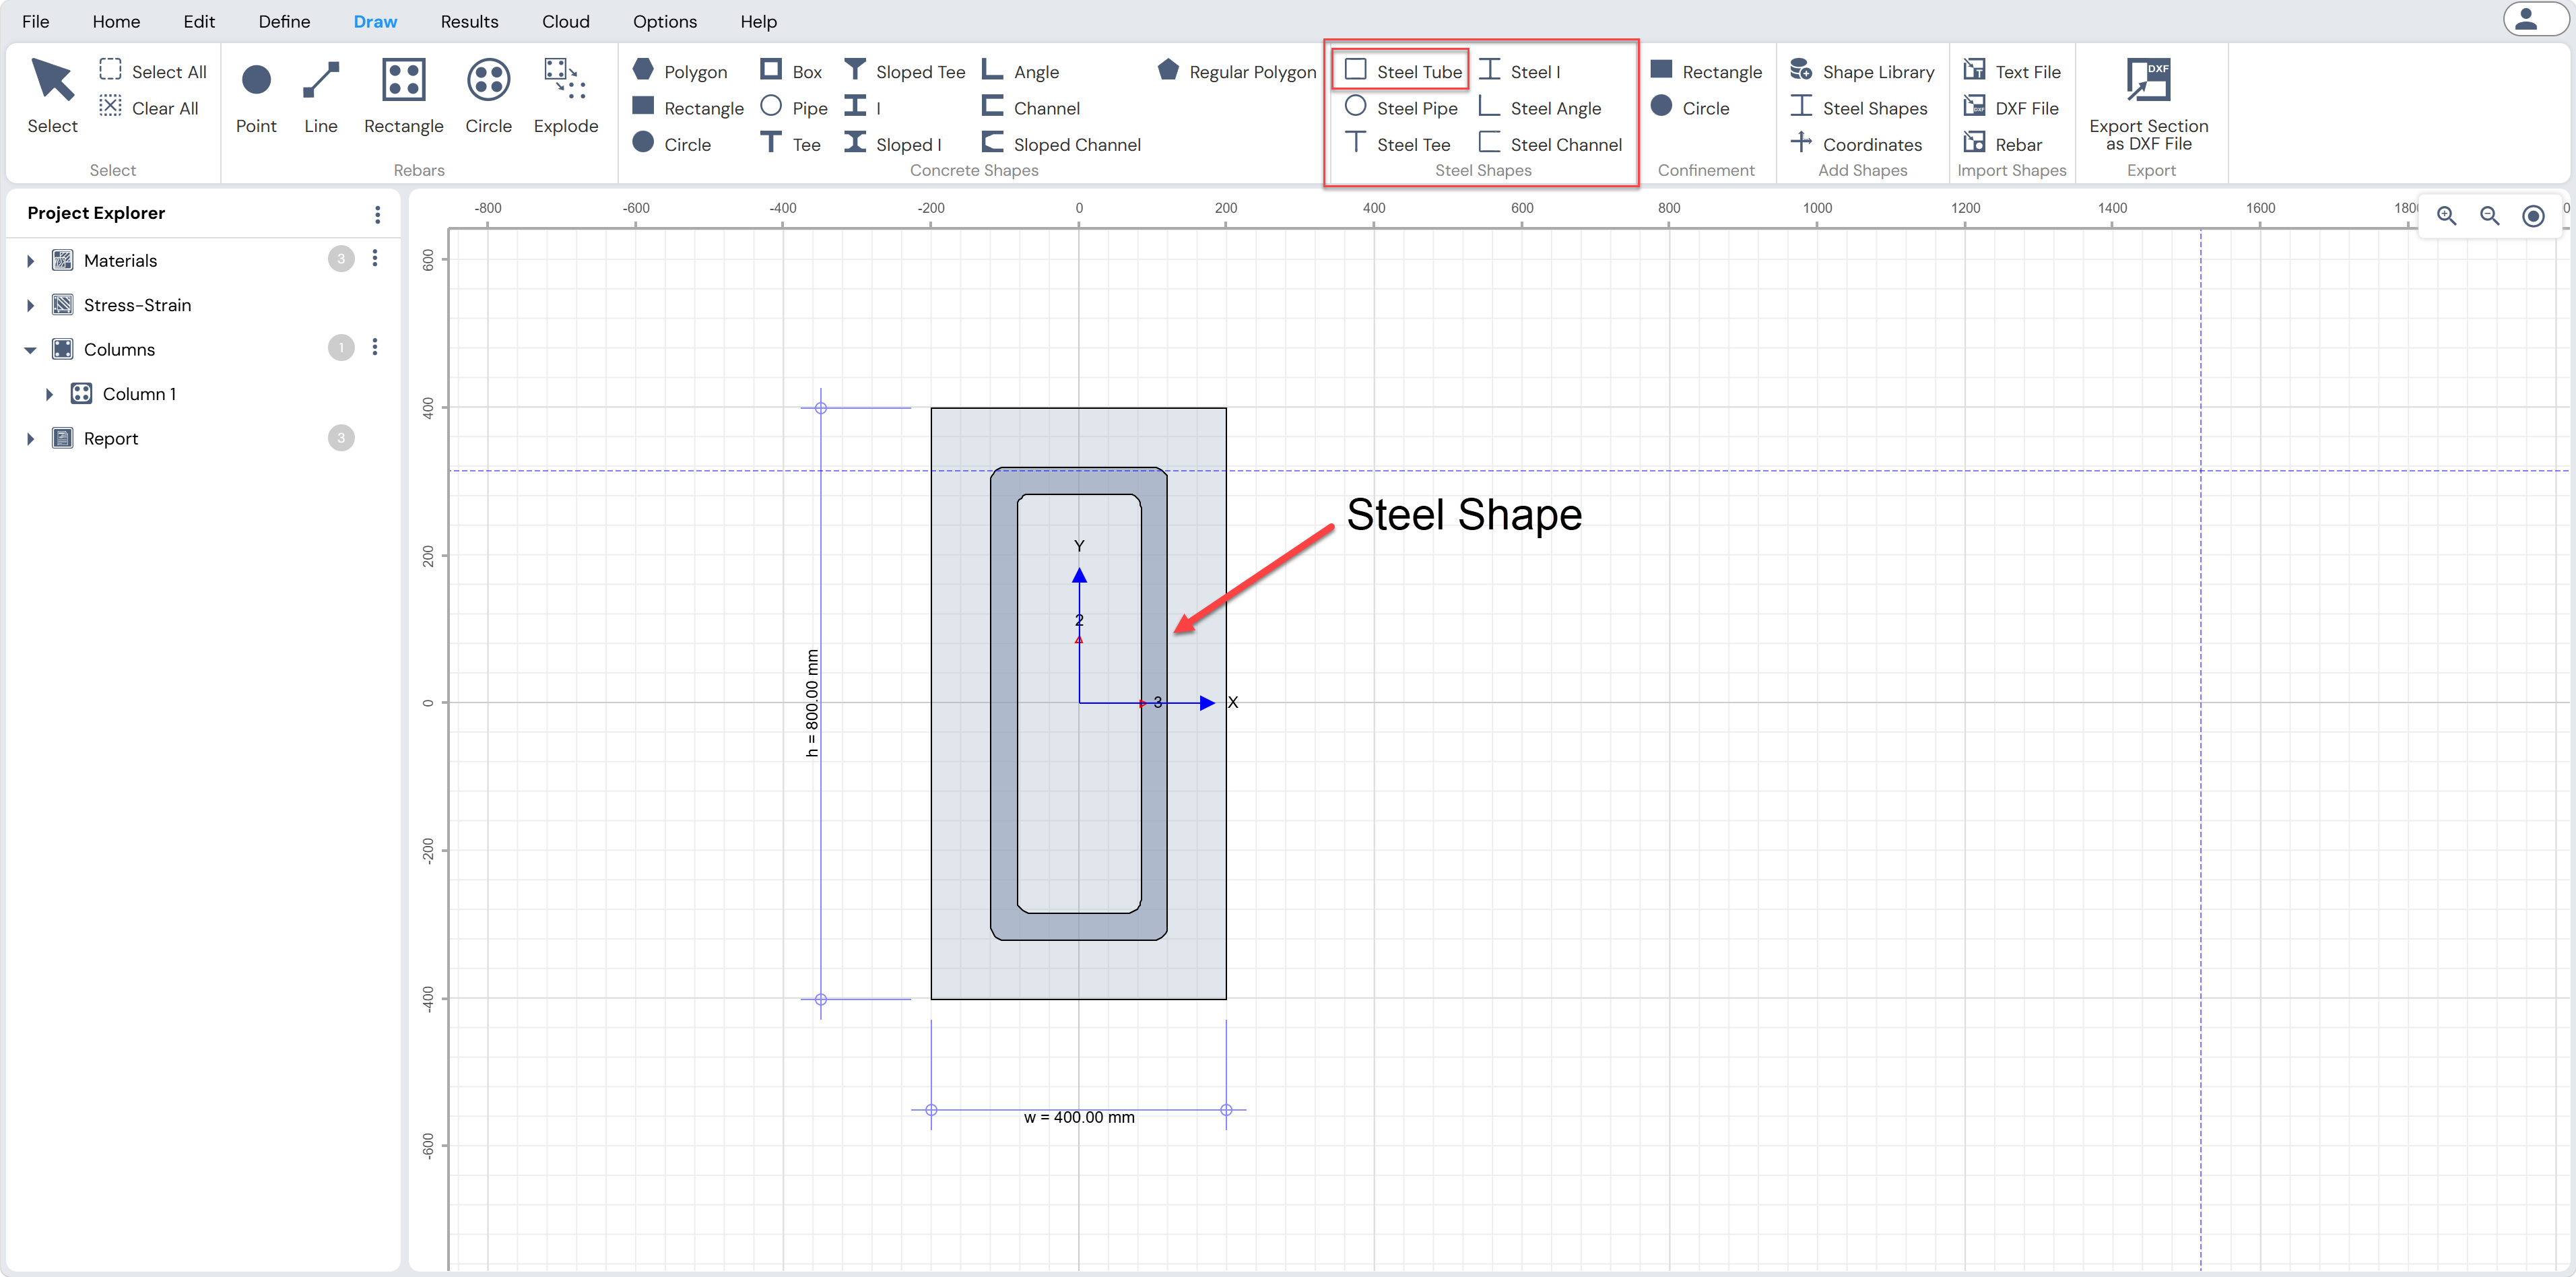
Figure: Drawing Steel Shapes in Column Designer
c. Draw Menu → Add Shapes → Shape Library
Select shapes from the predefined shape libraries.
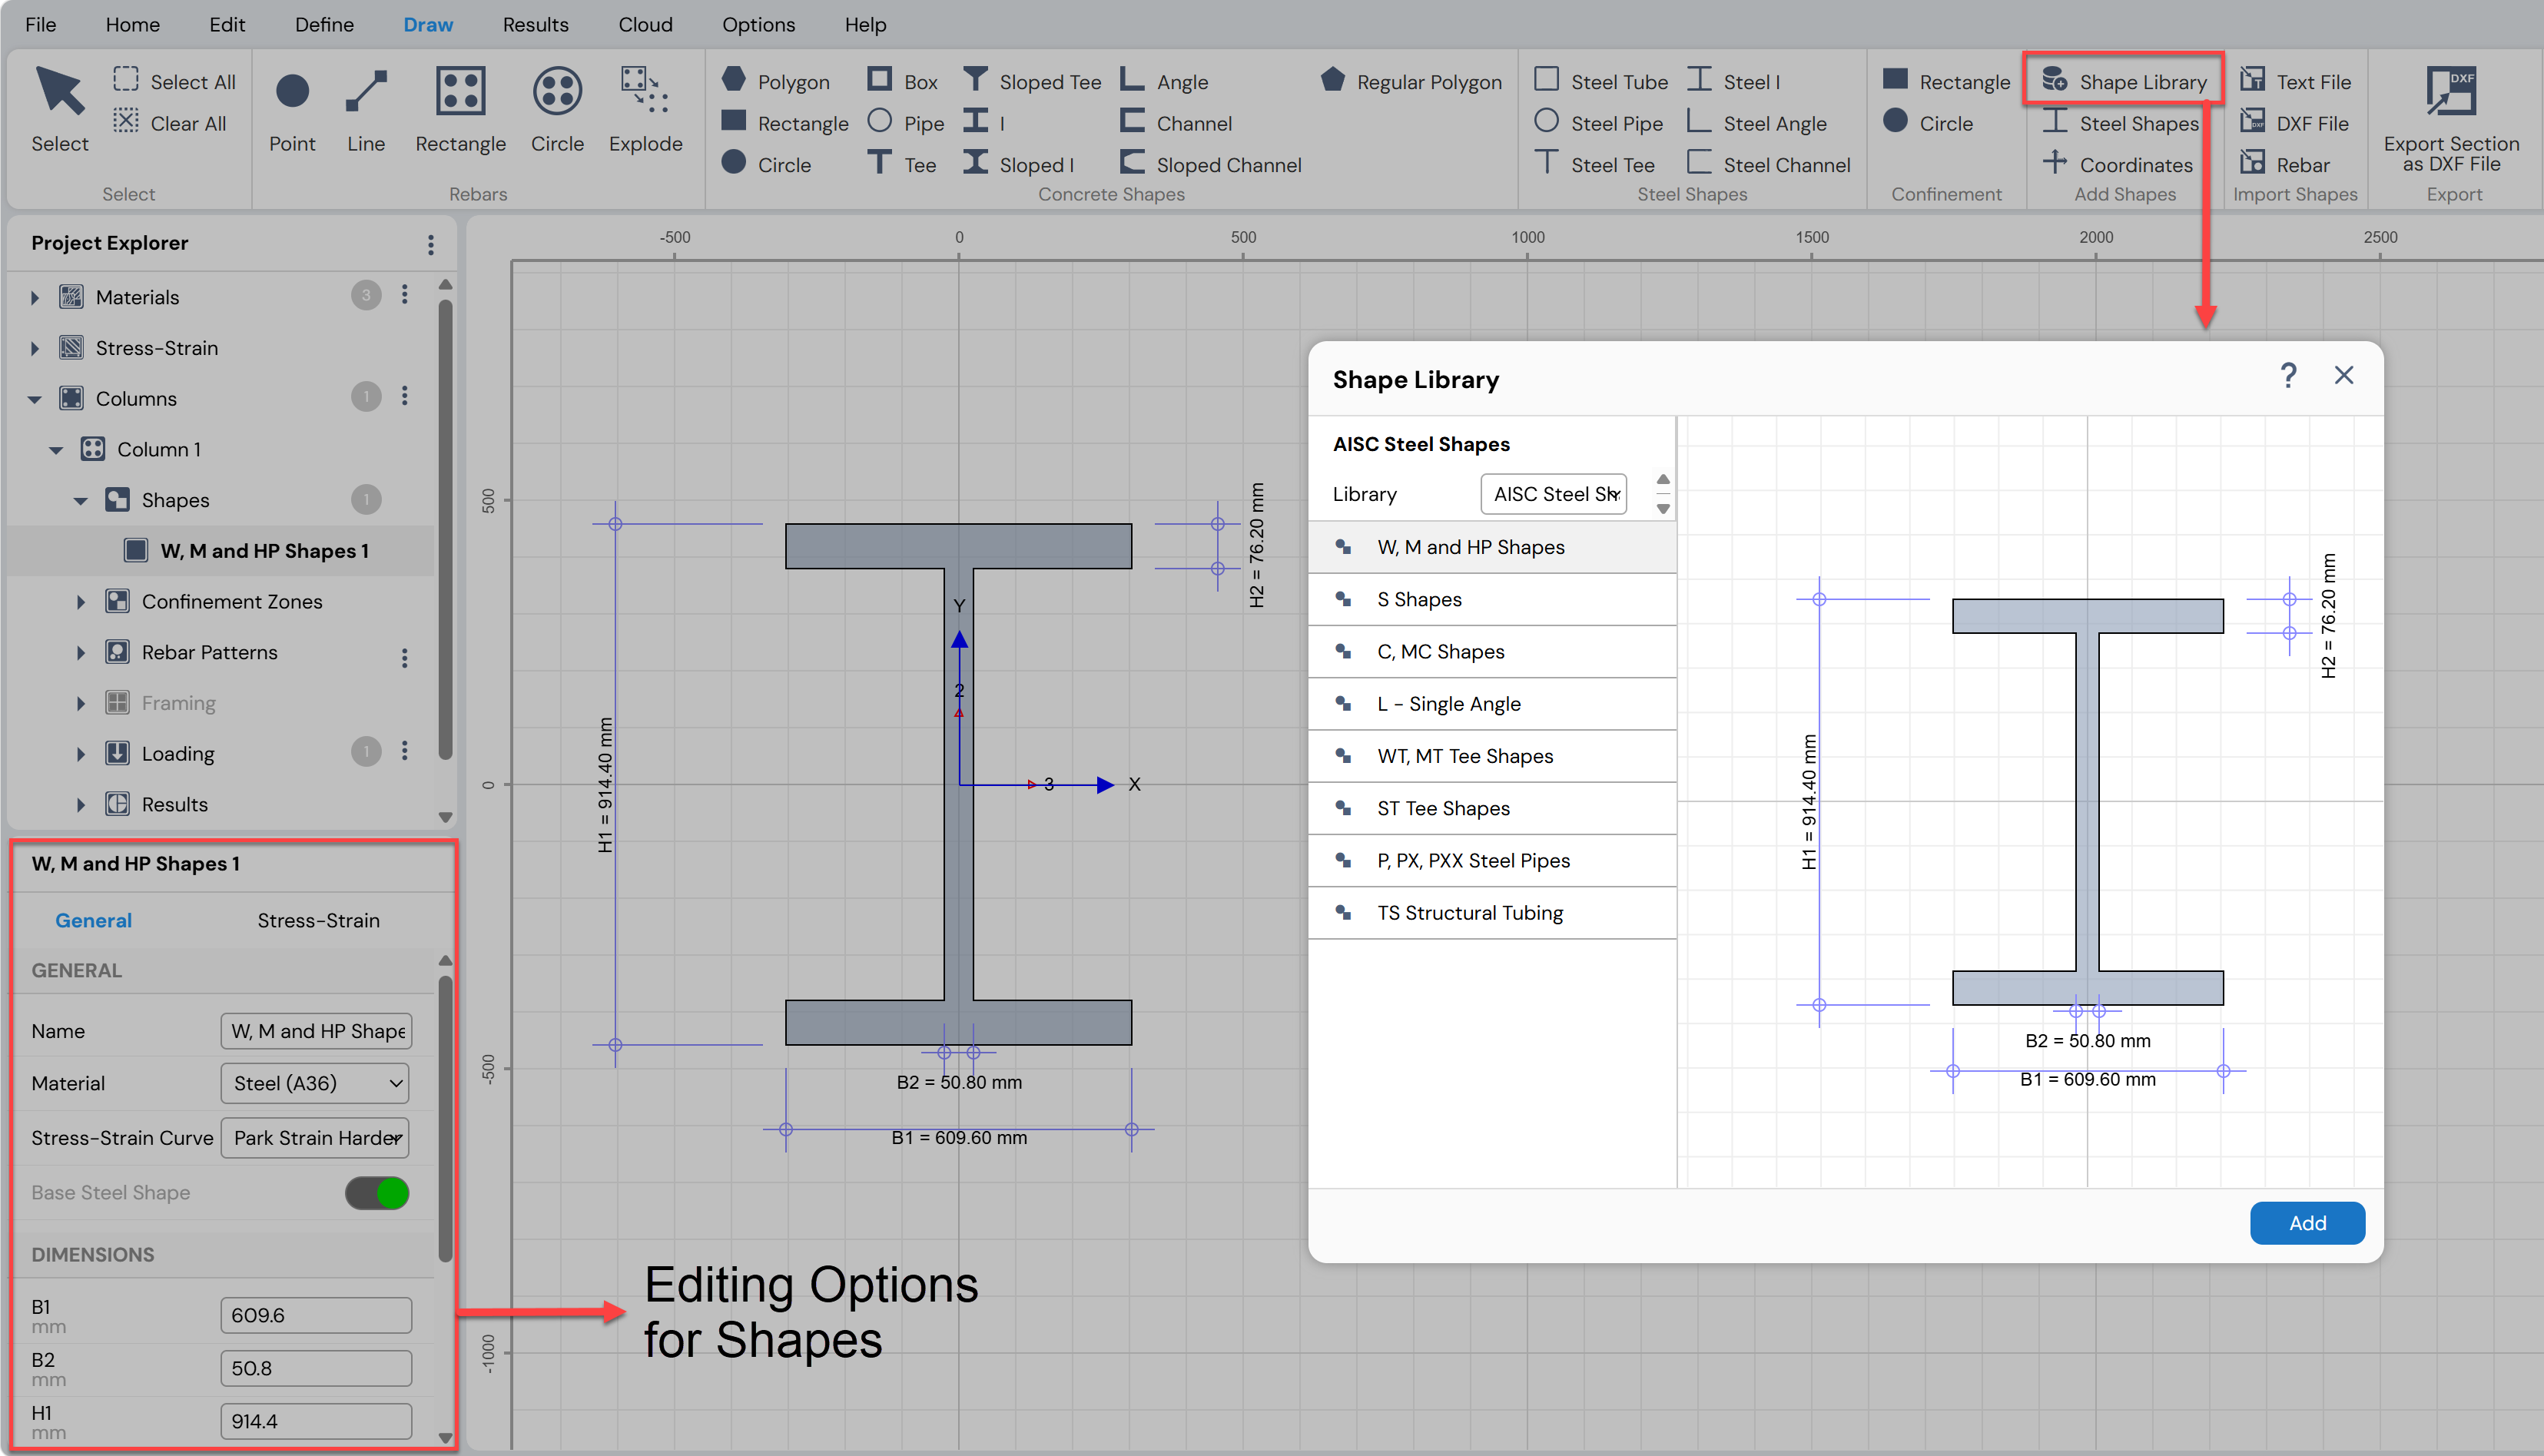
Figure: Shape Library in Column Designer
d. Draw Menu → Add Shapes → Steel Shapes
Access libraries of standard steel shapes.
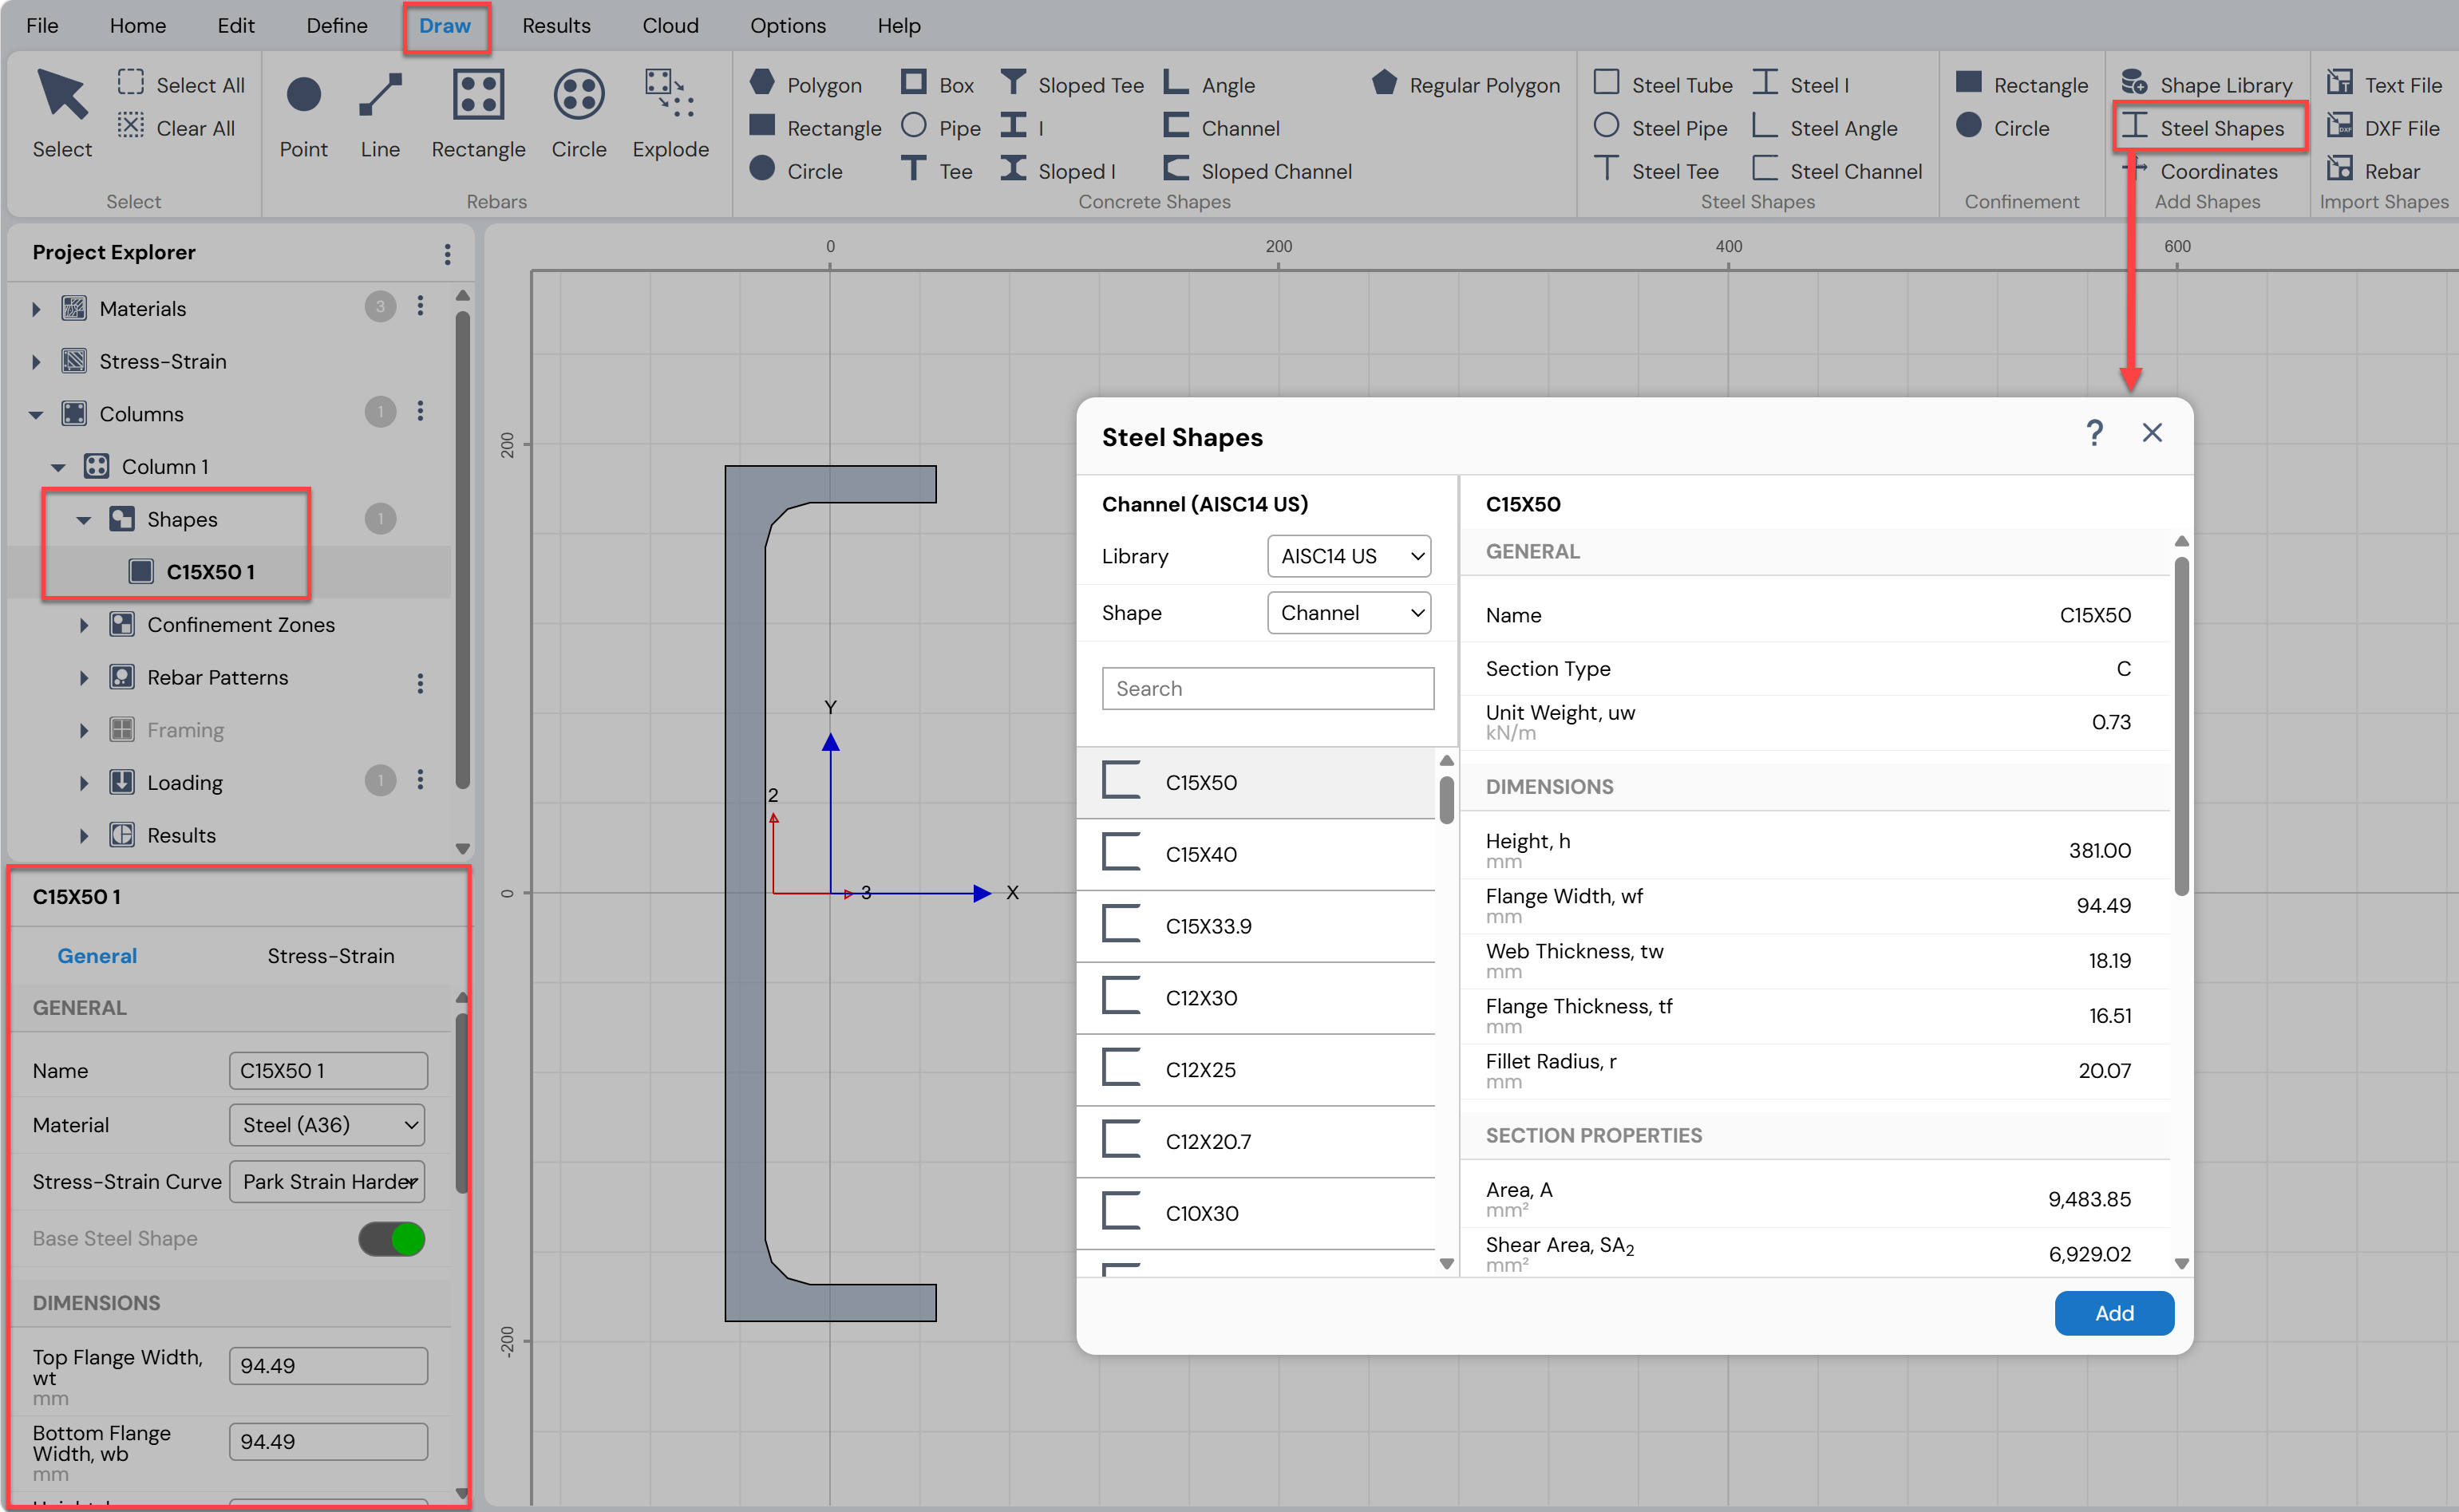
Figure: Drawing Standard Steel Shapes in Column Designer
e. Draw Menu → Add Shapes → Coordinates
Open the Add Points form to:
Enter coordinates manually, or
Import coordinates from external sources.
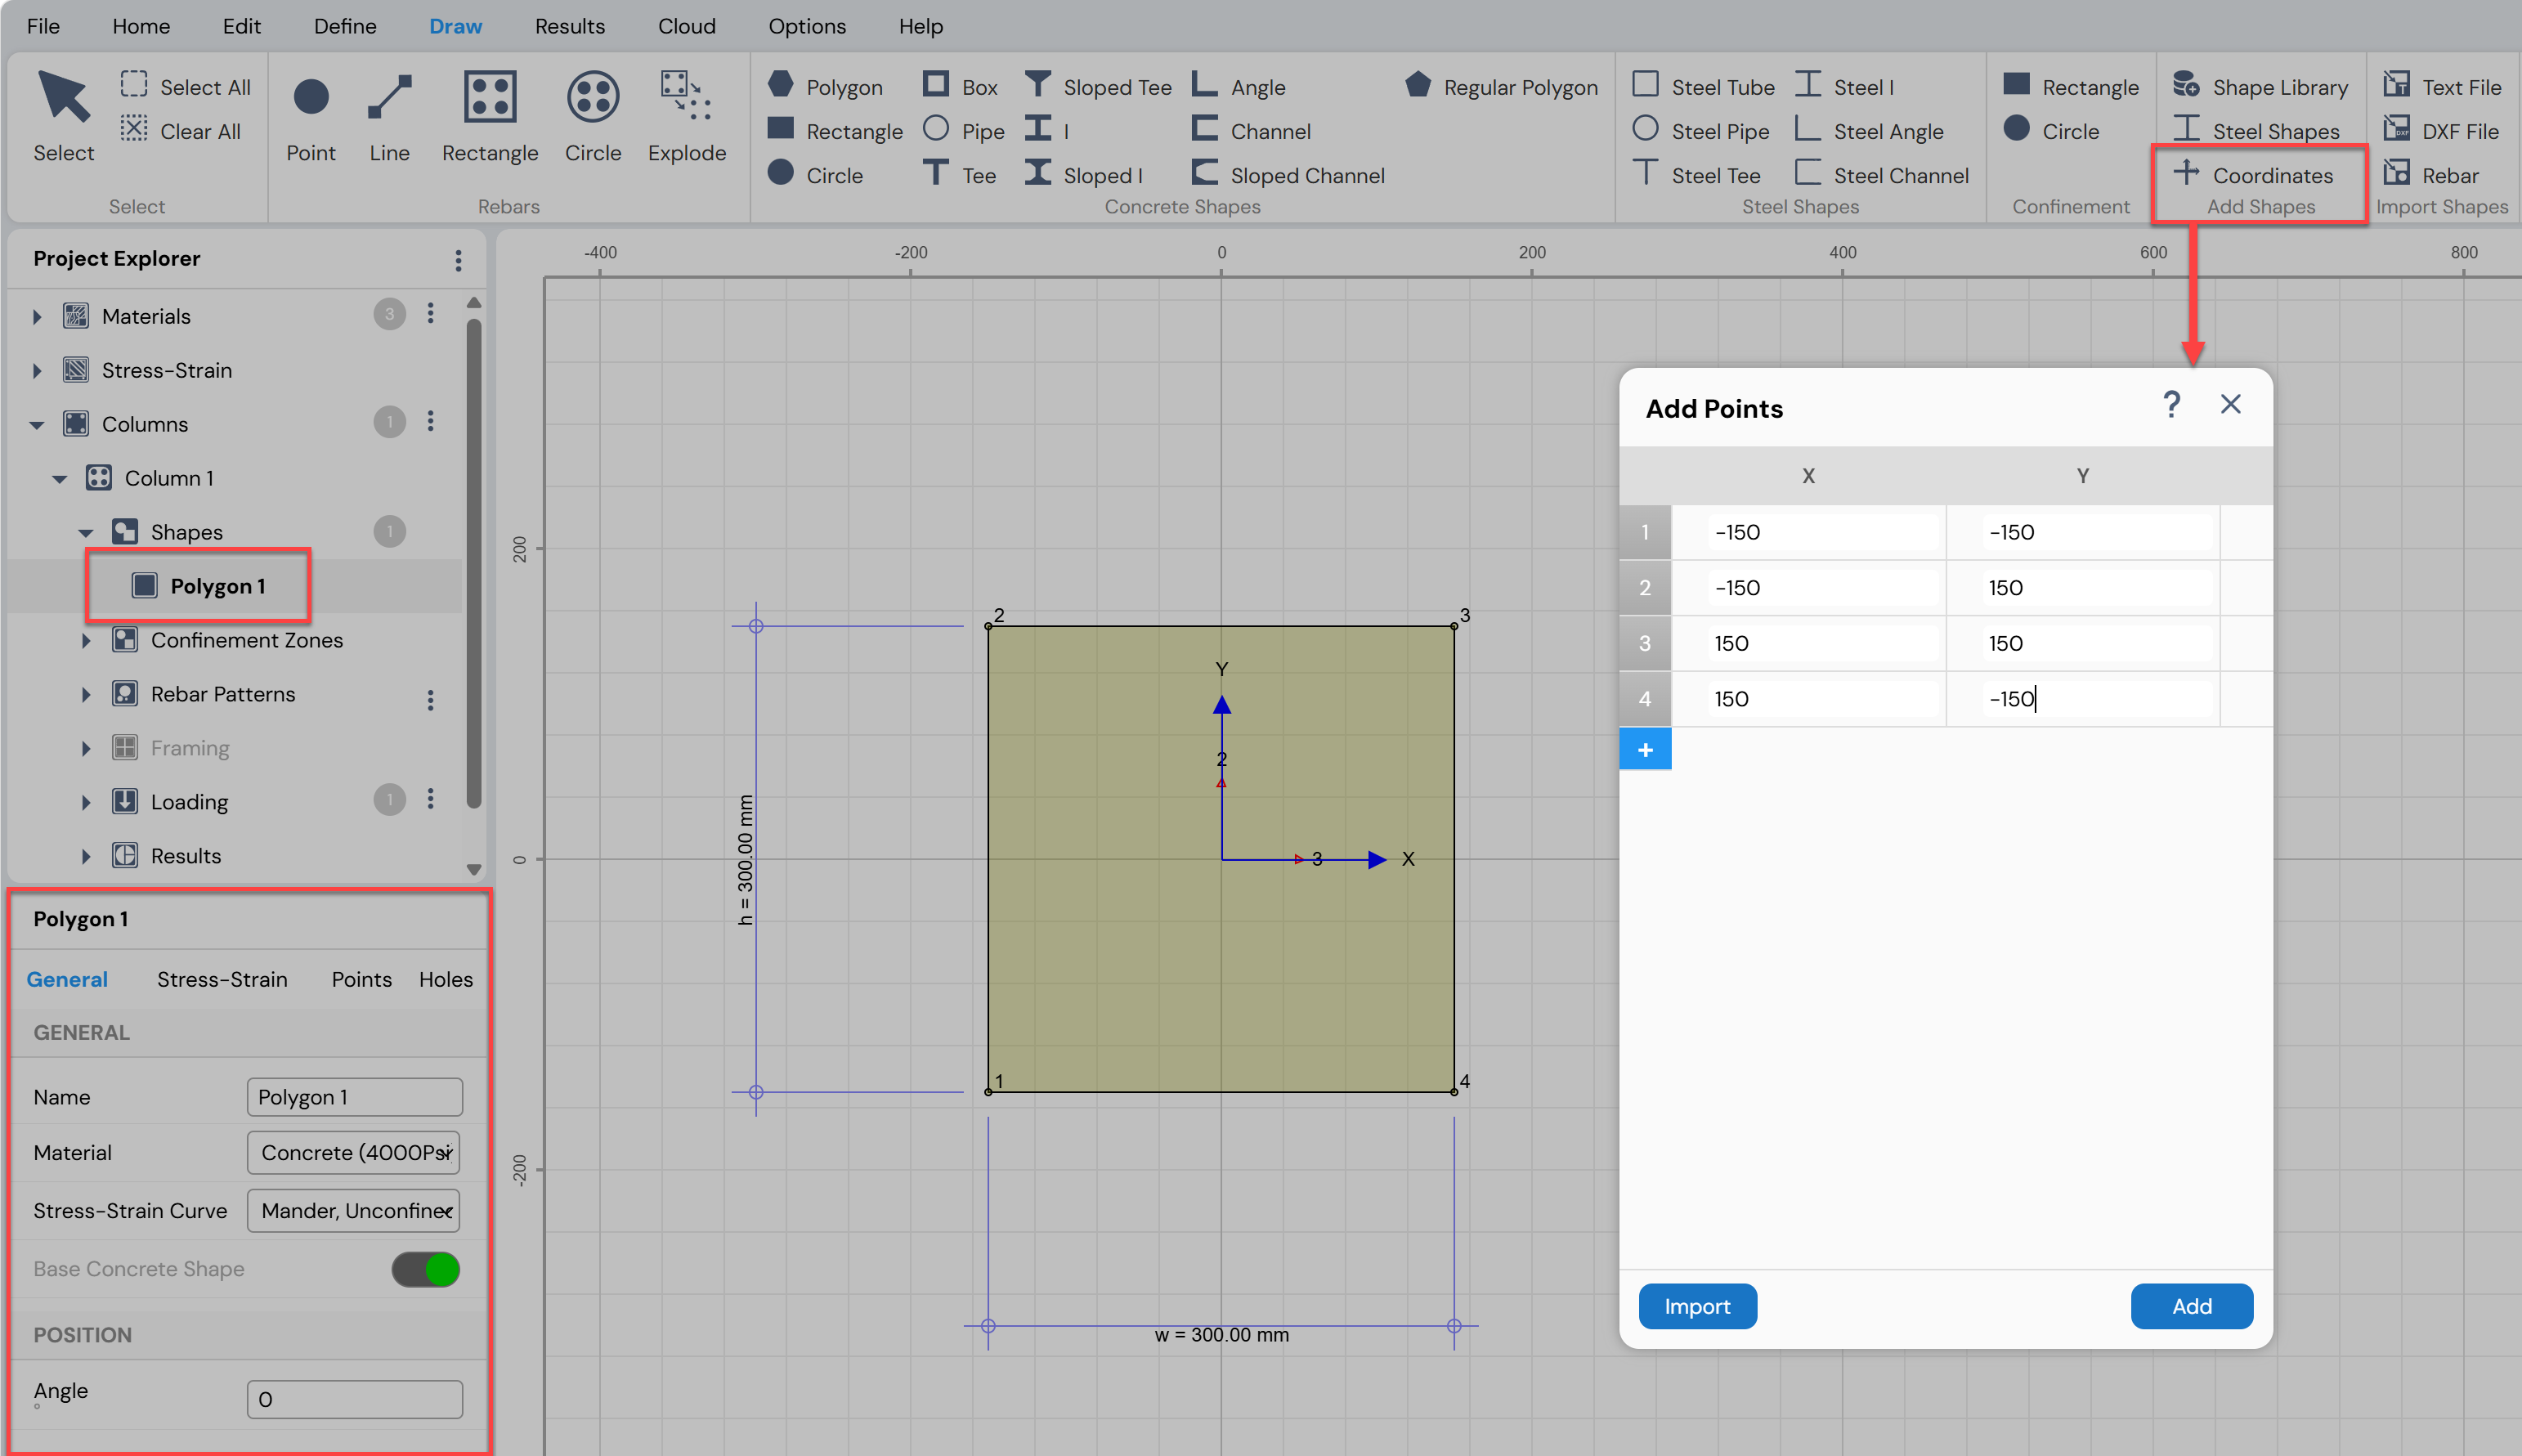
Figure: Adding Shapes by Coordinate Points in Column Designer
f. Draw Menu → Import Shapes → Text File
Import shapes from coordinates stored in a text file.
g. Draw Menu → Import Shapes → DXF File
Import shapes from a DXF file.
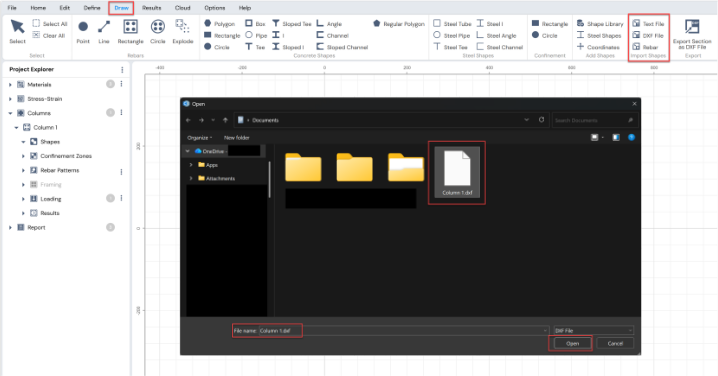
Figure: Import Shapes Options in Column Designer
Add Additional Shapes
Repeat Step 6 to add multiple shapes to form the desired column cross-section.Edit and Modify Shapes
Use tools available under the Edit Menu, such as:Flip
Merge
Stack
Align
Edit
to modify the shapes and obtain the required section geometry.
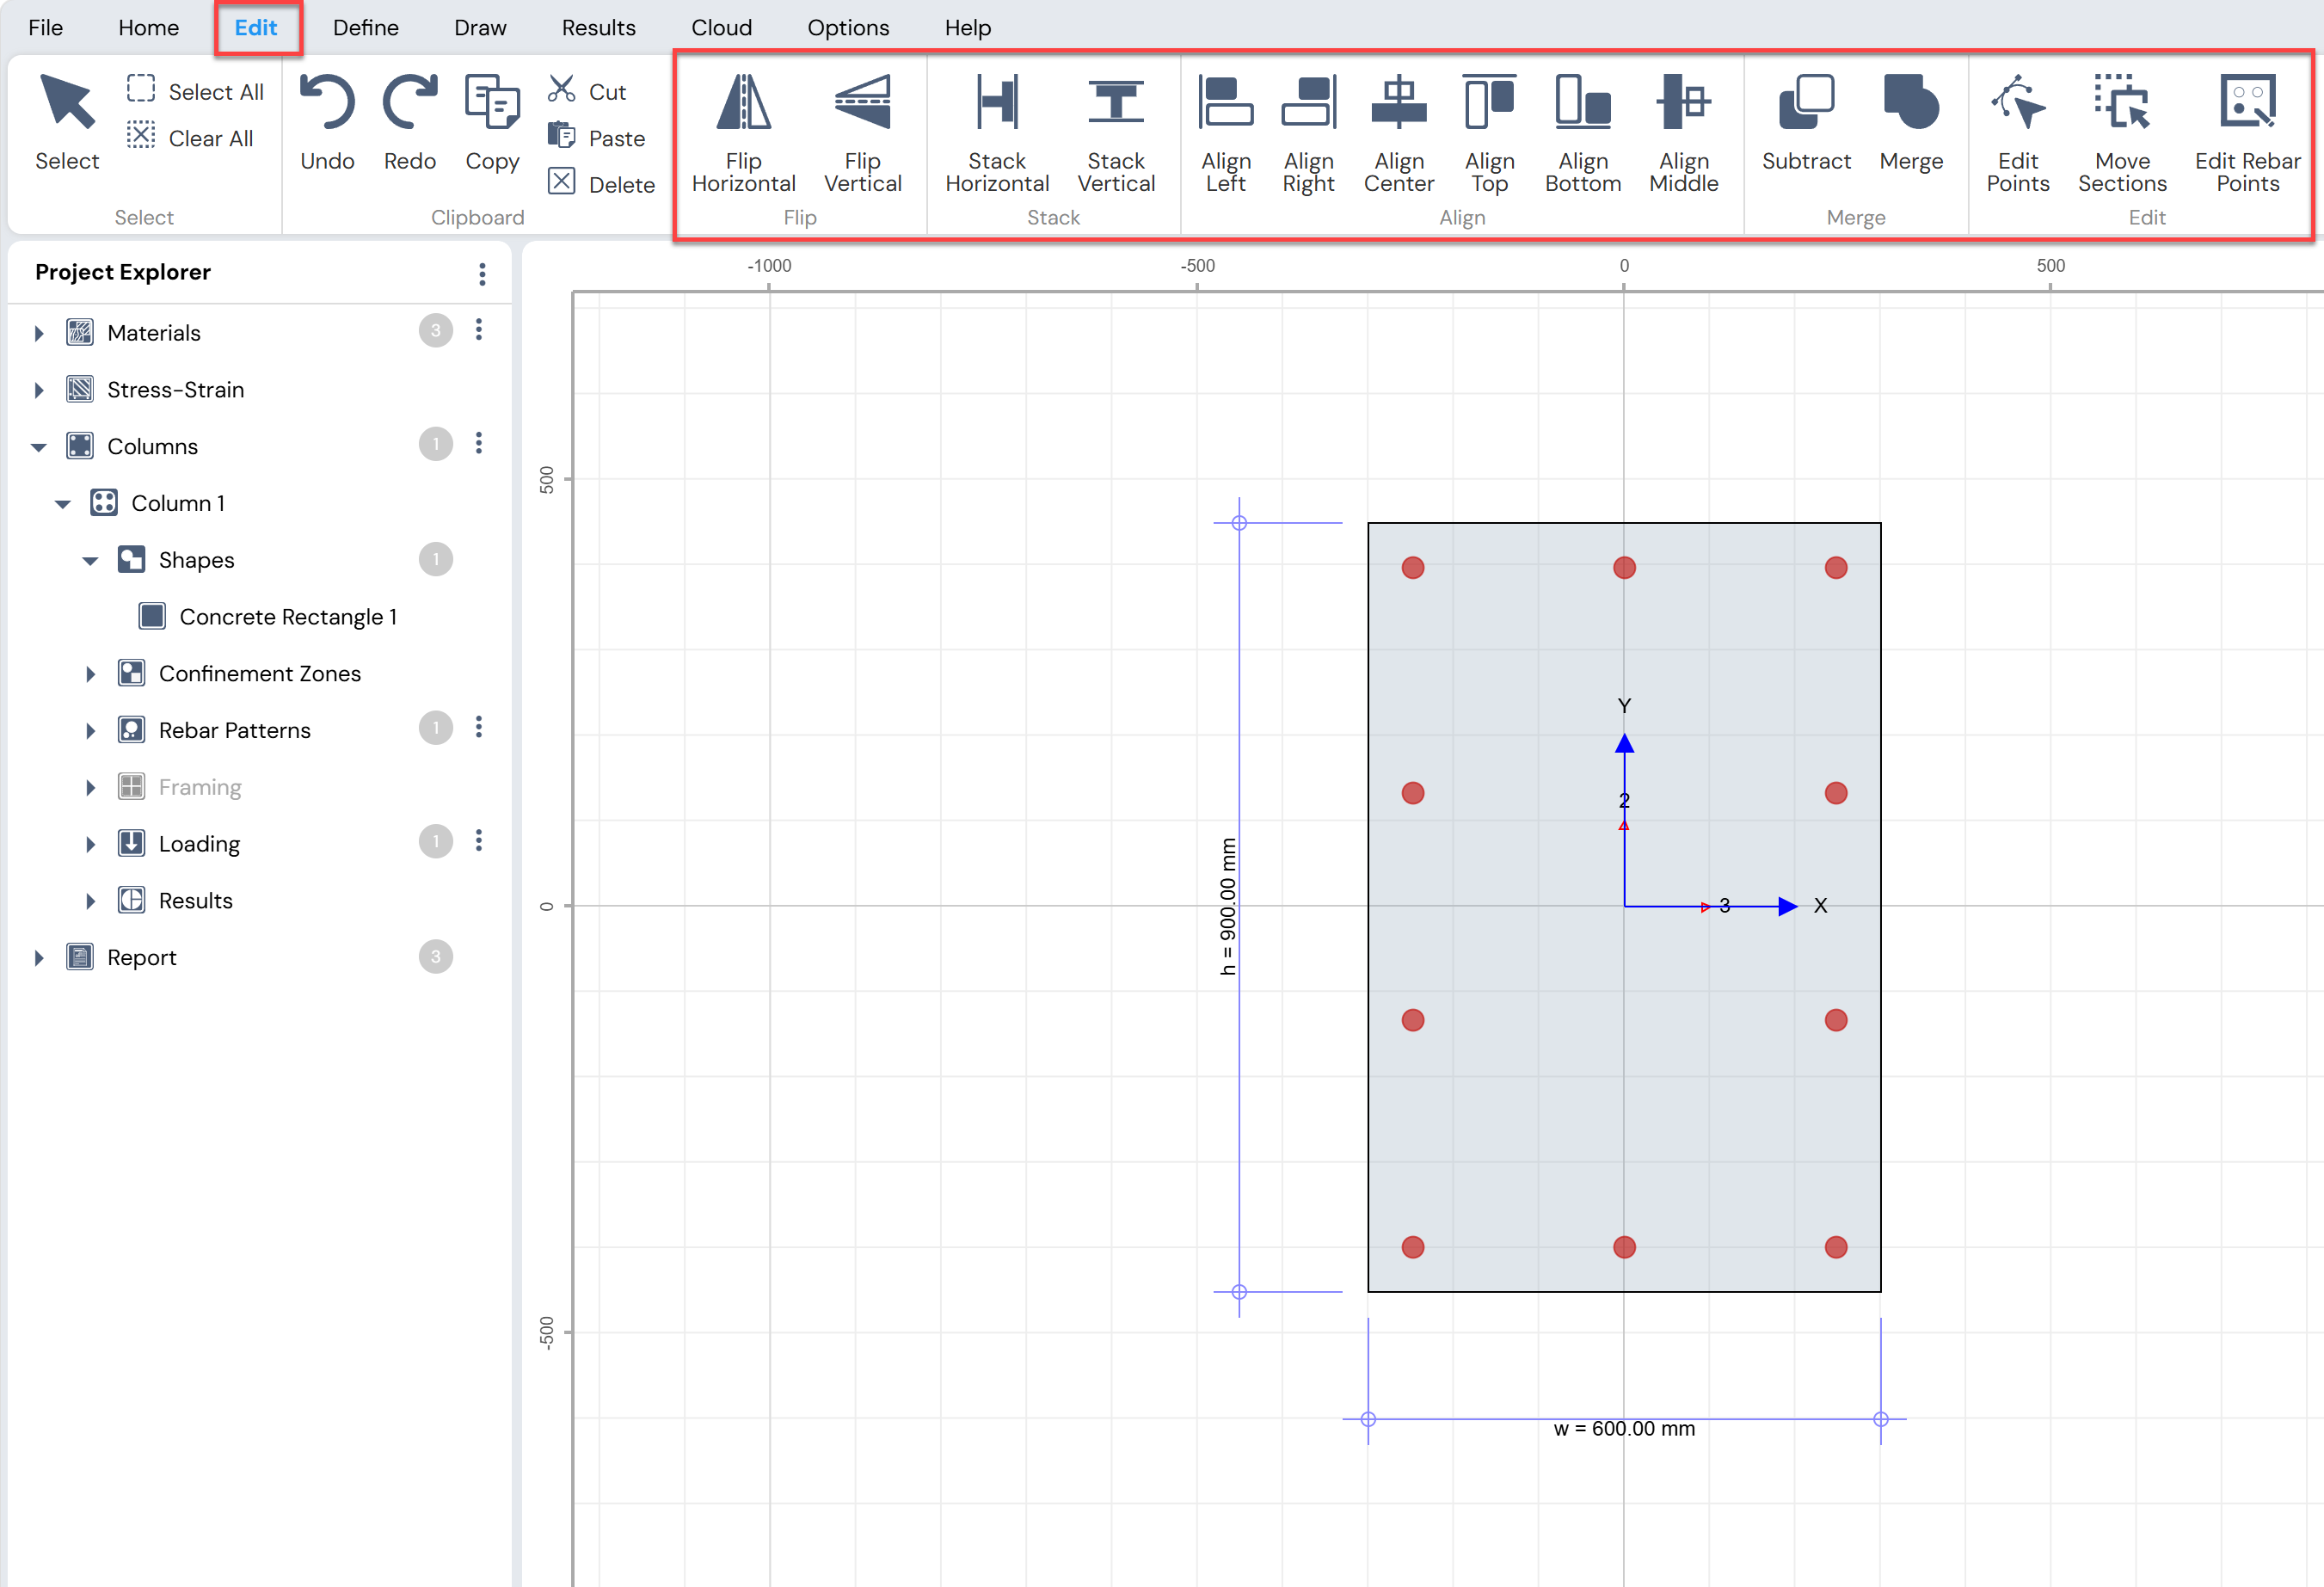
Figure: Editing/Modify Options in Column Designer
Add Reinforcement
Use the tools under Draw Menu → Rebars to add reinforcement to the section.
Reinforcement can be added as:Points
Lines
Rectangular patterns
Circular patterns
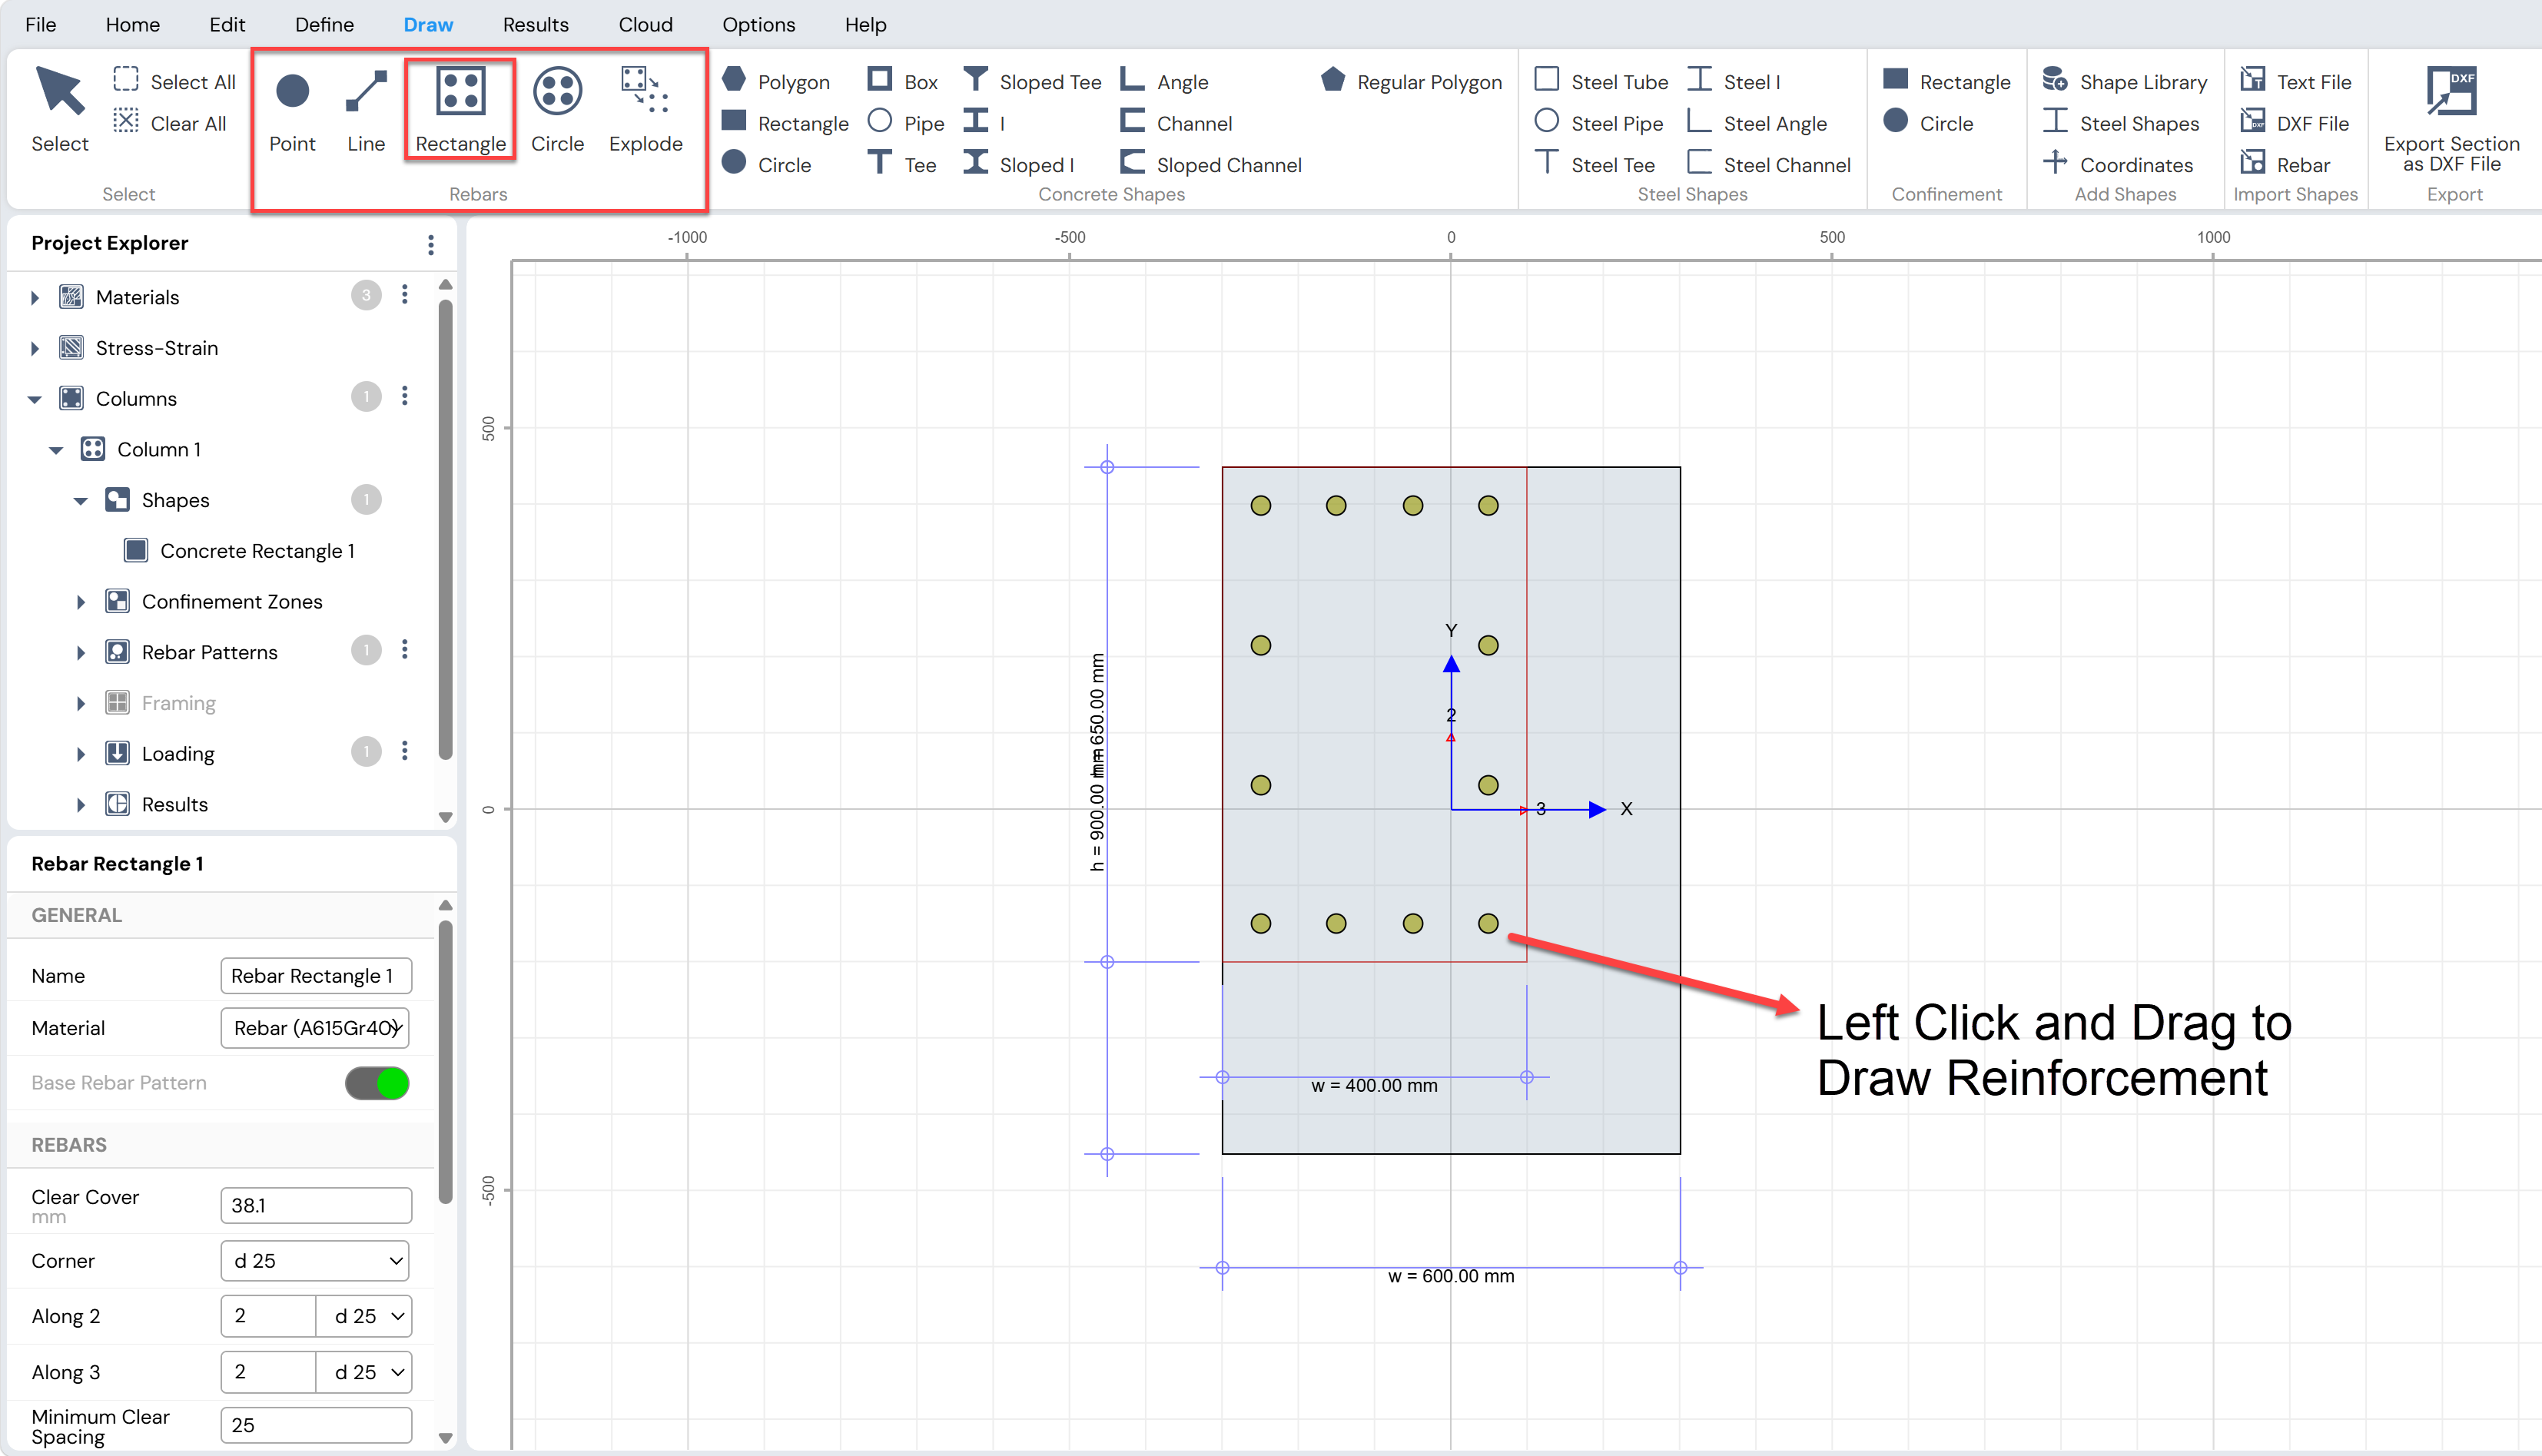
Figure: Adding Rebars Options in Column Designer
Edit Shape and Rebar Properties
Click on a shape or rebar to activate the Property Grid and edit dimensions and other properties numerically.The Property Grid for concrete and steel shapes includes a Stress–Strain tab
Assigned stress–strain models can be viewed and modified if required
The Property Grid can also be accessed by selecting shapes or rebars from the Project Explorer → Columns view
Note:
Shapes created using Draw Menu → Concrete Shapes → Polygon can only be edited by modifying nodal coordinates:
From the Points tab of the Property Grid, or
Using Edit Menu → Edit → Edit Points
Parametric shapes can be converted to polygons using Edit Menu → Edit → Edit Points
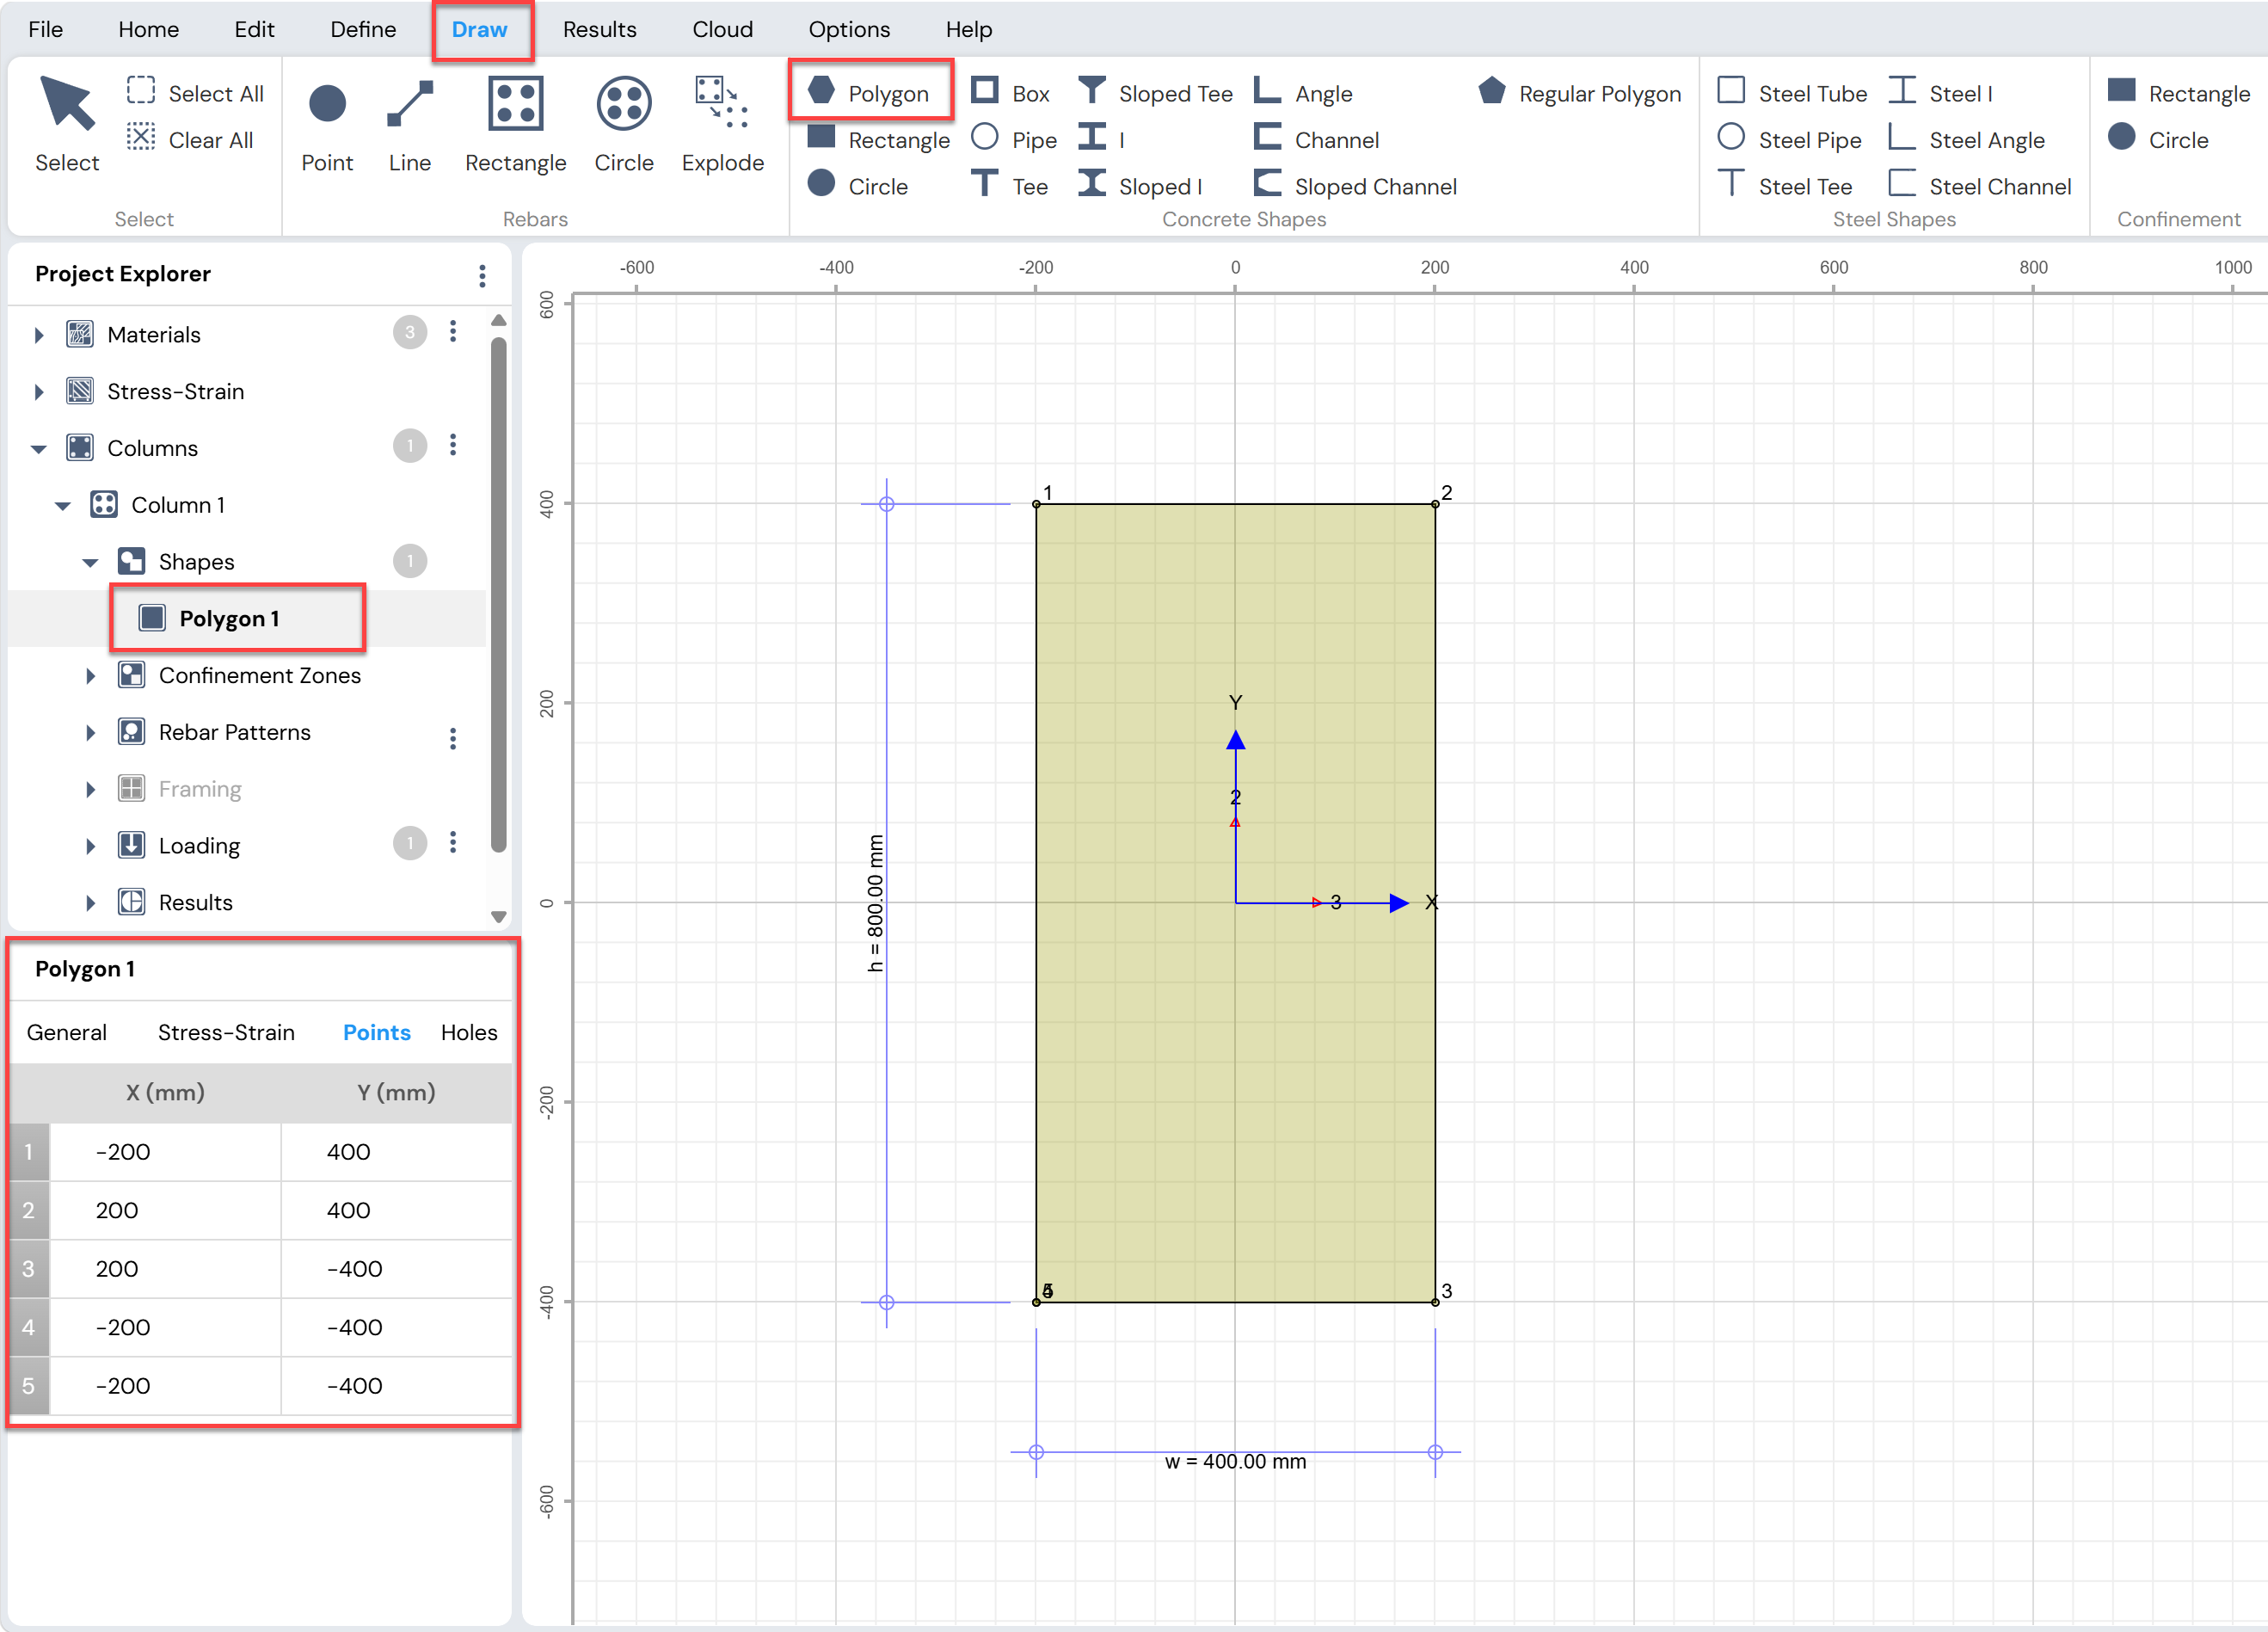
Figure: Editing Shapes and Rebar Properties in Column Designer
Enable Slenderness Effects (if applicable)
If the column is slender, click:- Define Menu → Slenderness → Slenderness Effects
If the column is not slender, skip this step and Step 12.
Define Framing Conditions (for Slender Columns)
For slender columns, define framing conditions using:Define Menu → Slenderness → Framing Condition, or
The button next to Project Explorer → Columns → Framing → Conditions
Note:
This option is available only when slenderness effects are enabled.
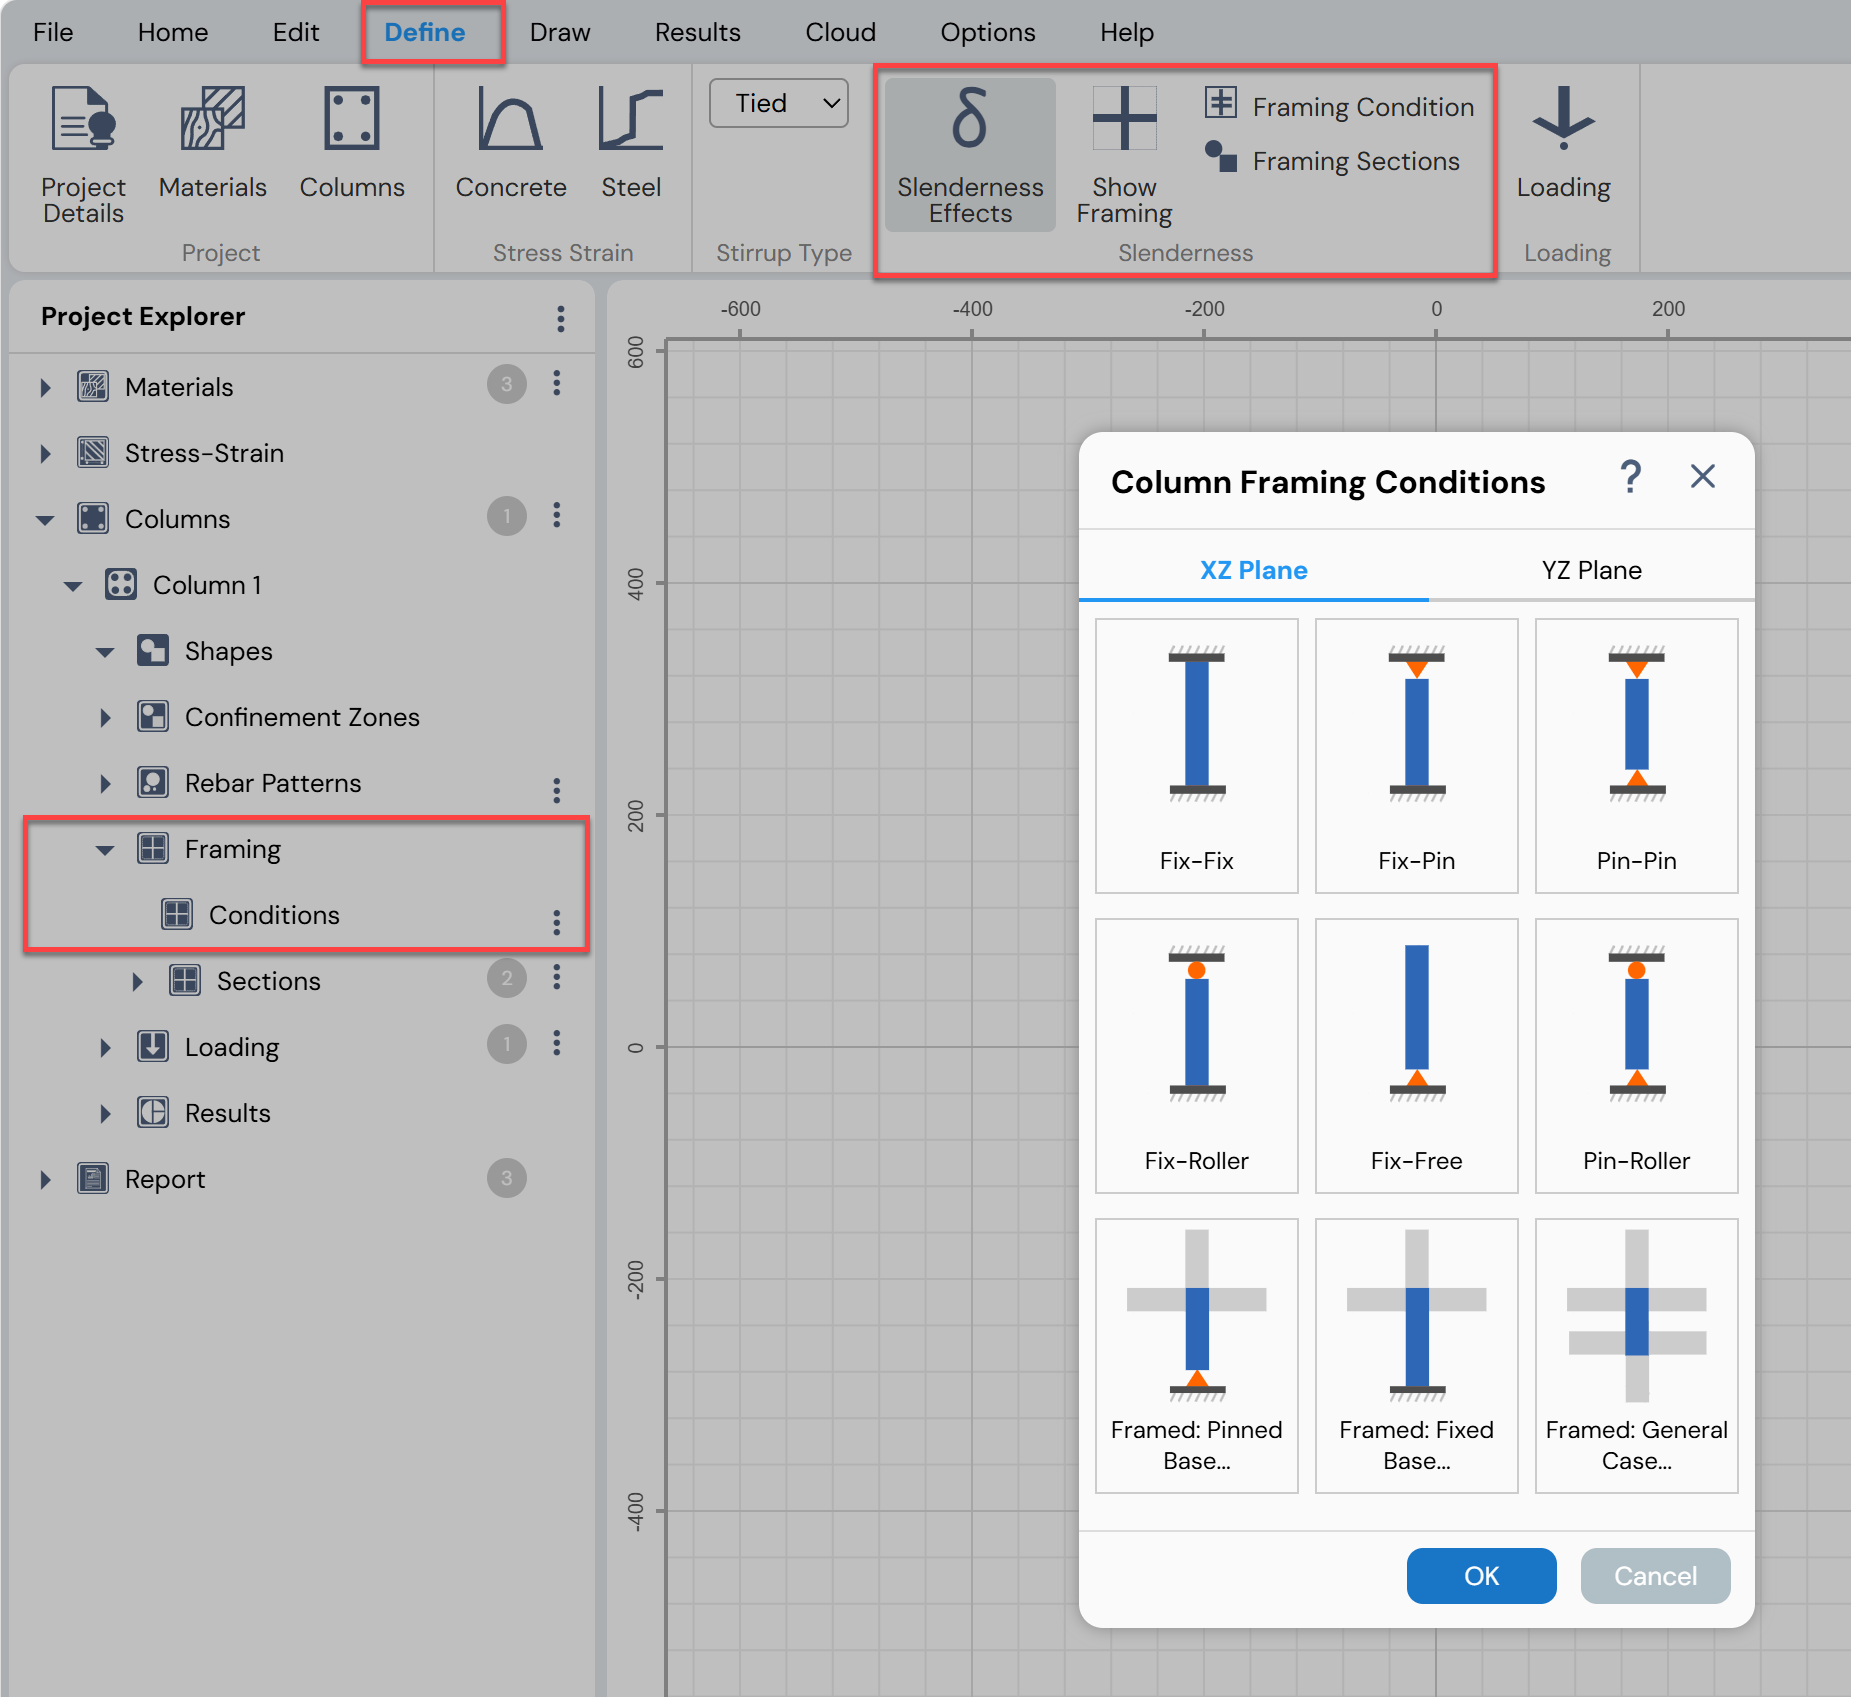
Figure: Framing Conditions for Slender Column in Column Designer
Define Loading
Define column loads using:Define Menu → Loading → Loading, or
The button next to Project Explorer → Columns → Loading
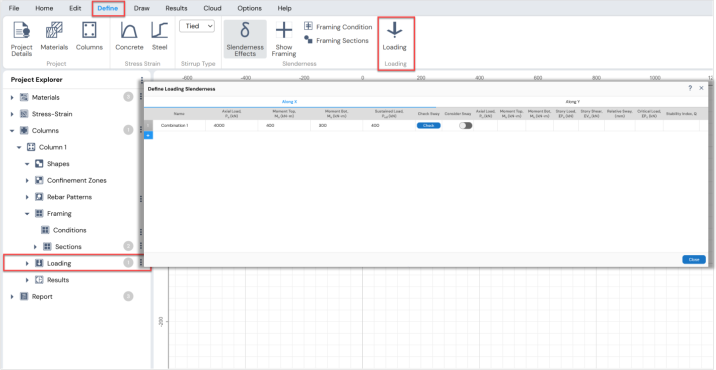
Figure: Load Definition in Column Designer
Apply Auto Design
Use Home Menu → Design → Auto-Design to perform an iterative design process that determines:Minimum required reinforcement
Reinforcement layout for the governing load combination
The design satisfies user-defined limits for:
Minimum and maximum bar sizes
Clear cover
Clear spacing
Maximum rebar ratio
Maximum D/C ratio
Note:
Auto Design is available only for rectangular and circular reinforced sections.
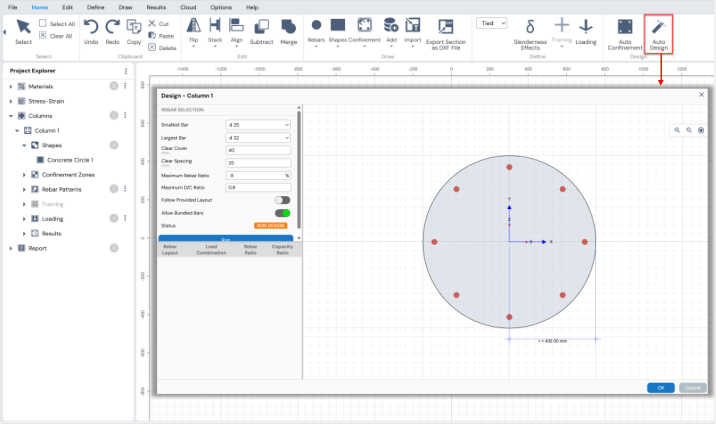
Figure: Auto Design Feature in Column Designer
Review Results
Use the options under:Results Menu, or
Project Explorer → Columns → Results
to review analysis and design outputs for the column section.
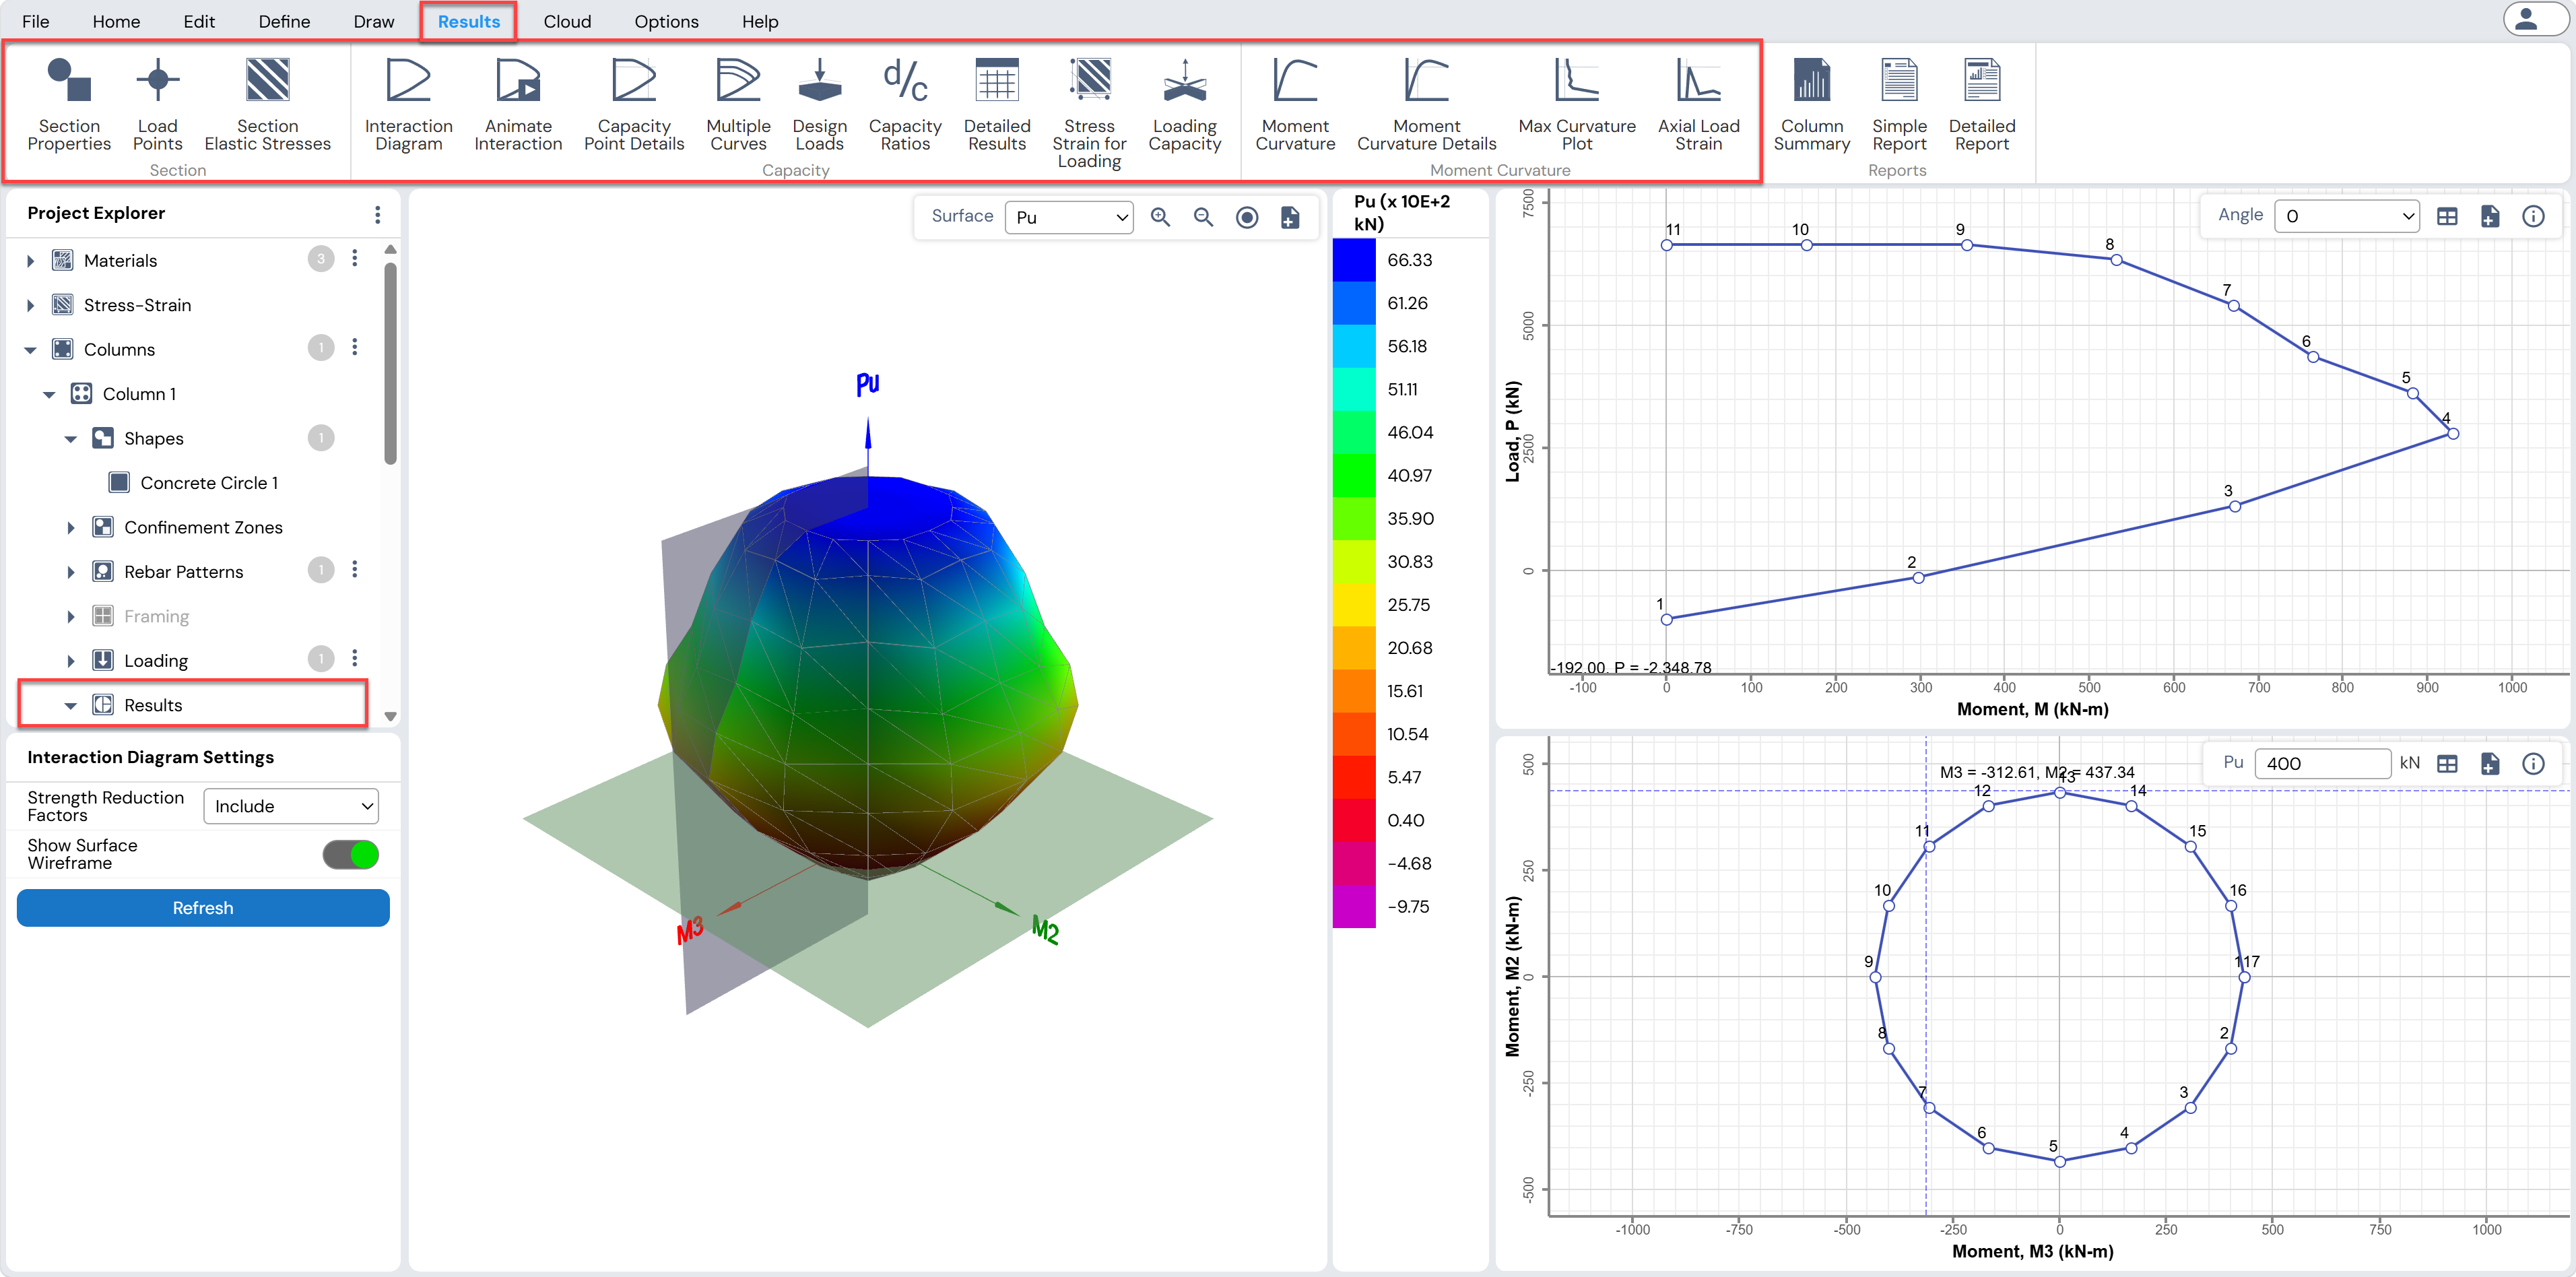
Figure: Viewing Result Options in Column Designer
Generate Reports
Use the Report view of the Project Explorer to:View the column summary
Generate a one-page report
Generate a detailed report
for the selected column.
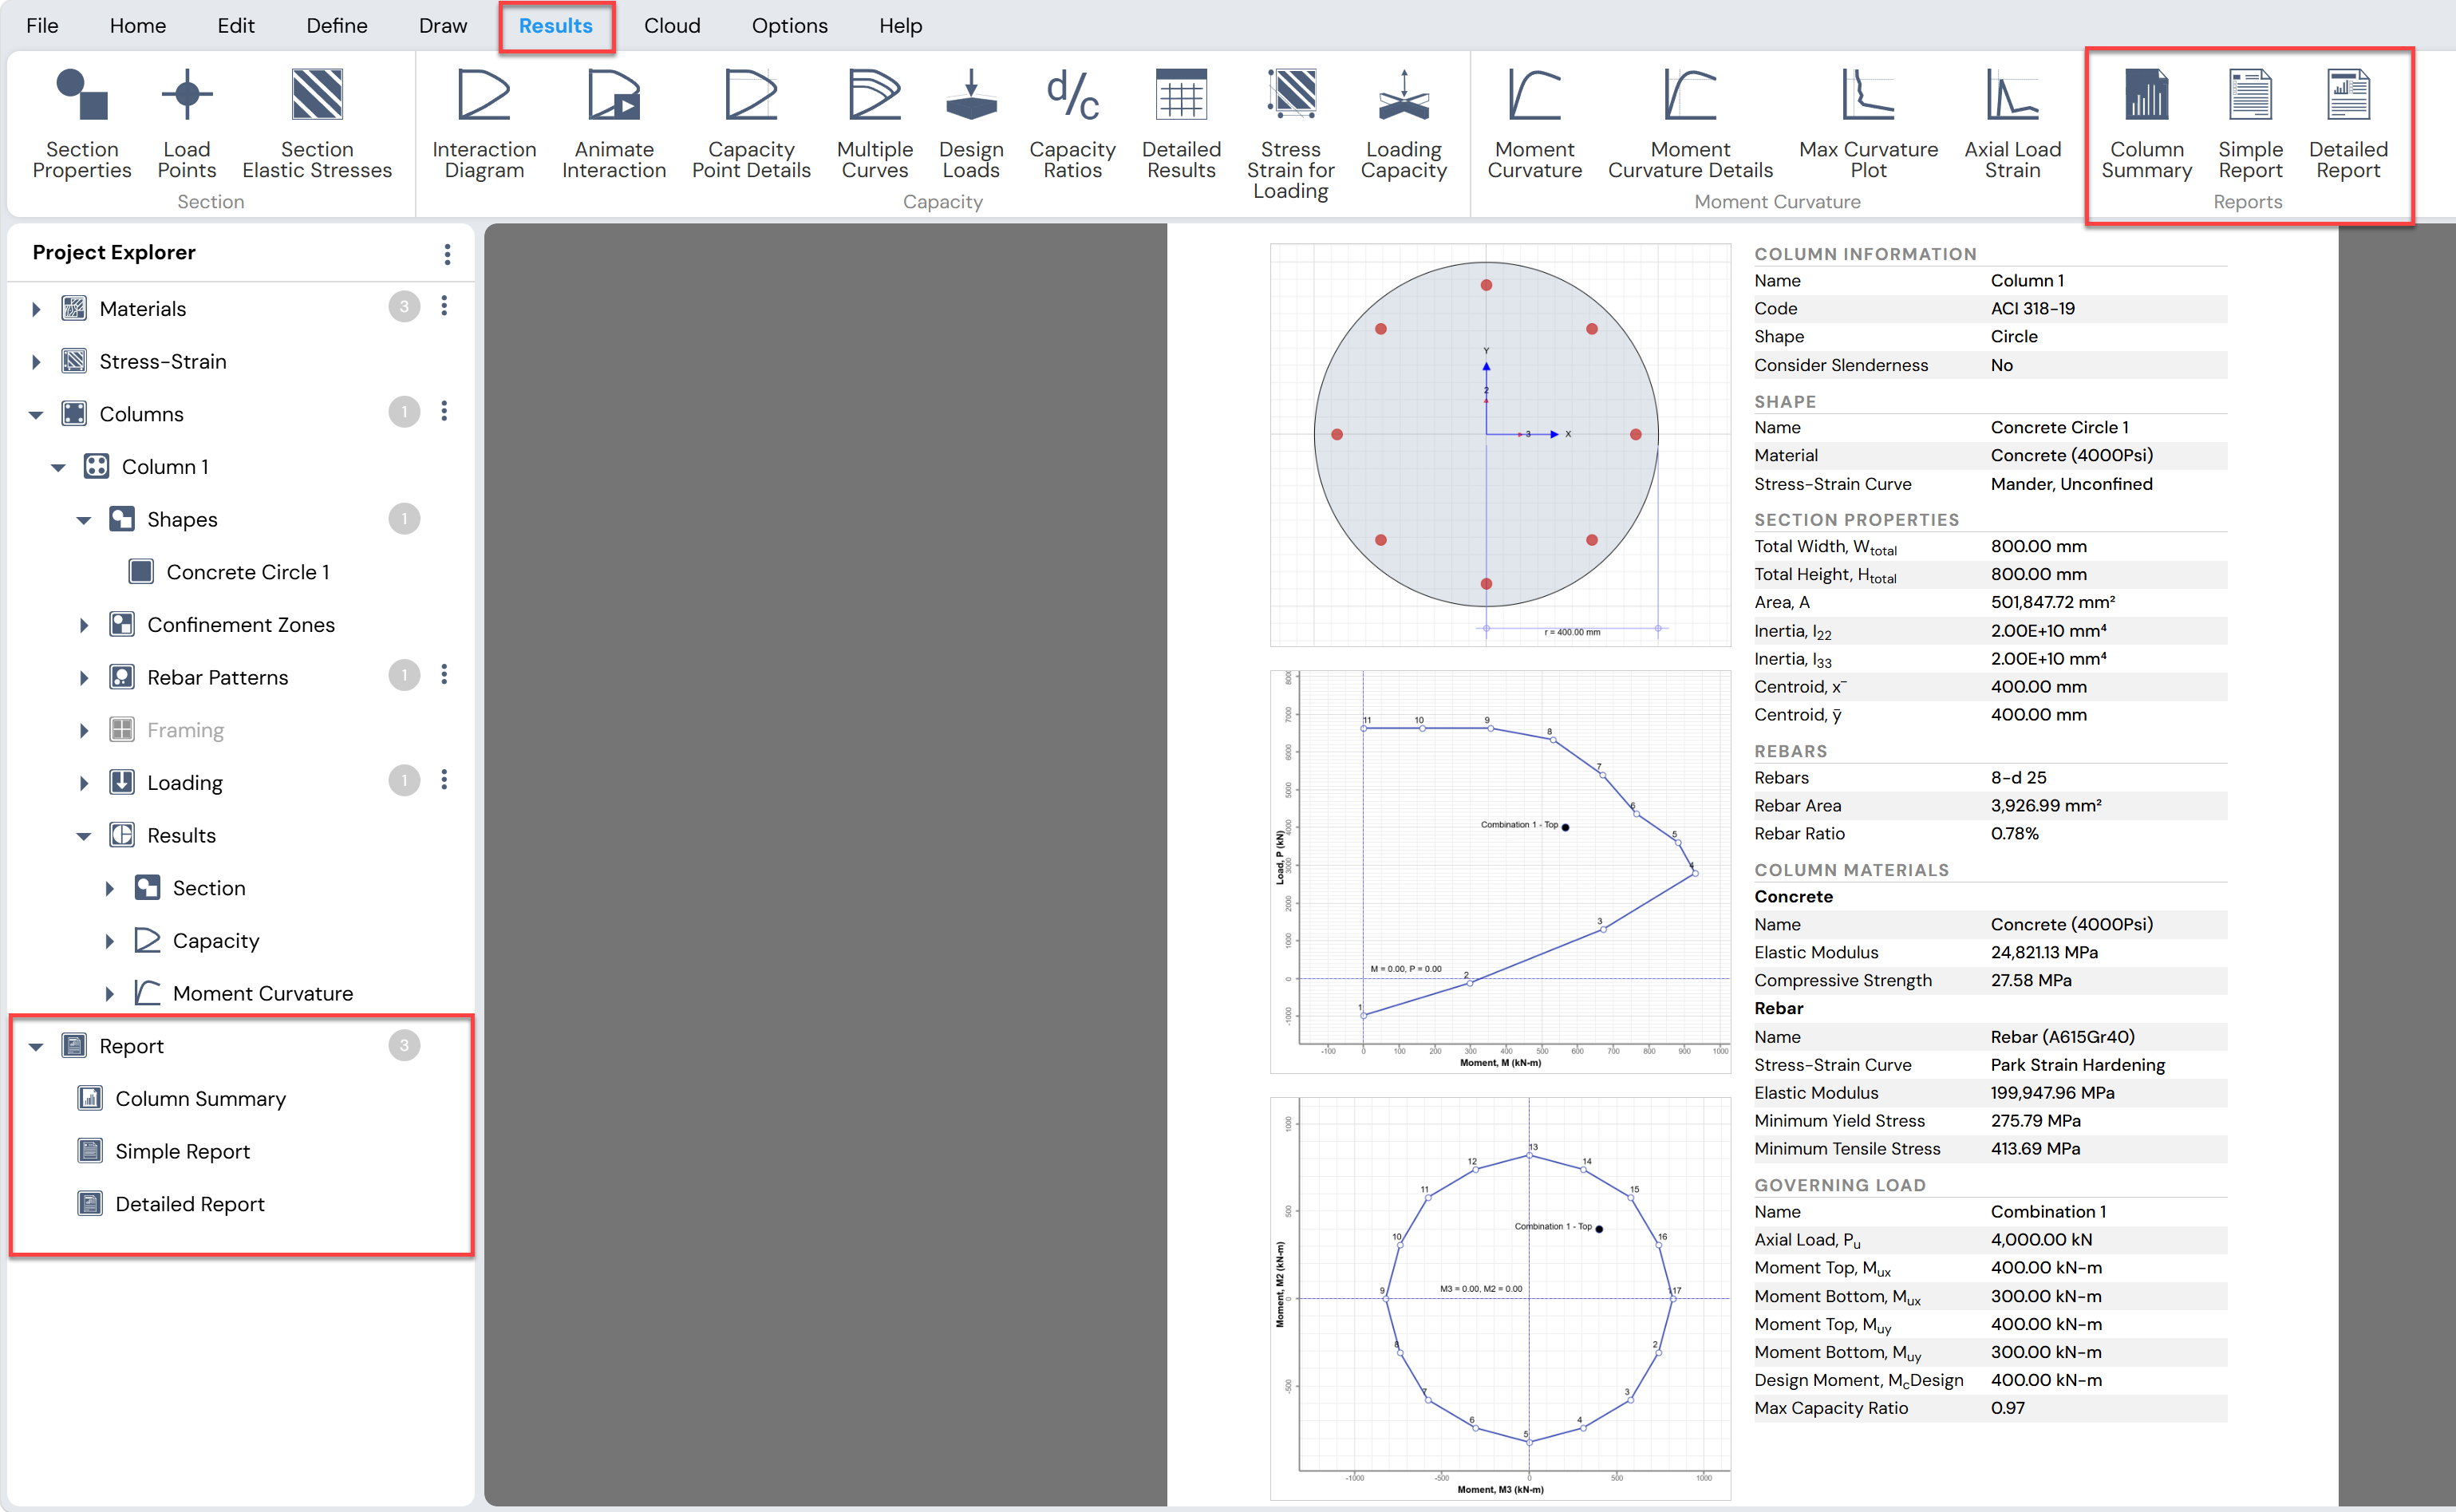
Figure: Various Reports Generated in Column Designer
Rectangular and Circular Models
Use the Rectangular Model or Circular Model button to add a new rectangular or circular column section to the current Project File.
This method provides a quick way to create a standard column section, after which framing, loading, analysis, and design can be completed.
The basic procedure for creating a rectangular or circular column is described below.
Procedure for Creating a Rectangular or Circular Column
1. Create a Column Model
Select one of the following from the File Menu to add a column section to the current Project File:
Rectangular Model, or
Circular Model
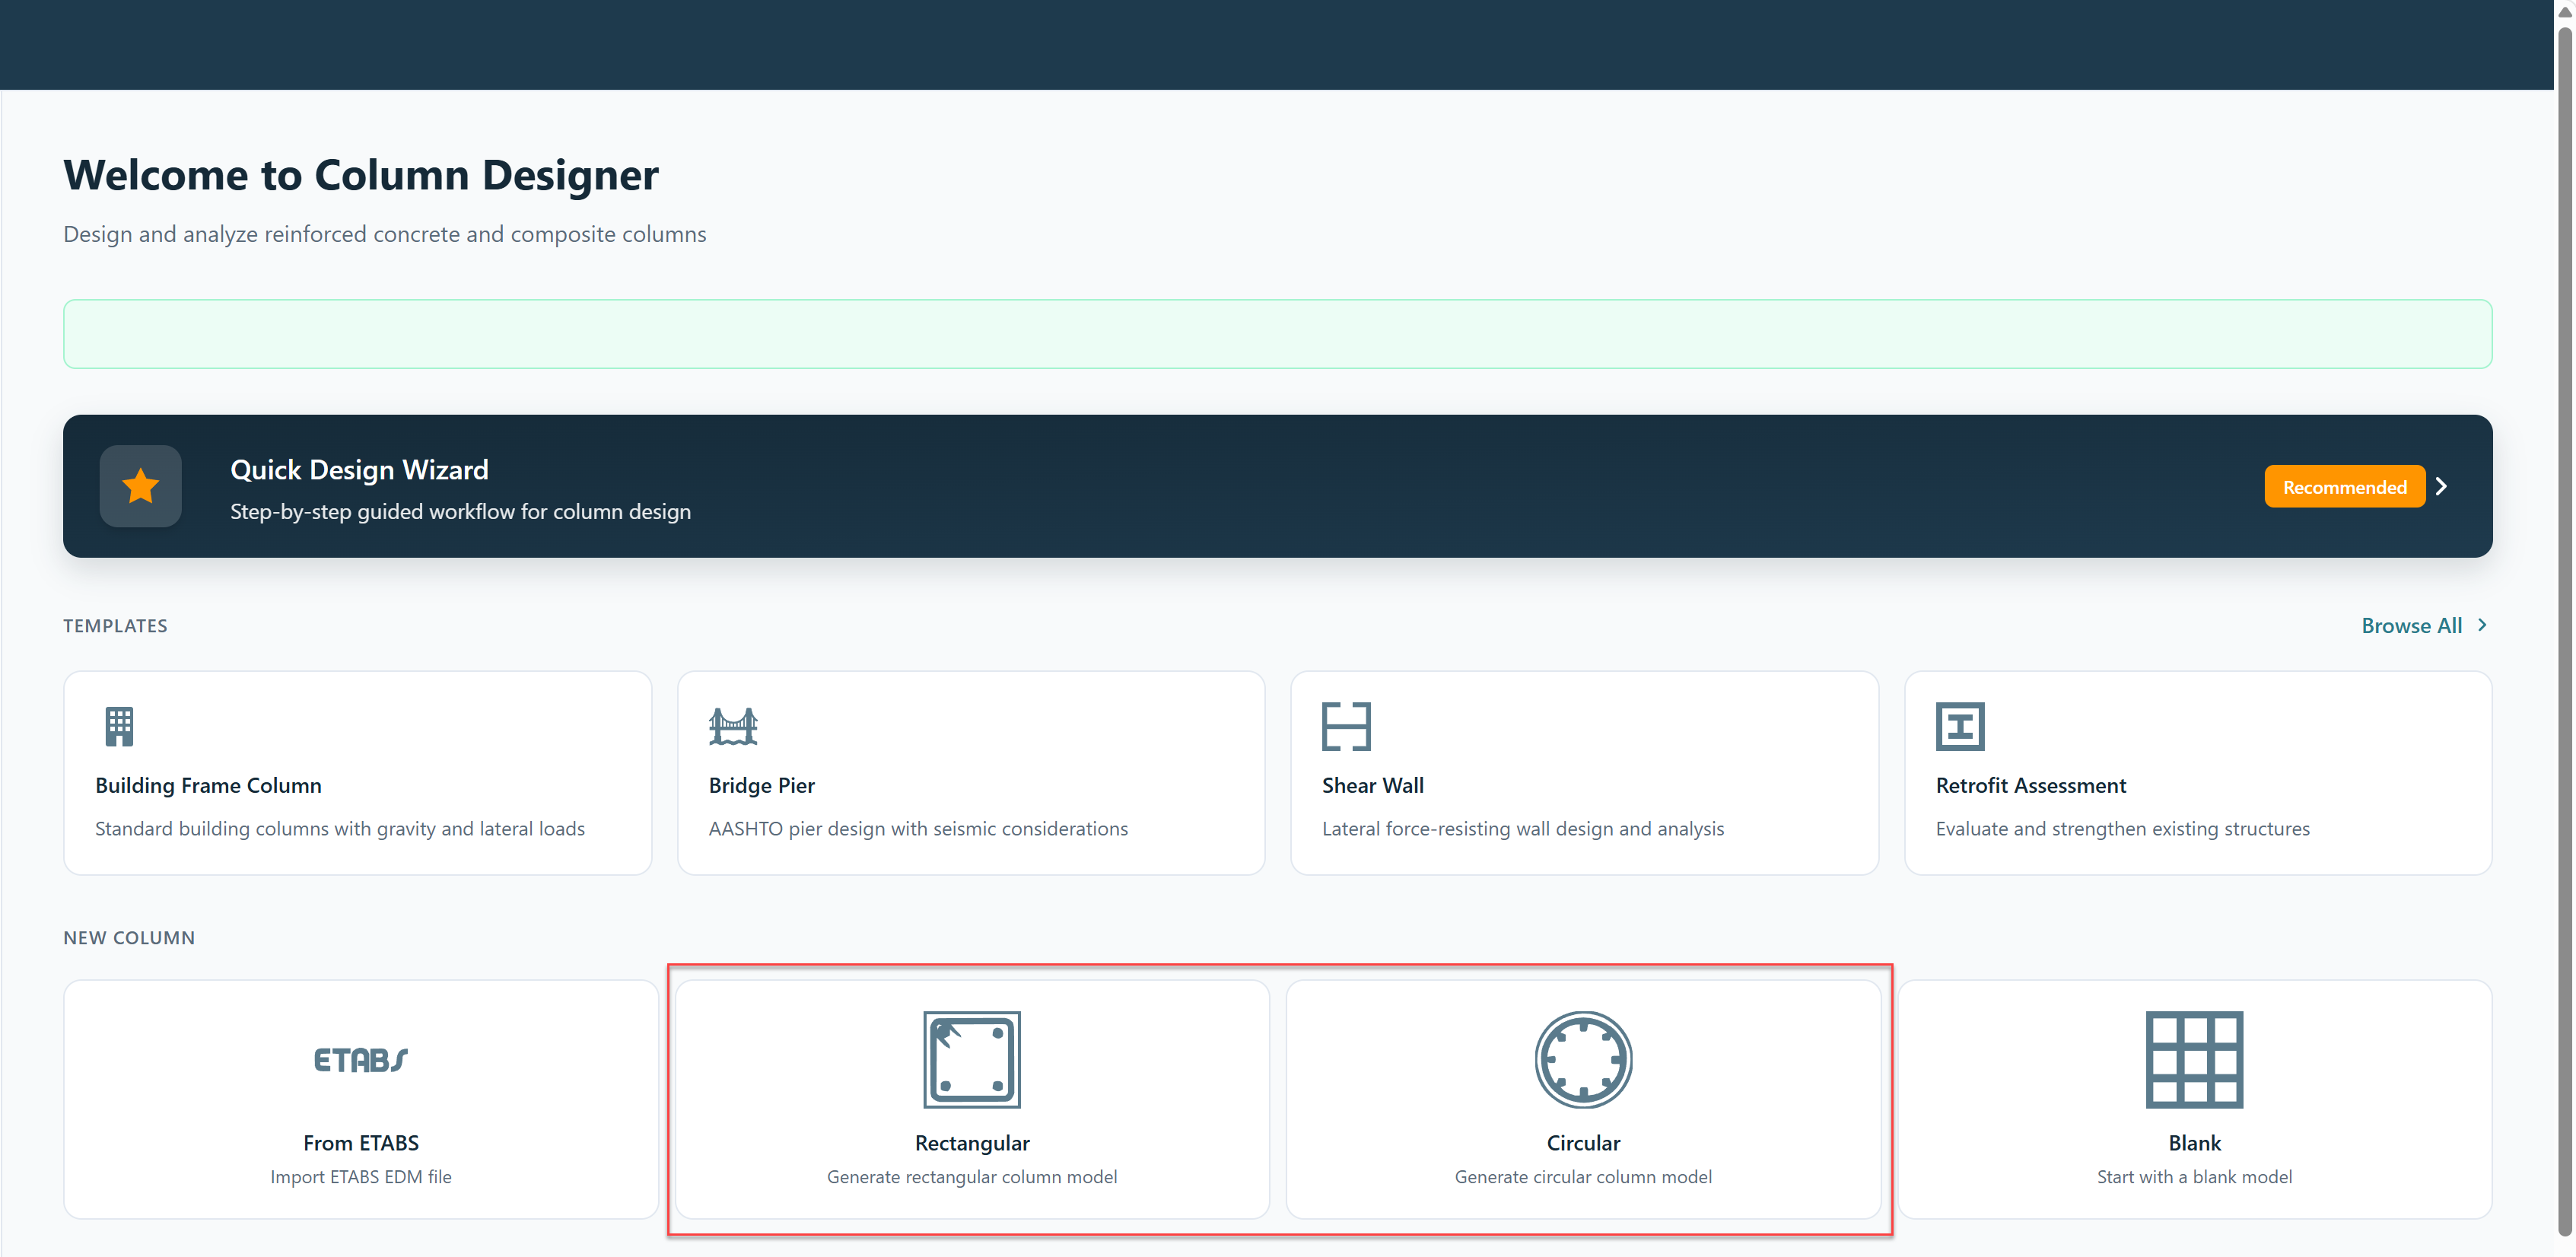
Figure: Creating a Rectangular or Circular Column using Template
2. Set Units and Design Code
By default, Column Designer opens using the last selected working units and design code.
If required, modify these settings using:
o Options Menu → General
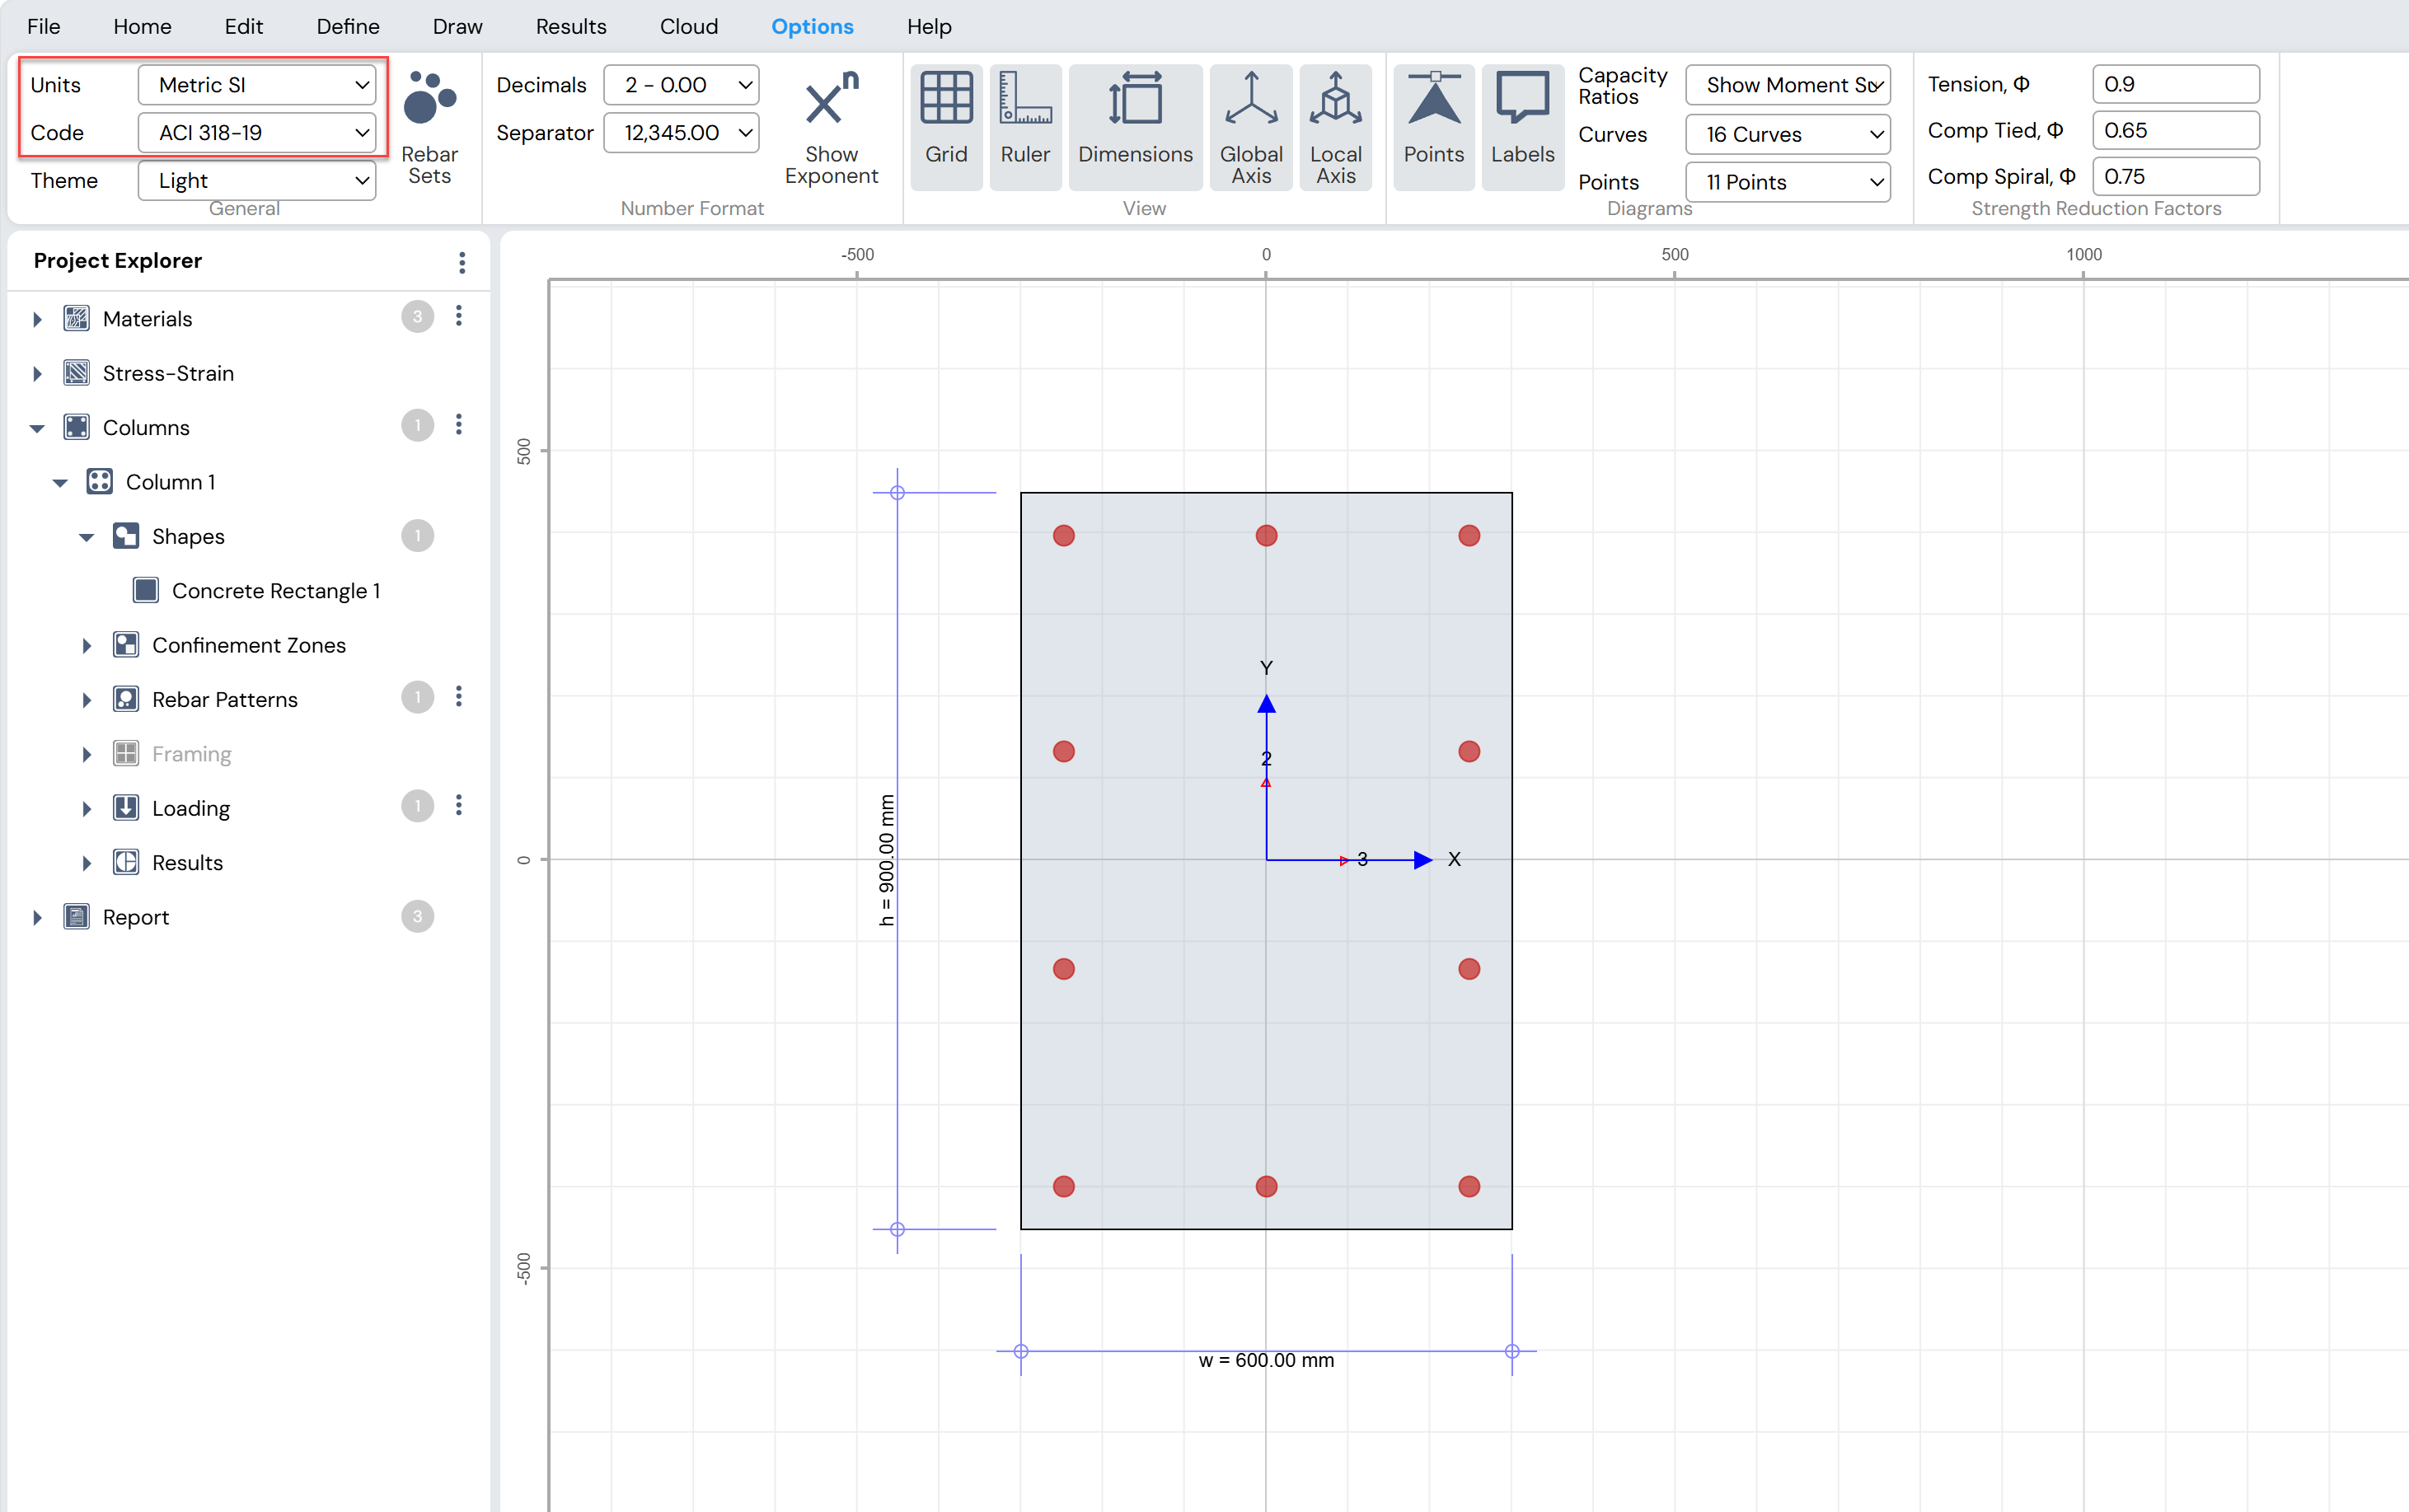
Figure: Setting Units and design Code in for Circular/Rectangular Columns
3. Define Concrete Stress–Strain Model
Use:
o Define Menu → Stress Strain → Concrete, or
o The button next to Project Explorer → Stress-Strain → Concrete
to access the Define Concrete Confinements form and define new confinement models or modify the default one.
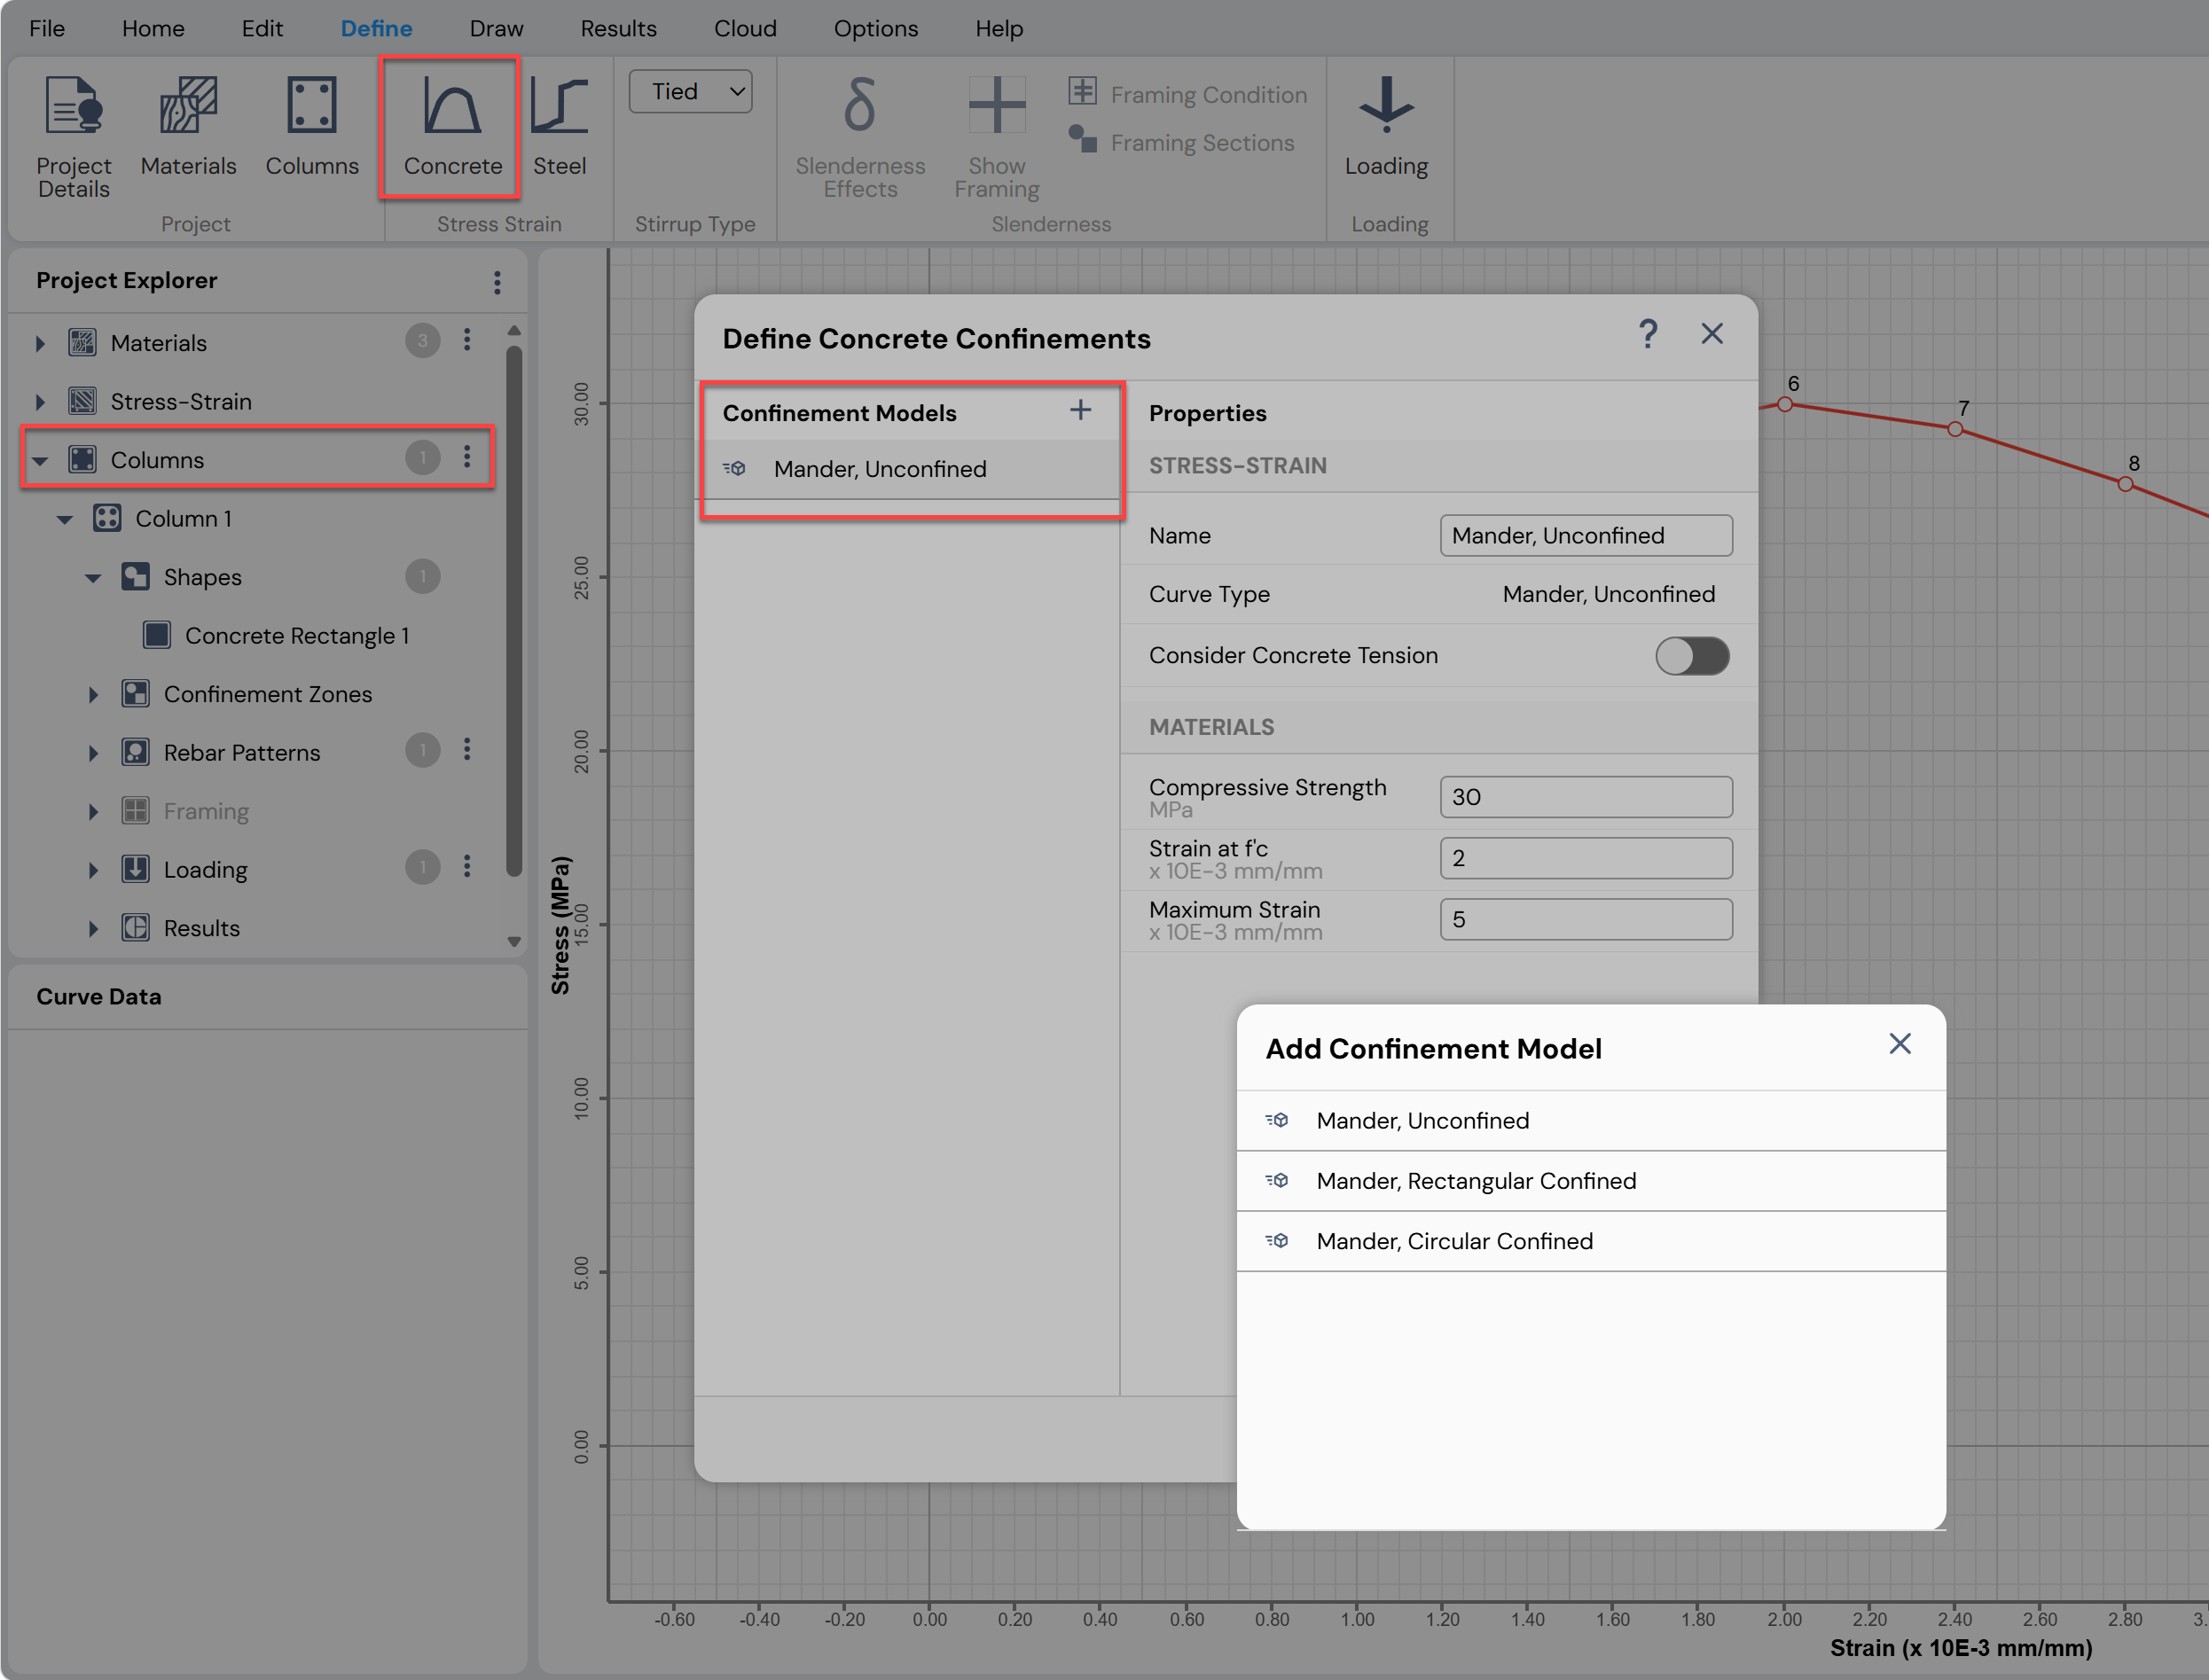
Figure: Defining Concrete Stress-Strain Model for Circular/Rectangular Columns
4. Define Steel Stress–Strain Model
Use:
o Define Menu → Stress Strain → Steel, or
o The button next to Project Explorer → Stress-Strain → Steel
to access the Define Steel Stress–Strain form and define new steel stress–strain models or modify the default one.
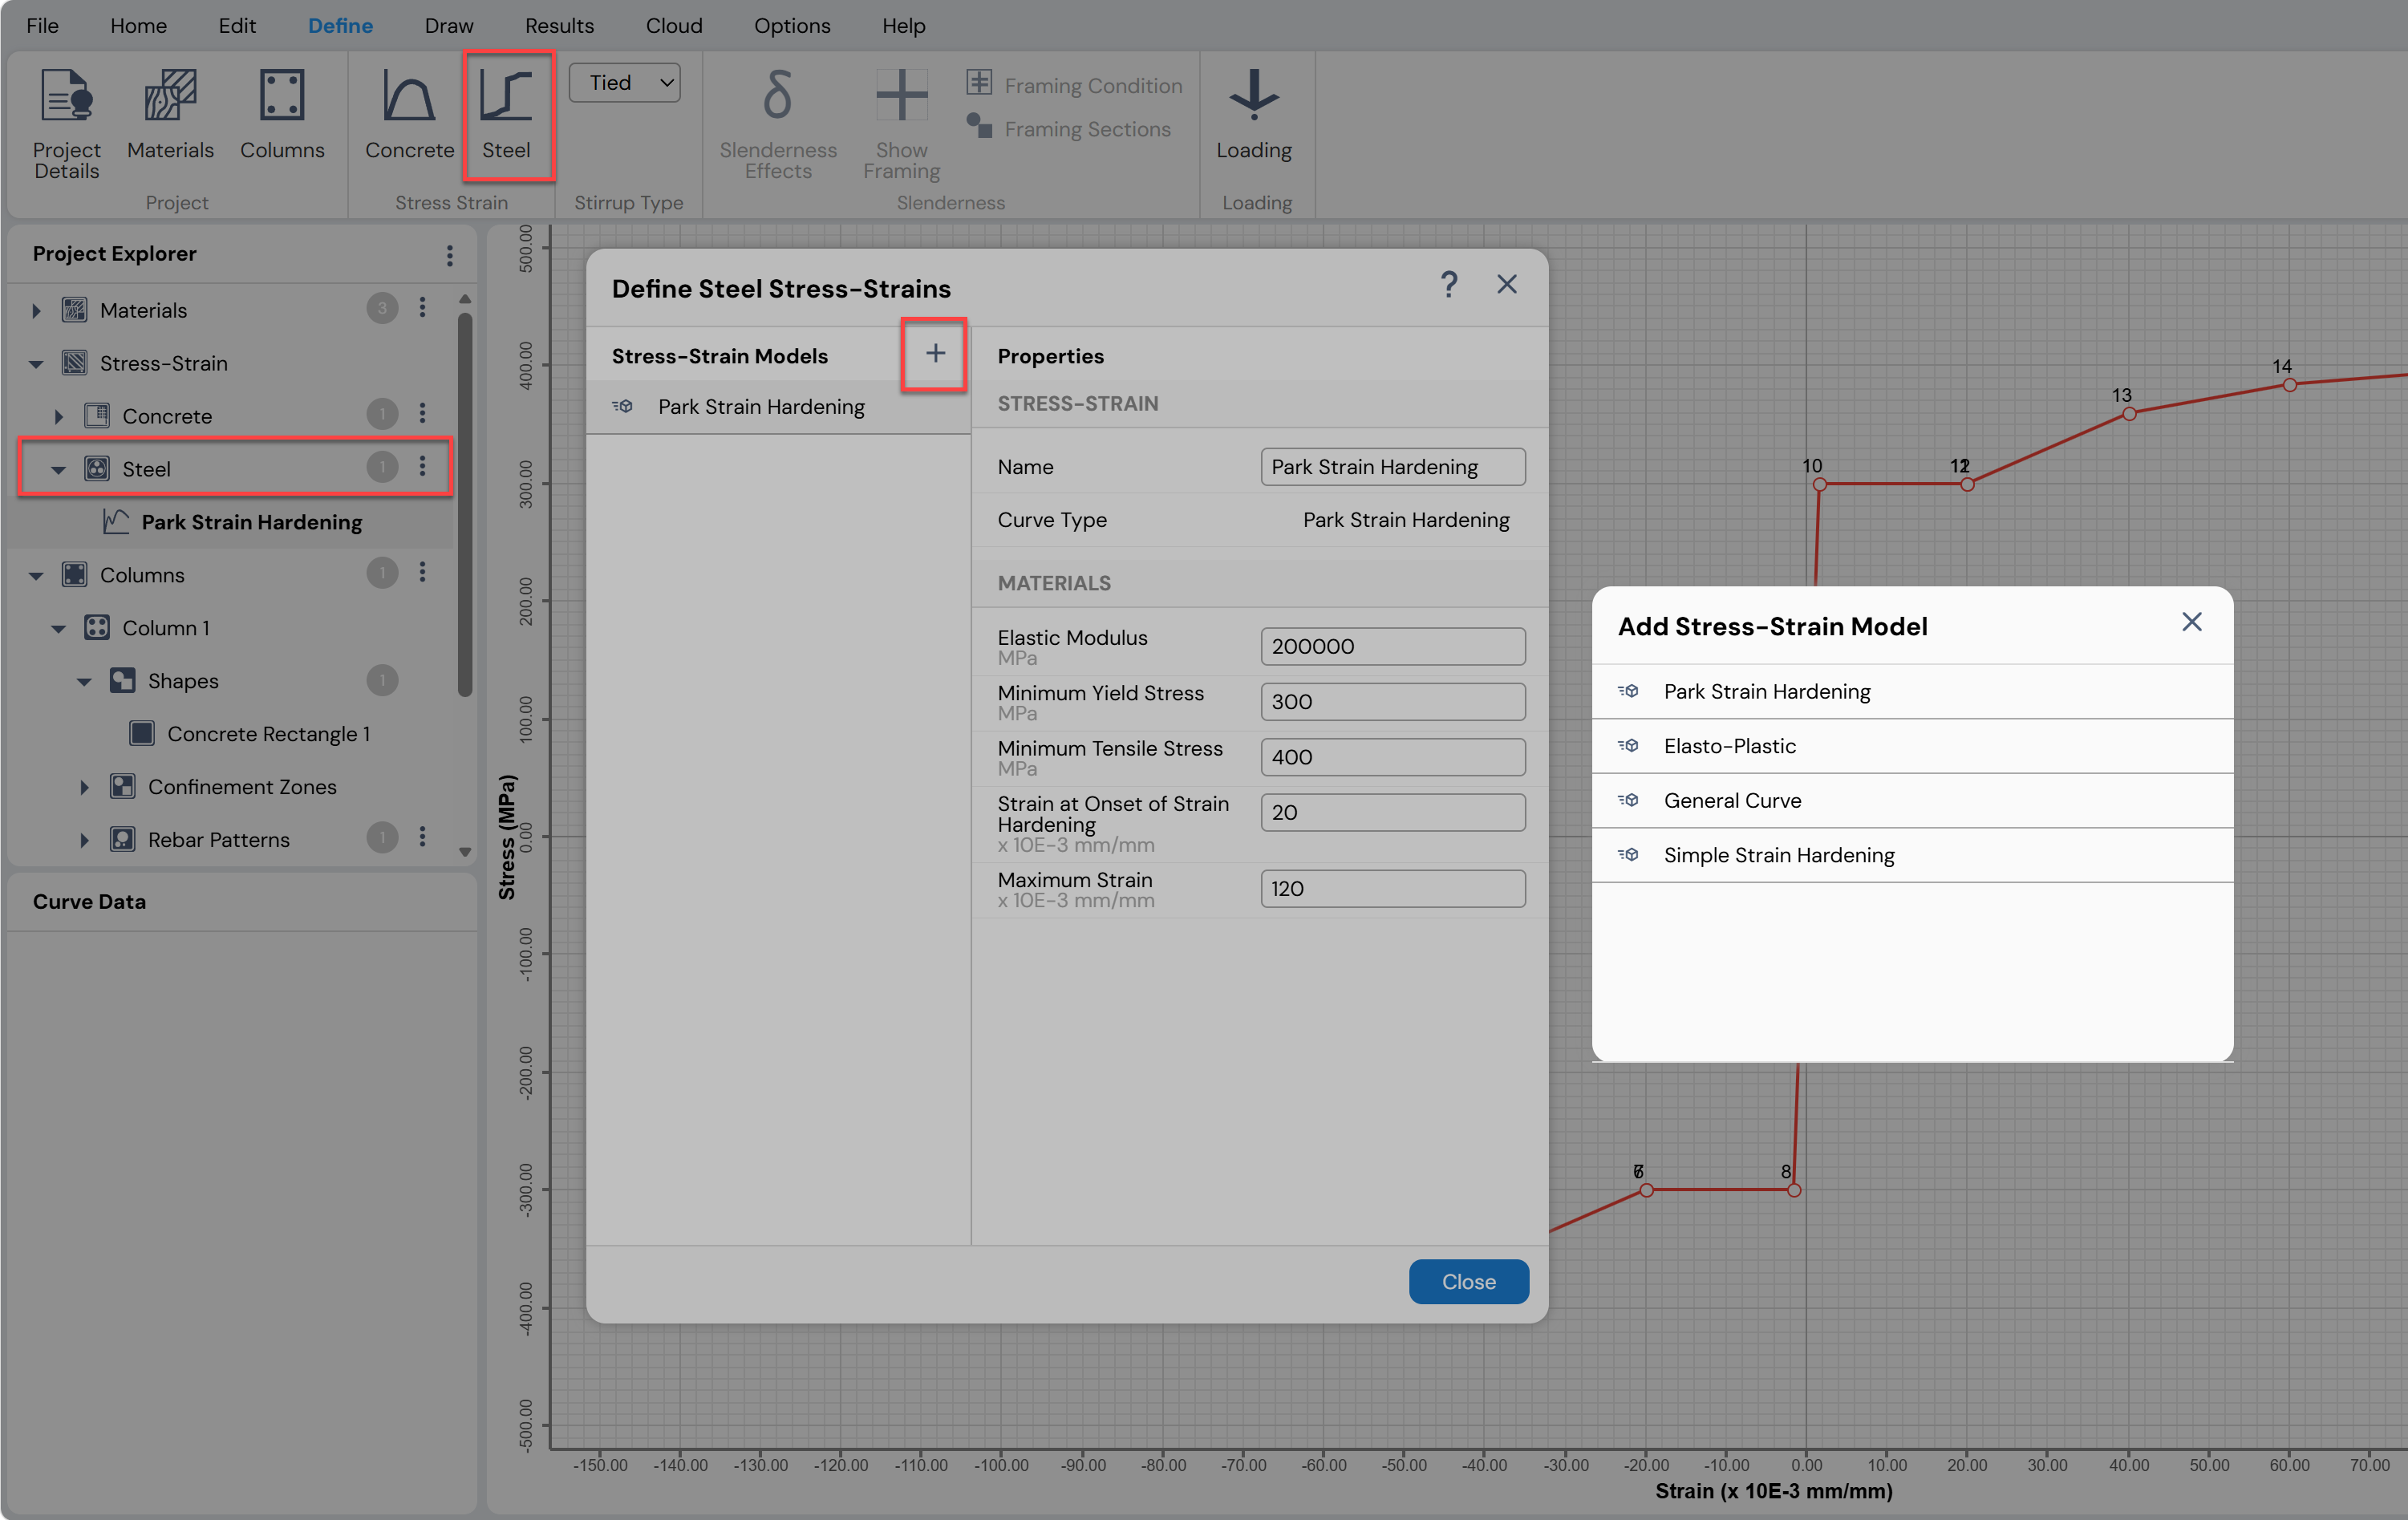
Figure: Defining Steel Stress-Strain Model for Circular/Rectangular Columns
5. Define Material Properties
Use:
o Define Menu → Project → Materials, or
o The button next to Project Explorer → Materials
to access the Material Properties form and define:
o Concrete properties
o Rebar properties
o Steel properties
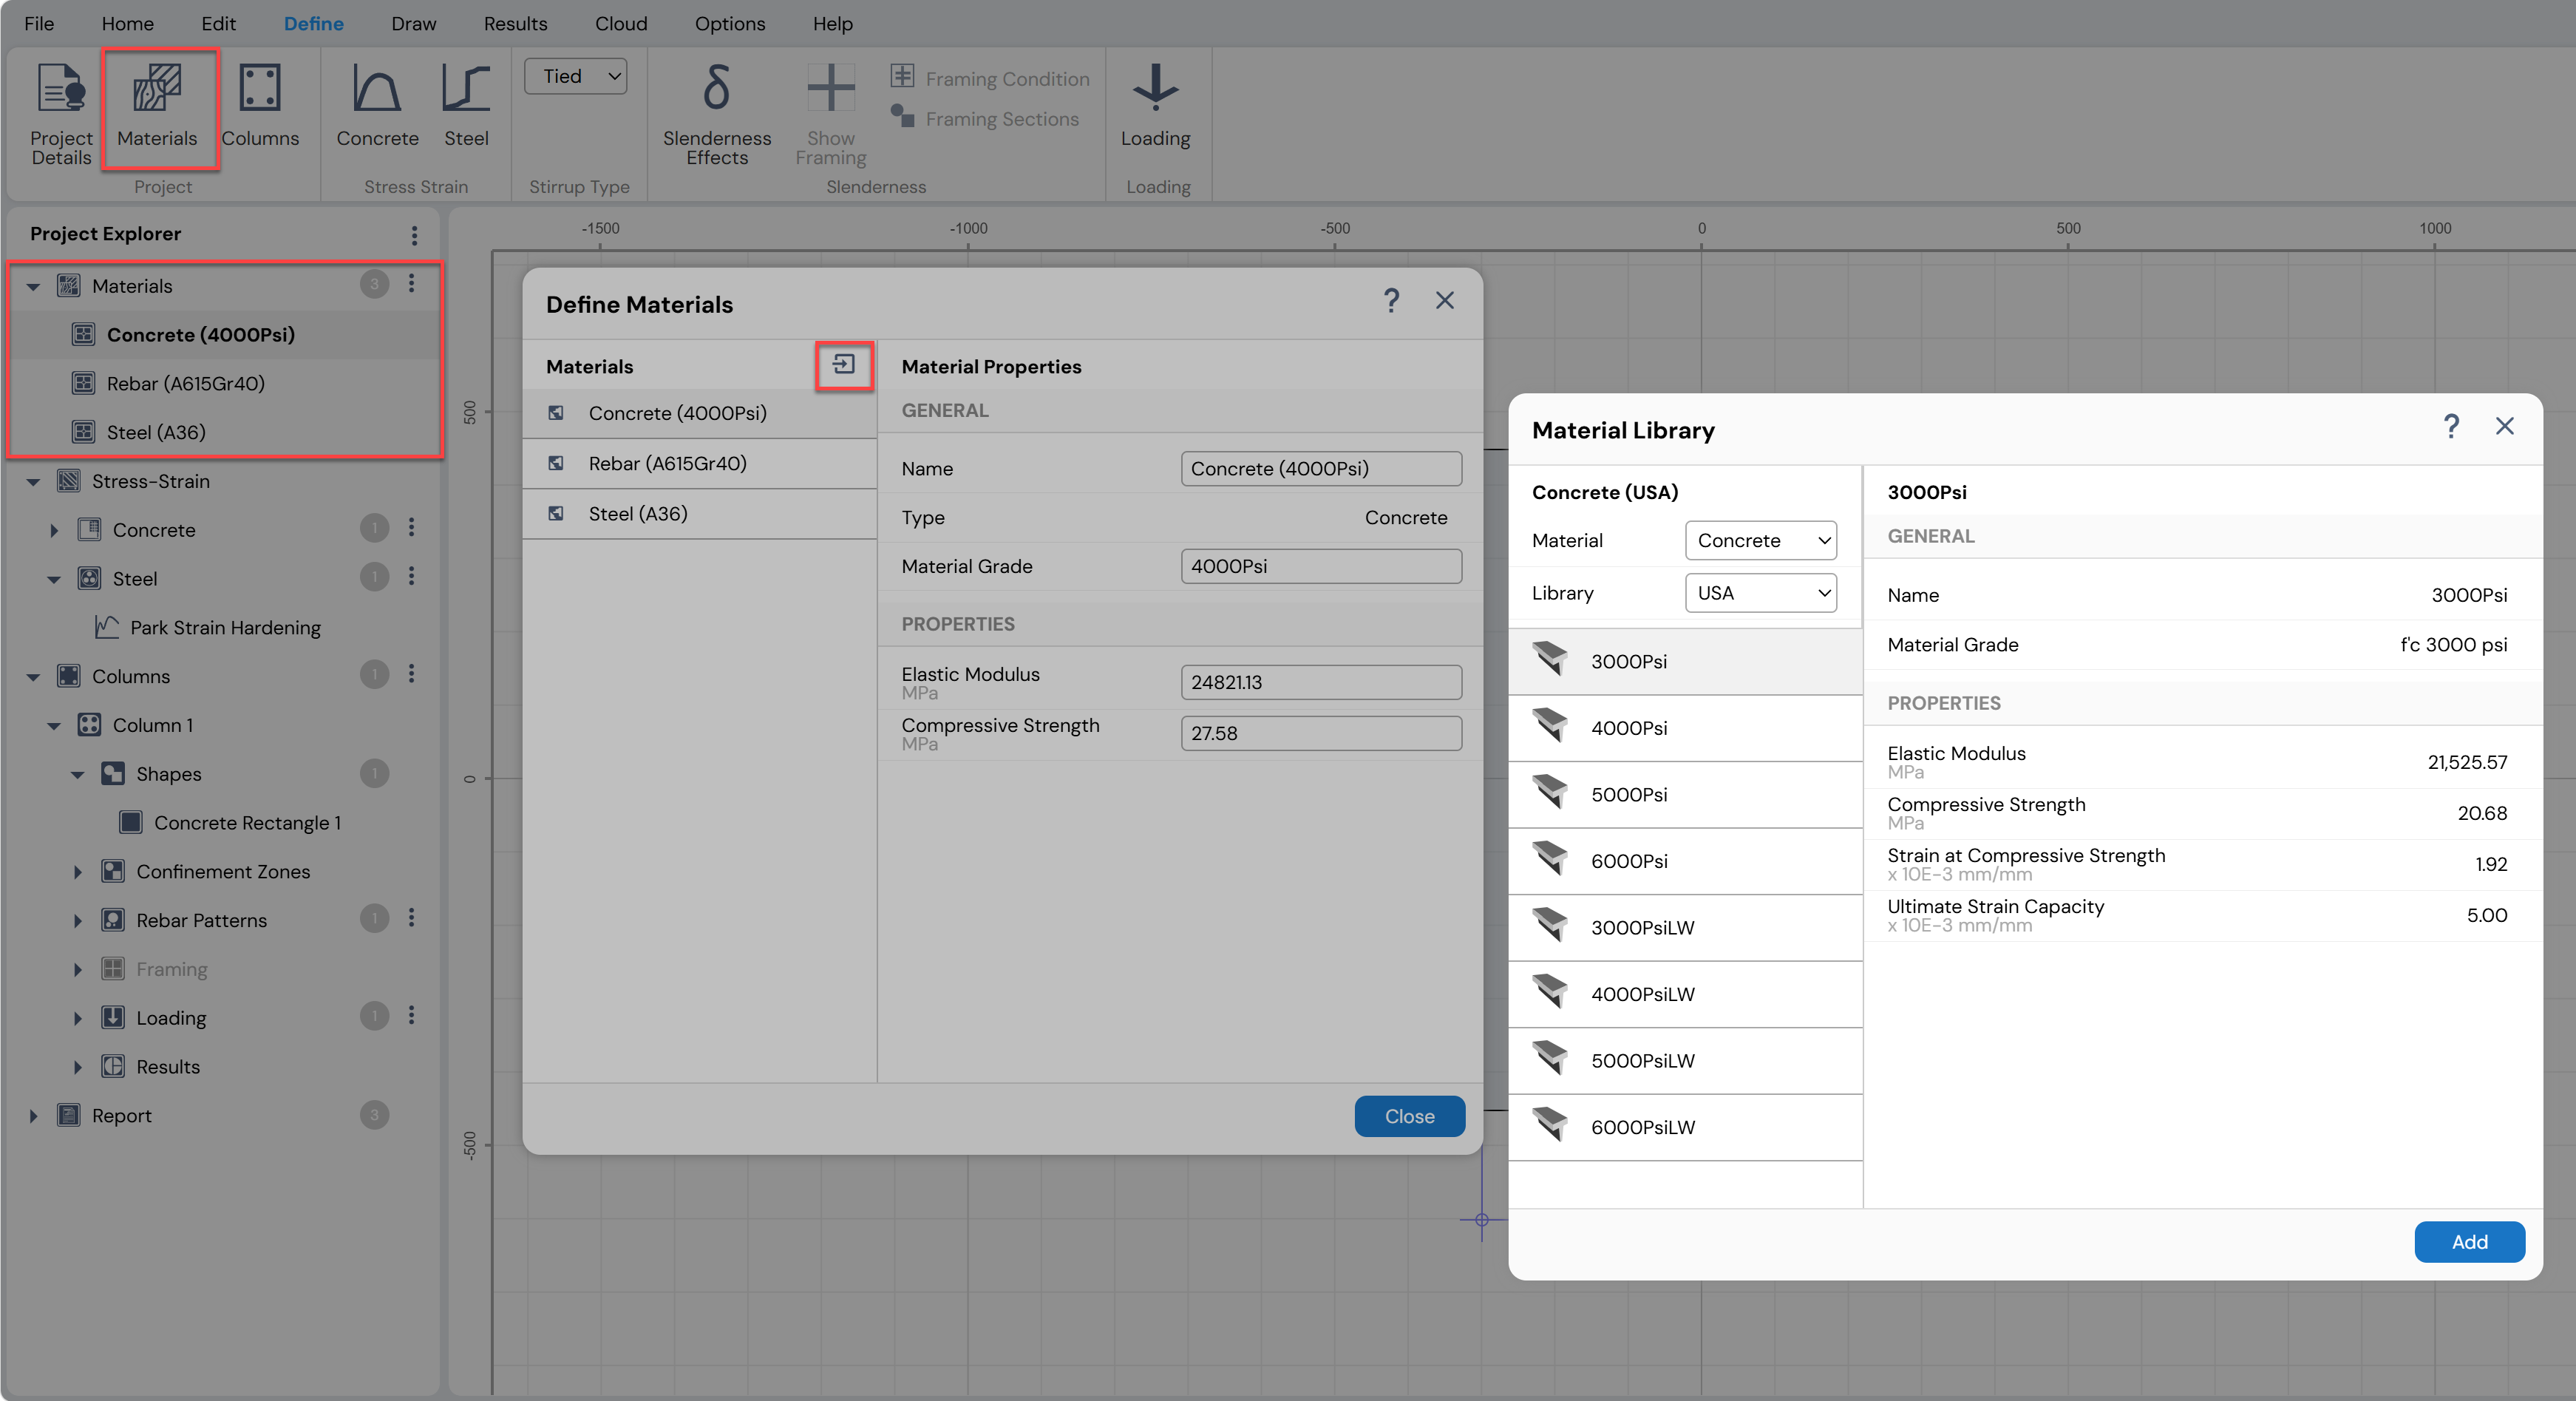
Figure: Defining Material Properties for Circular/Rectangular Columns
6. Edit Shape and Rebar Properties (if required)
Click on the column shape or reinforcement to activate the Property Grid and edit dimensions or other properties numerically.
o The Property Grid for concrete and steel shapes includes a Stress–Strain tab
o Assigned stress–strain models can be viewed and modified if necessary
o The Property Grid can also be accessed by selecting the shape or rebar from Project Explorer → Columns view
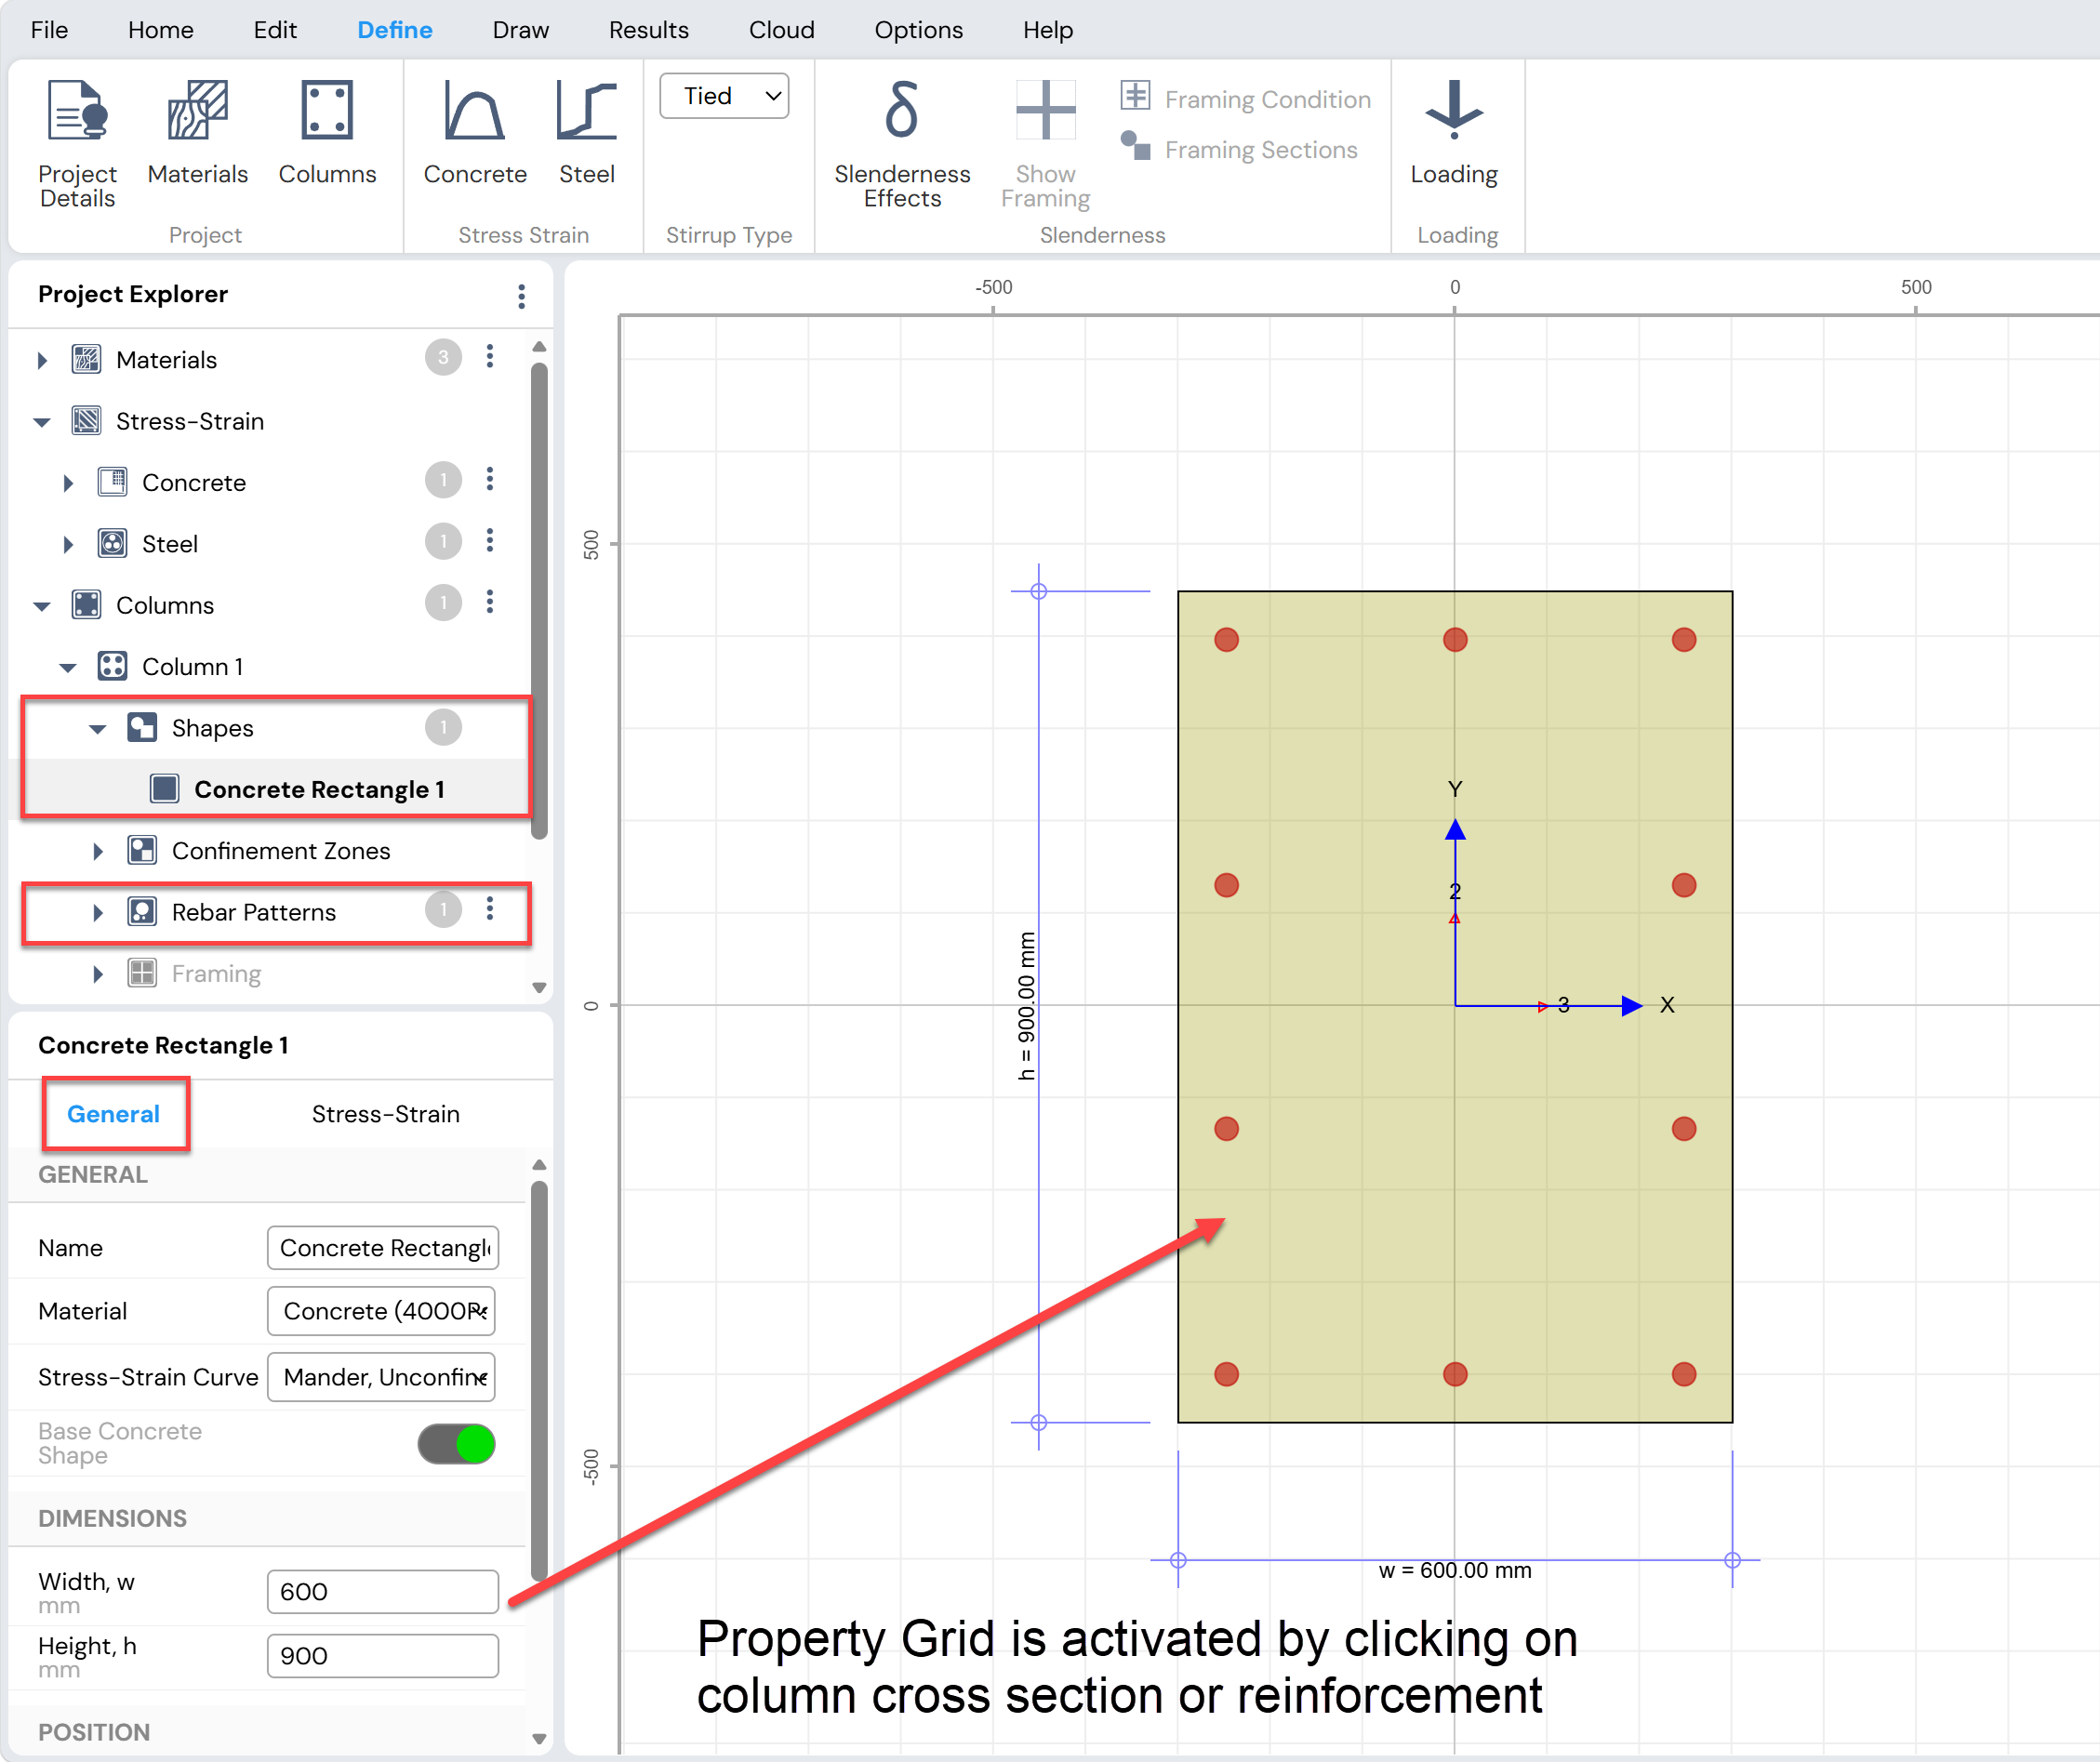
Figure: Editing Shape/Rebars General Options for Circular/Rectangular Columns
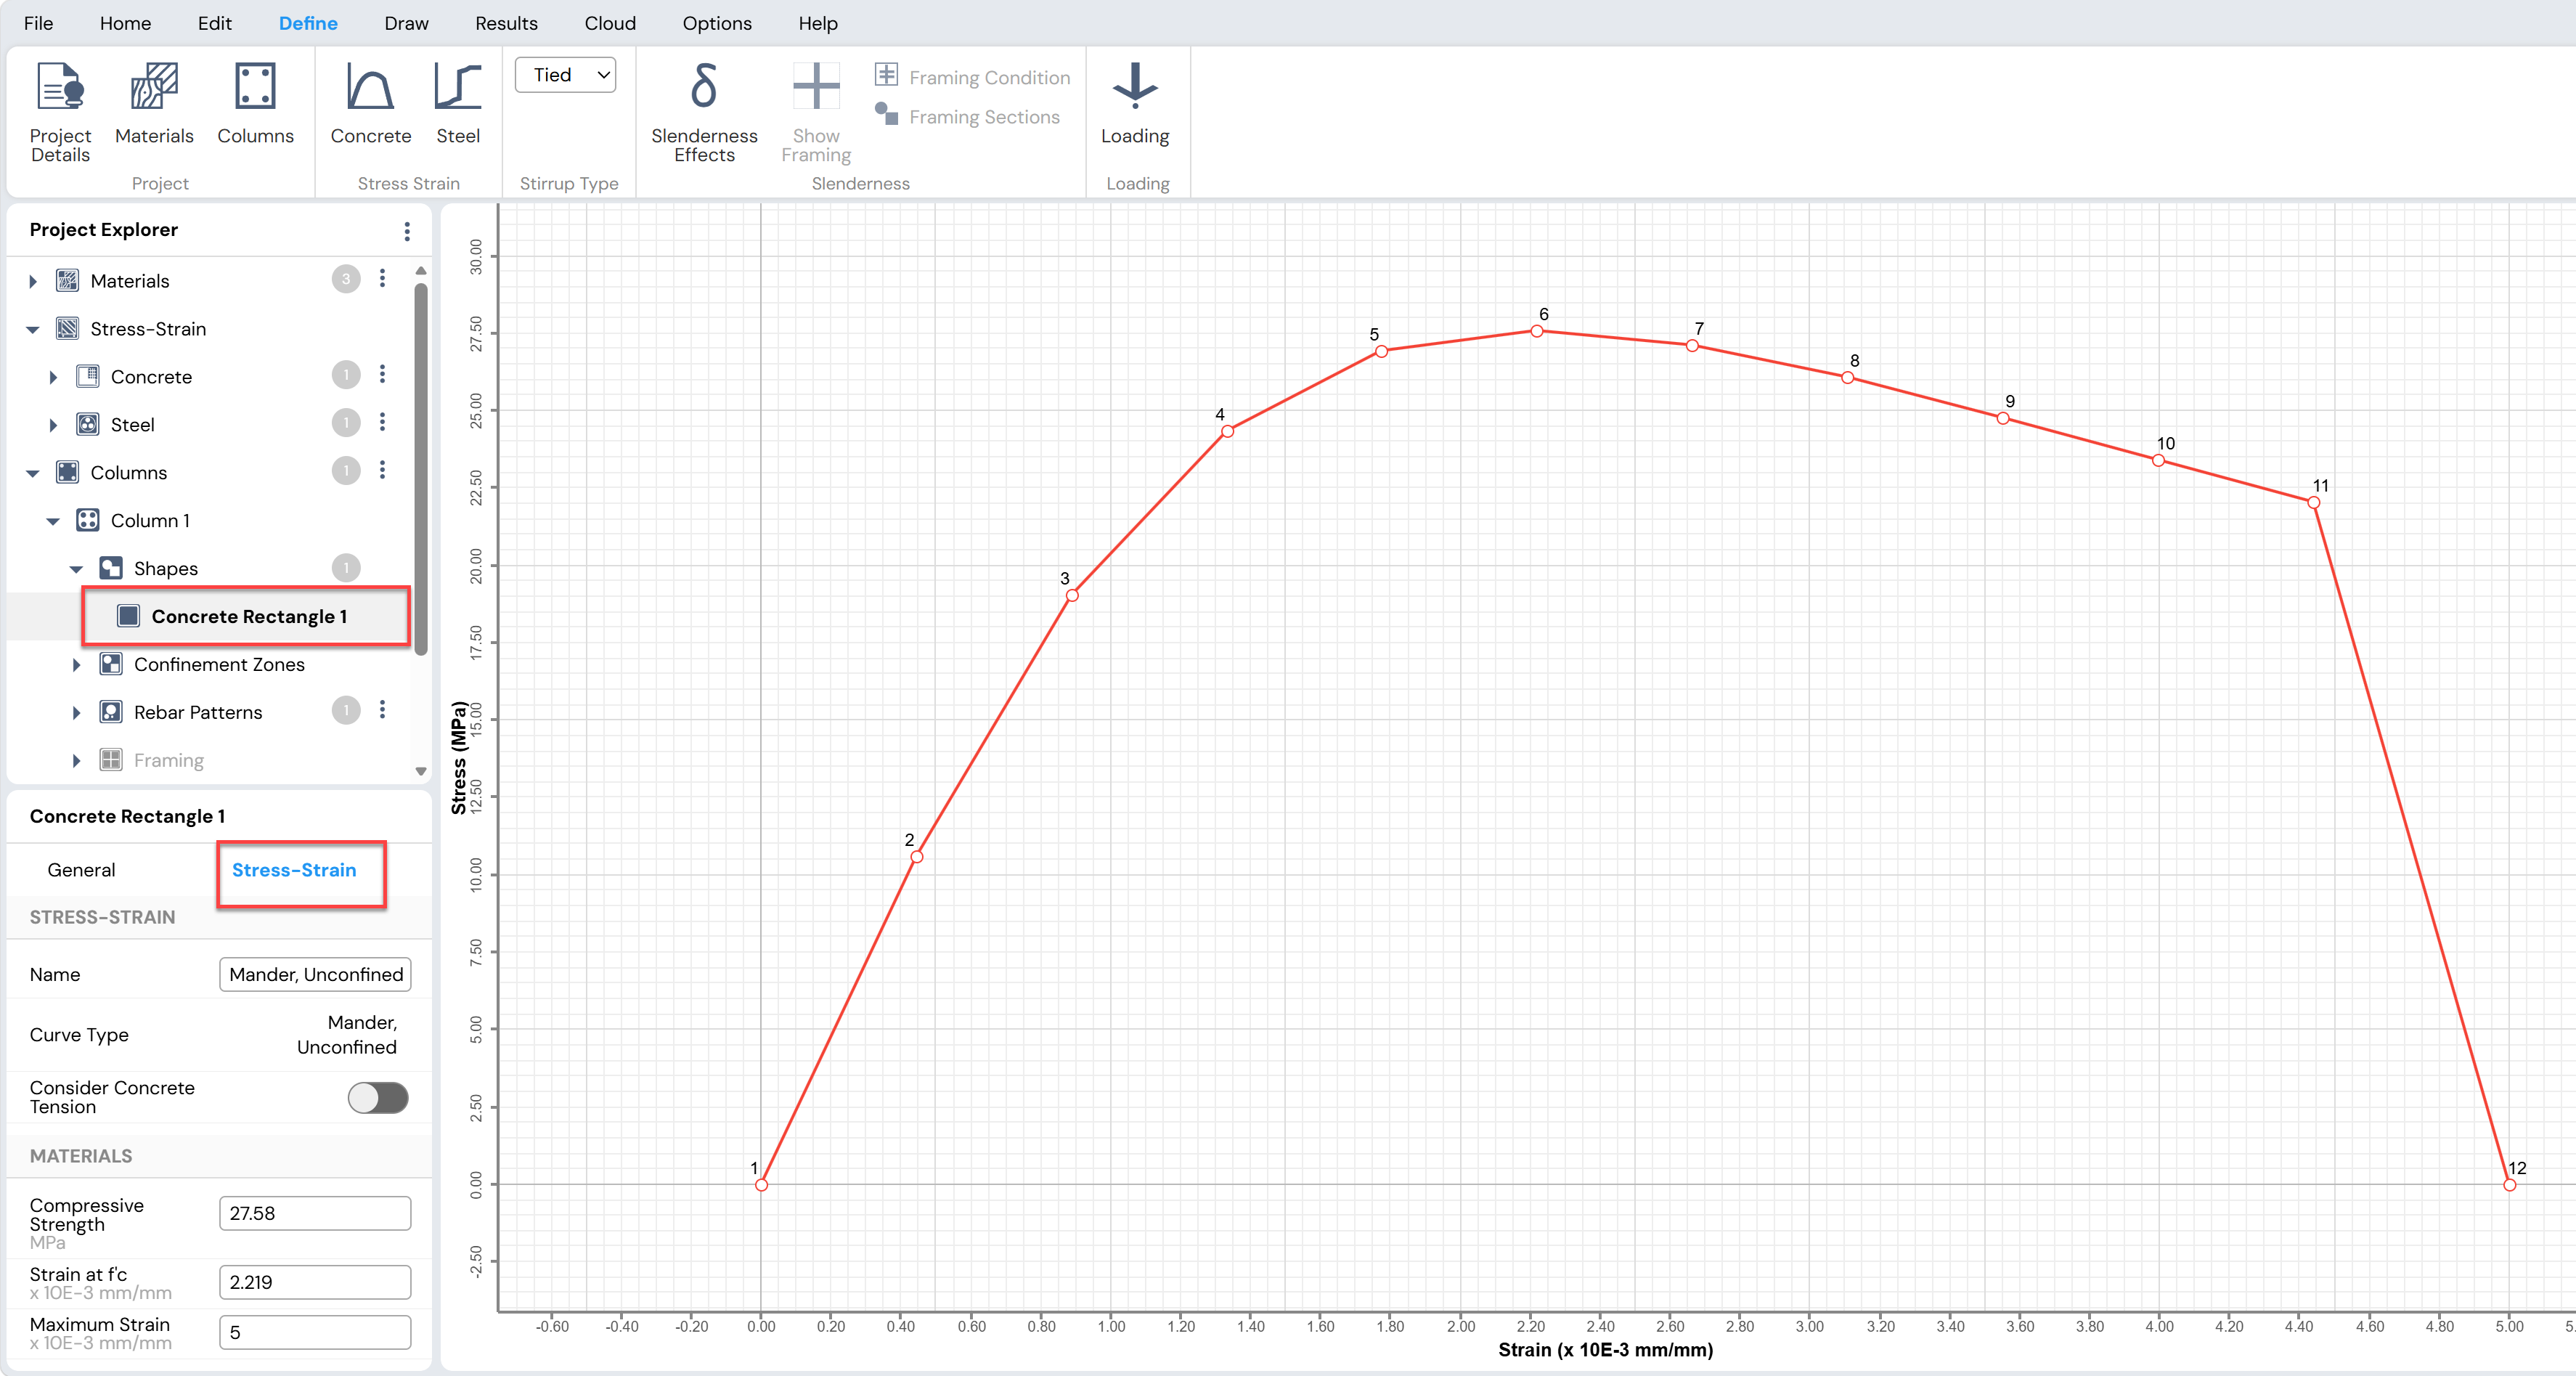
Figure: Editing Stress-Strain Model and Materials Properties for Circular/Rectangular Columns
7. Enable Slenderness Effects (if applicable)
If the column is slender, click:
o Define Menu → Slenderness → Slenderness Effects
If the column is not slender, skip this step and Step 8.
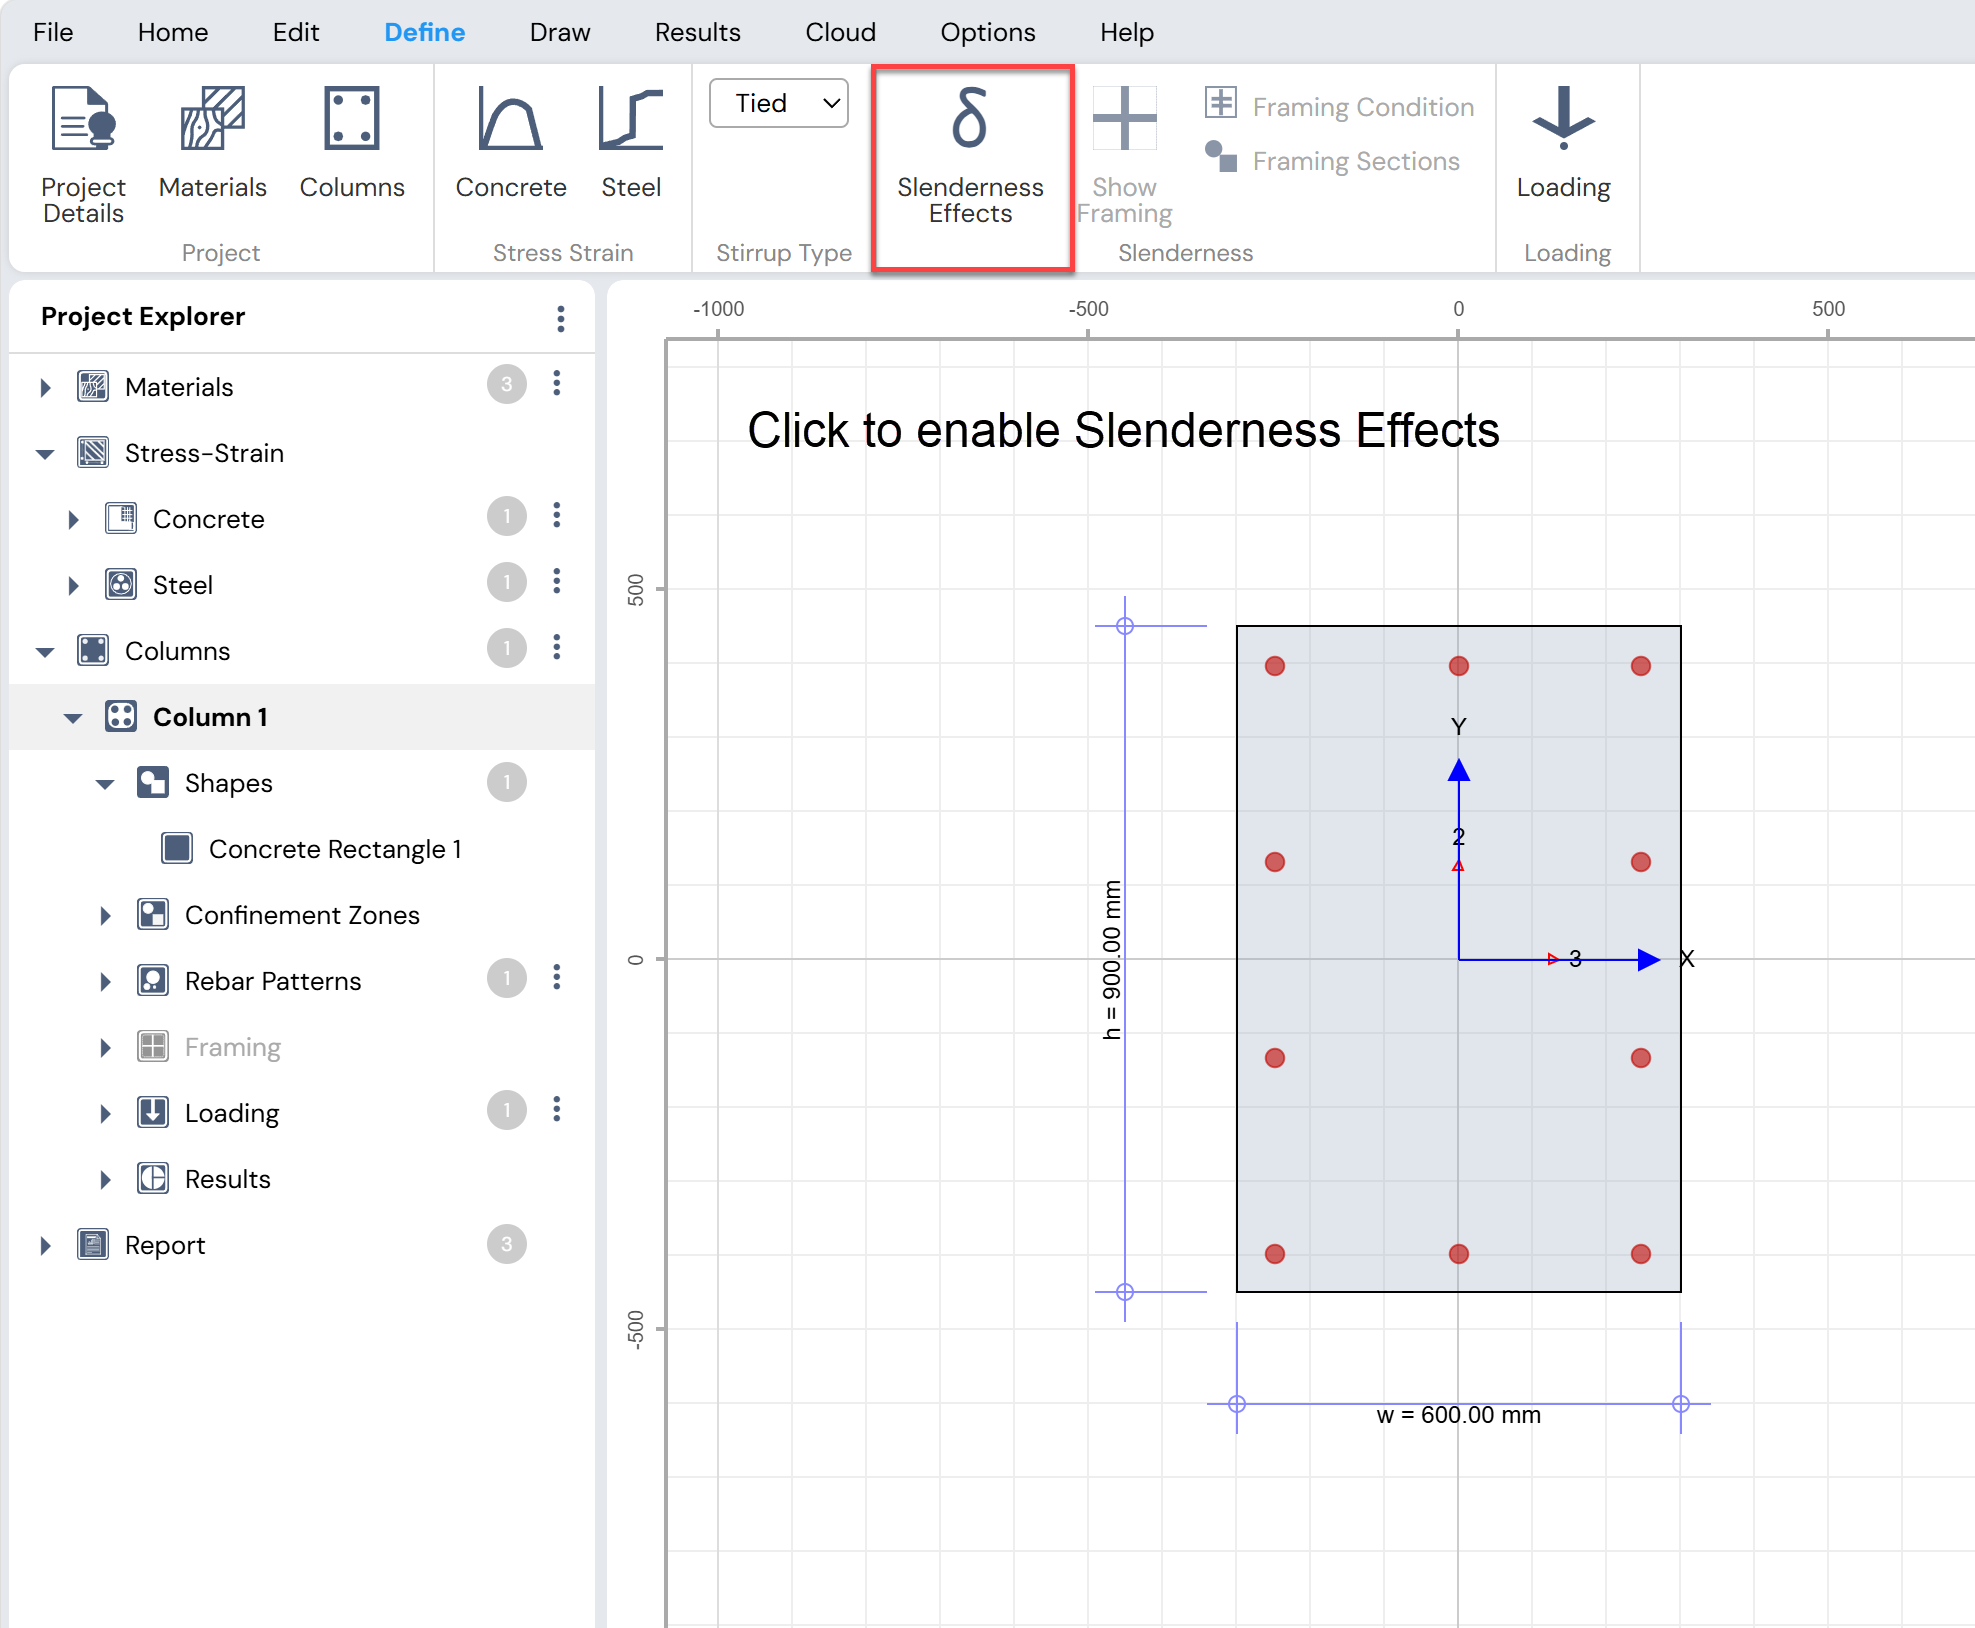
Figure: Enabling Slenderness Effect
8. Define Framing Conditions (for Slender Columns)
If slenderness effects are enabled, define the framing scenario using:
o Define Menu → Slenderness → Framing Condition, or
o The button next to Project Explorer → Columns → Framing → Conditions
Note:
This option is available only when slenderness effects are being considered.
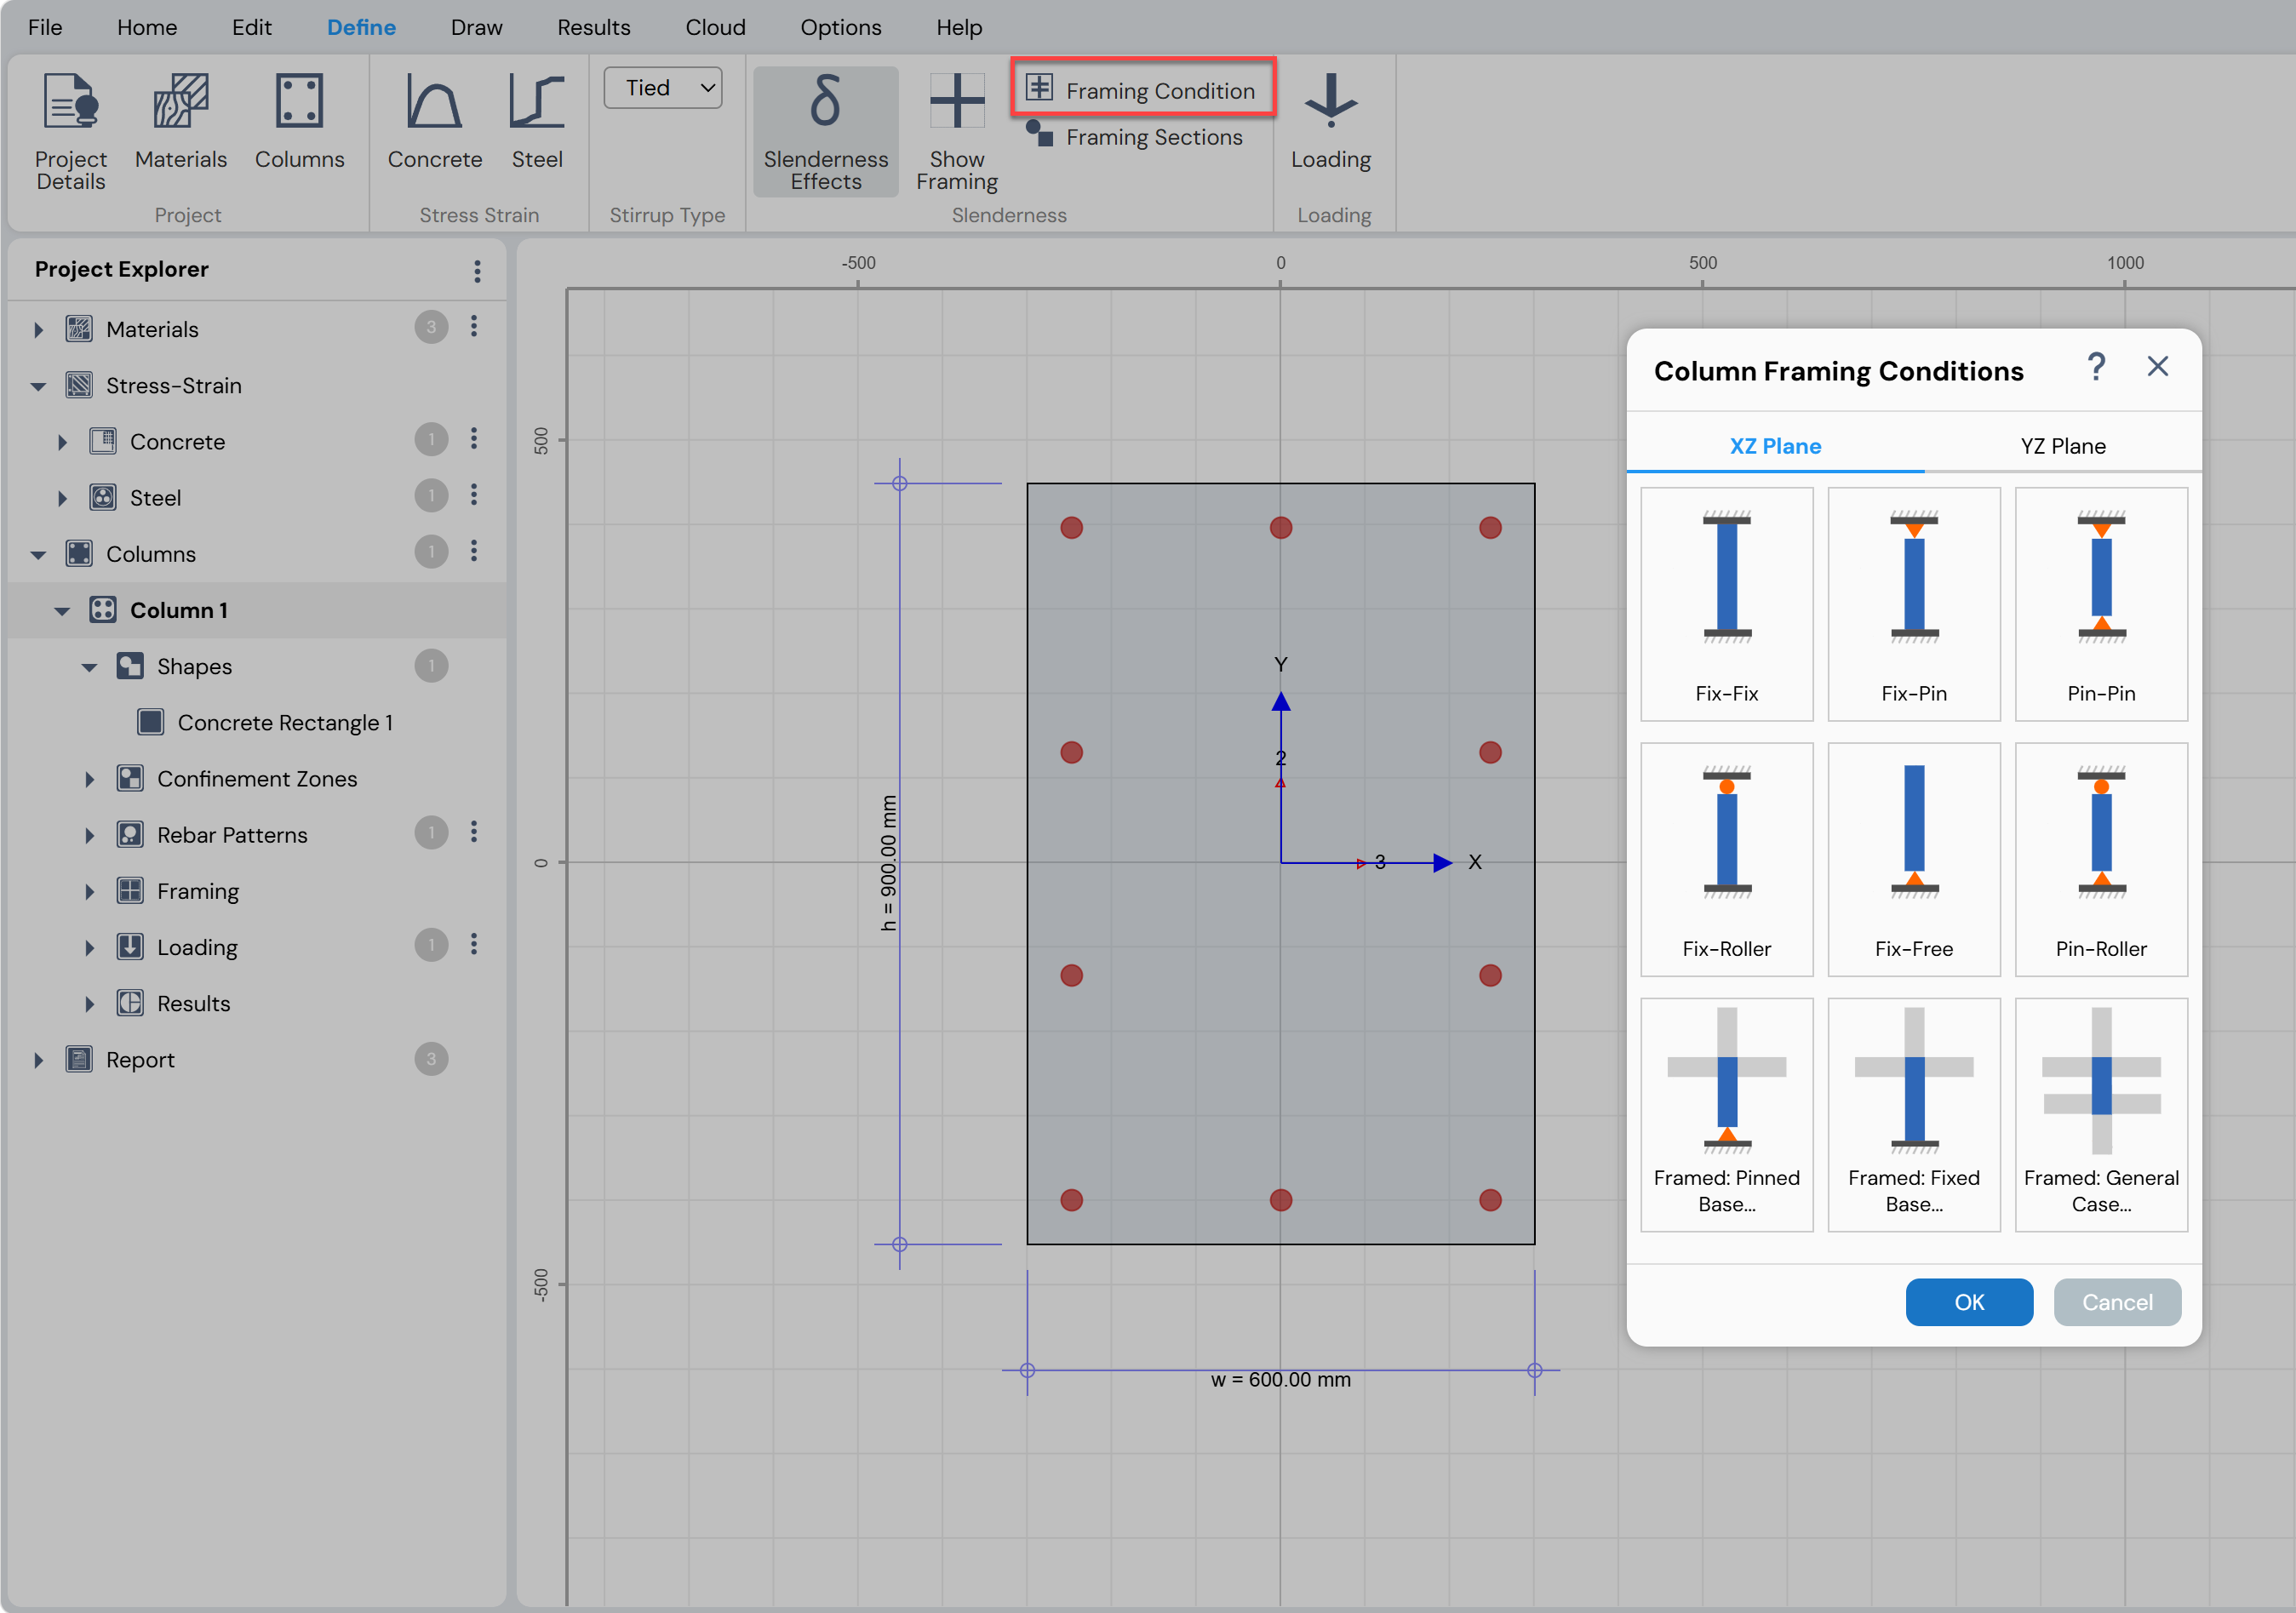
Figure: Framing Conditions for Slender Columns in Column Designer.
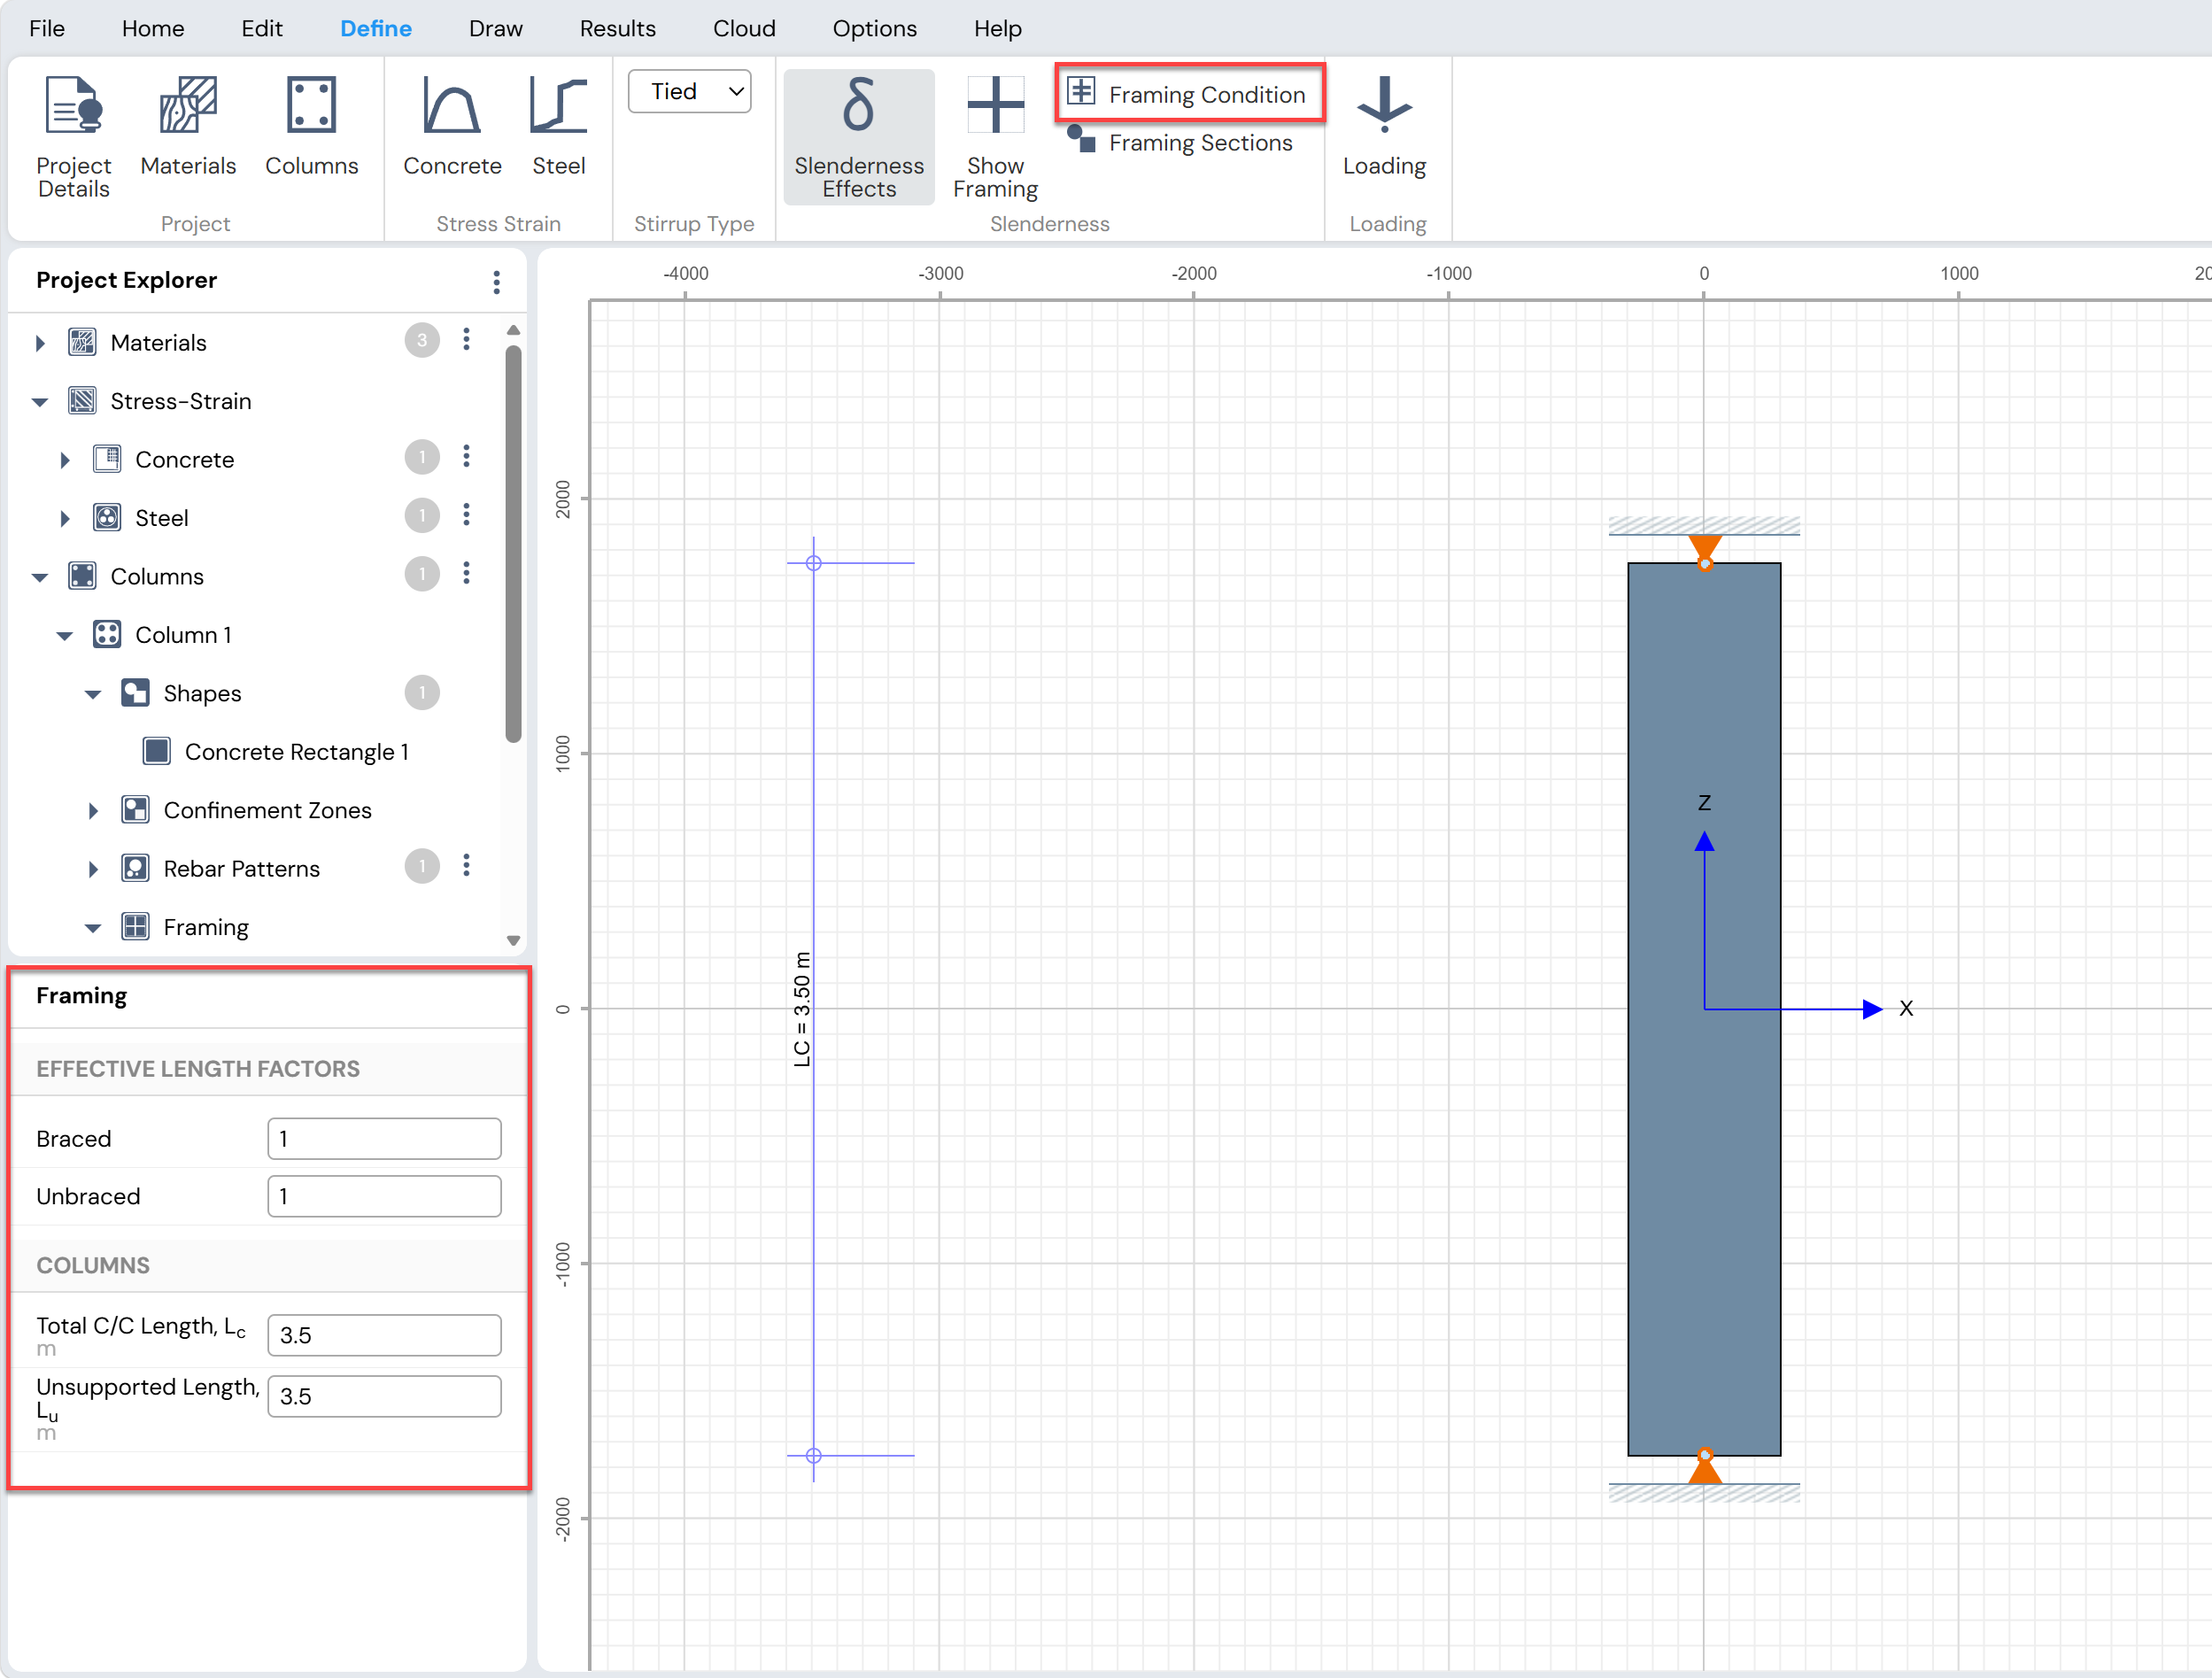
Figure: Effective Length Factors and Column Lengths in Column Designer.
9. Define Loading
Define the column loading using:
o Define Menu → Loading → Loading, or
o The button next to Project Explorer → Columns → Loading
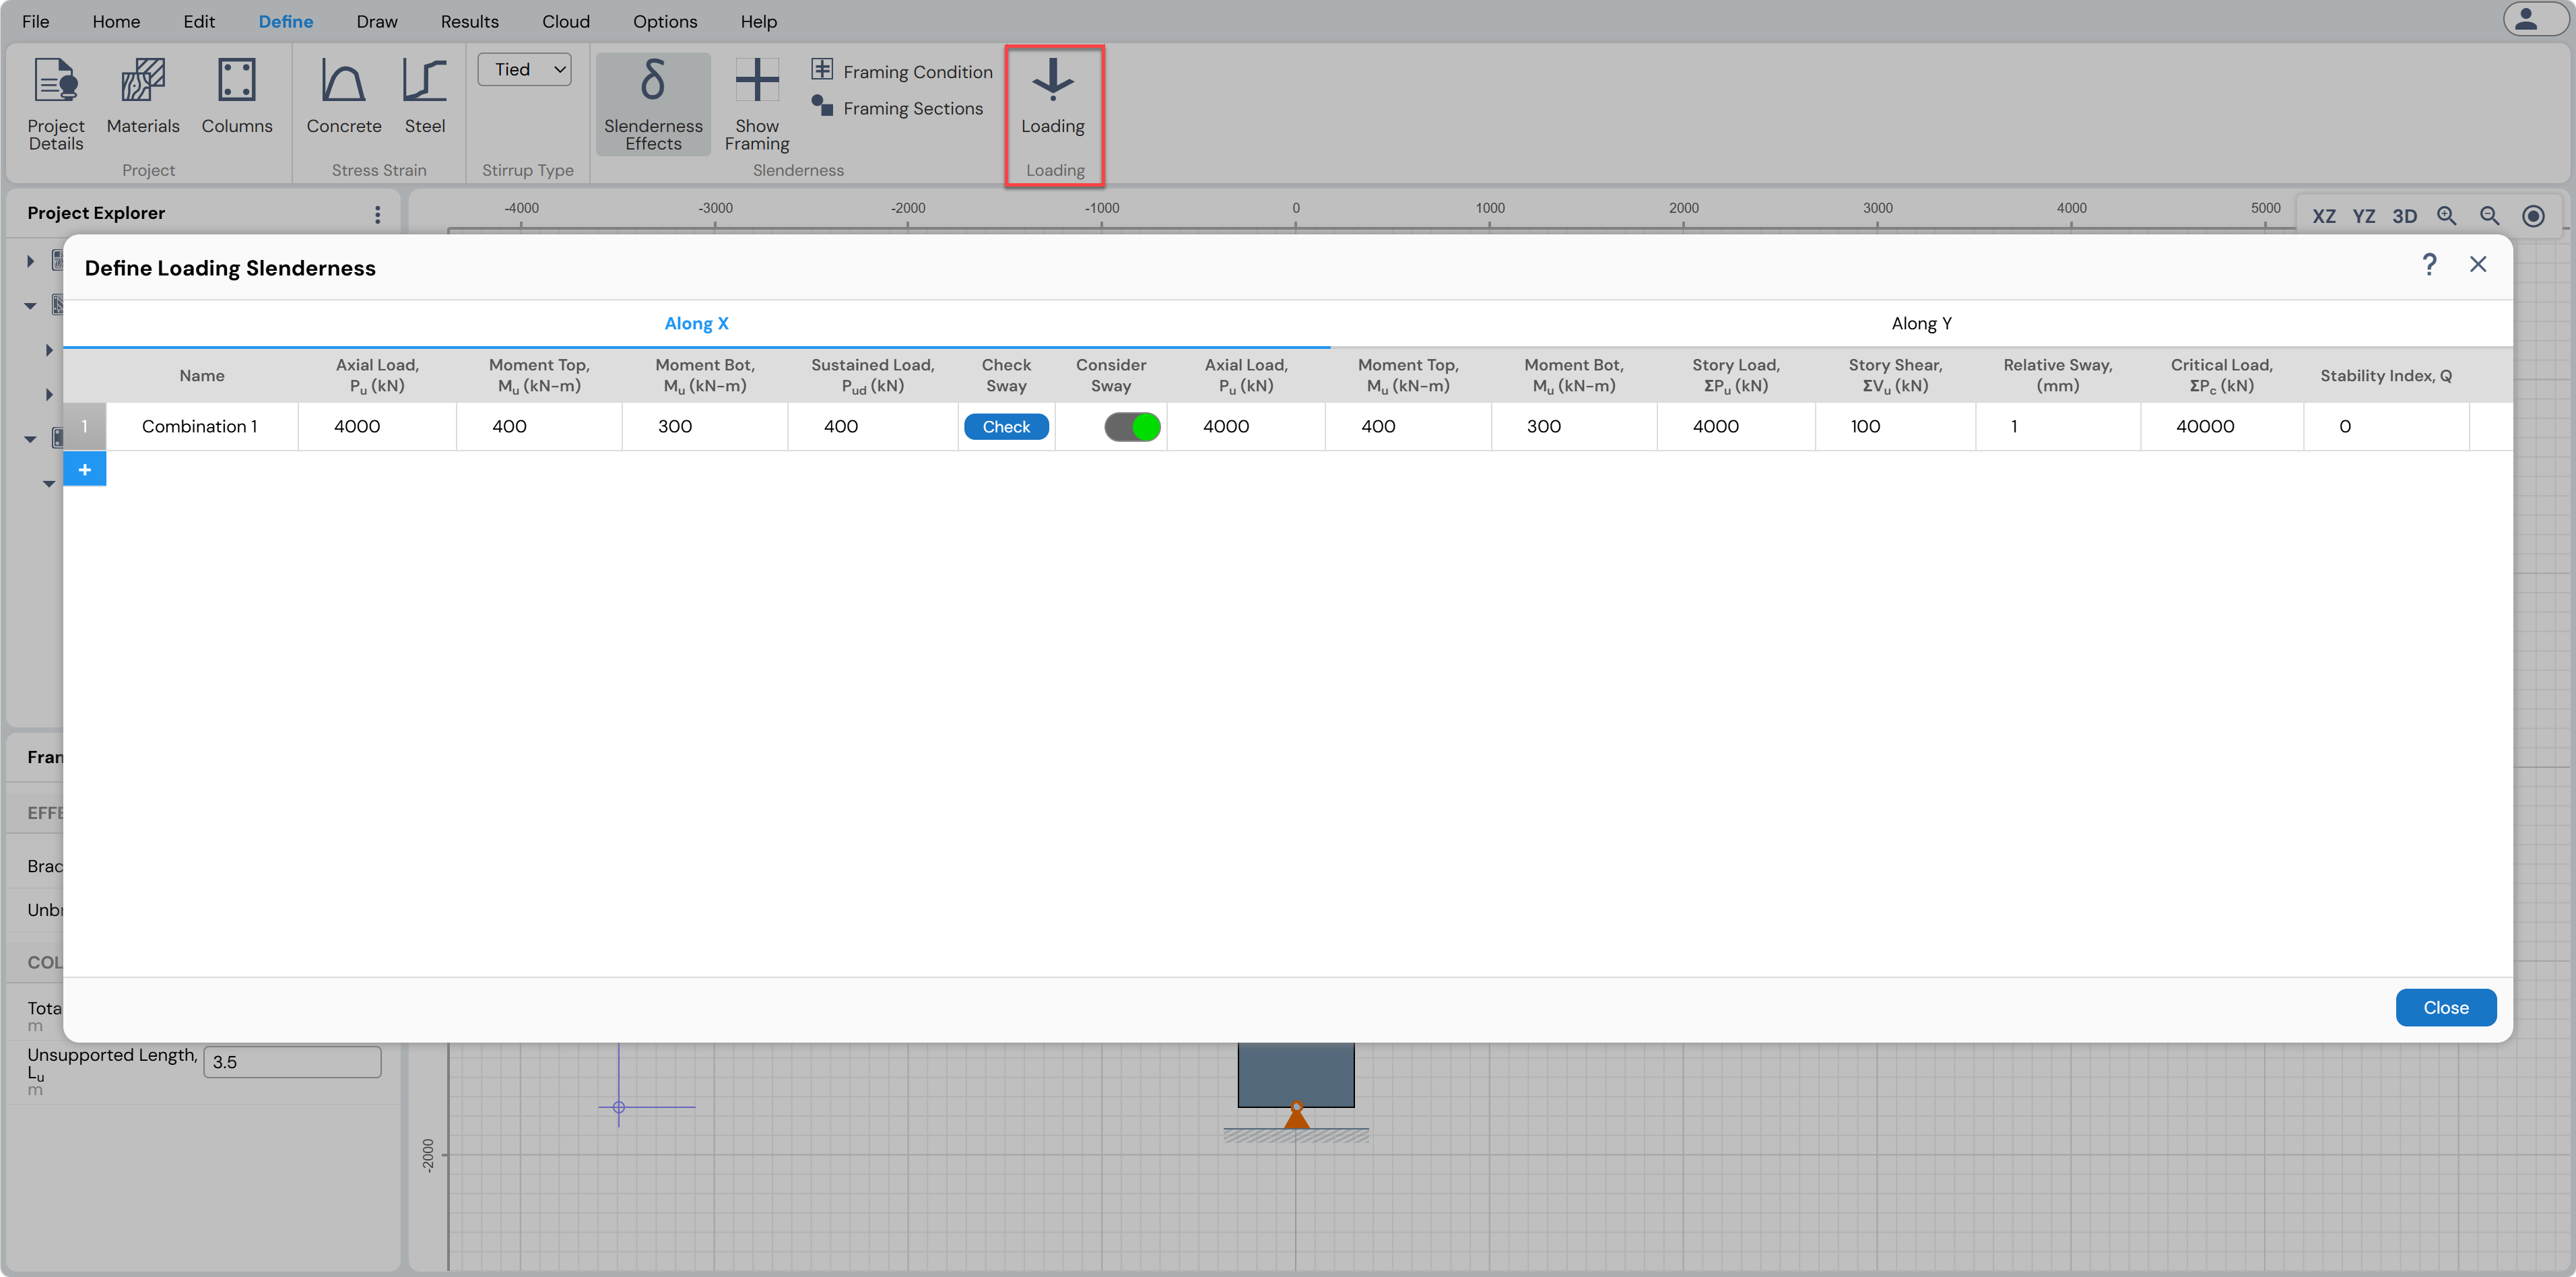
Figure: Load Definition in Column Designer.
10. Apply Auto Design
Use Home Menu → Design → Auto-Design to perform an iterative design process that determines:
o Minimum required reinforcement
o Reinforcement layout for the governing load combination
The design satisfies user-defined limits for:
o Minimum and maximum bar sizes
o Clear cover
o Clear spacing
o Maximum rebar ratio
o Maximum D/C ratio
Note:
Auto Design is available only for rectangular and circular reinforced sections.
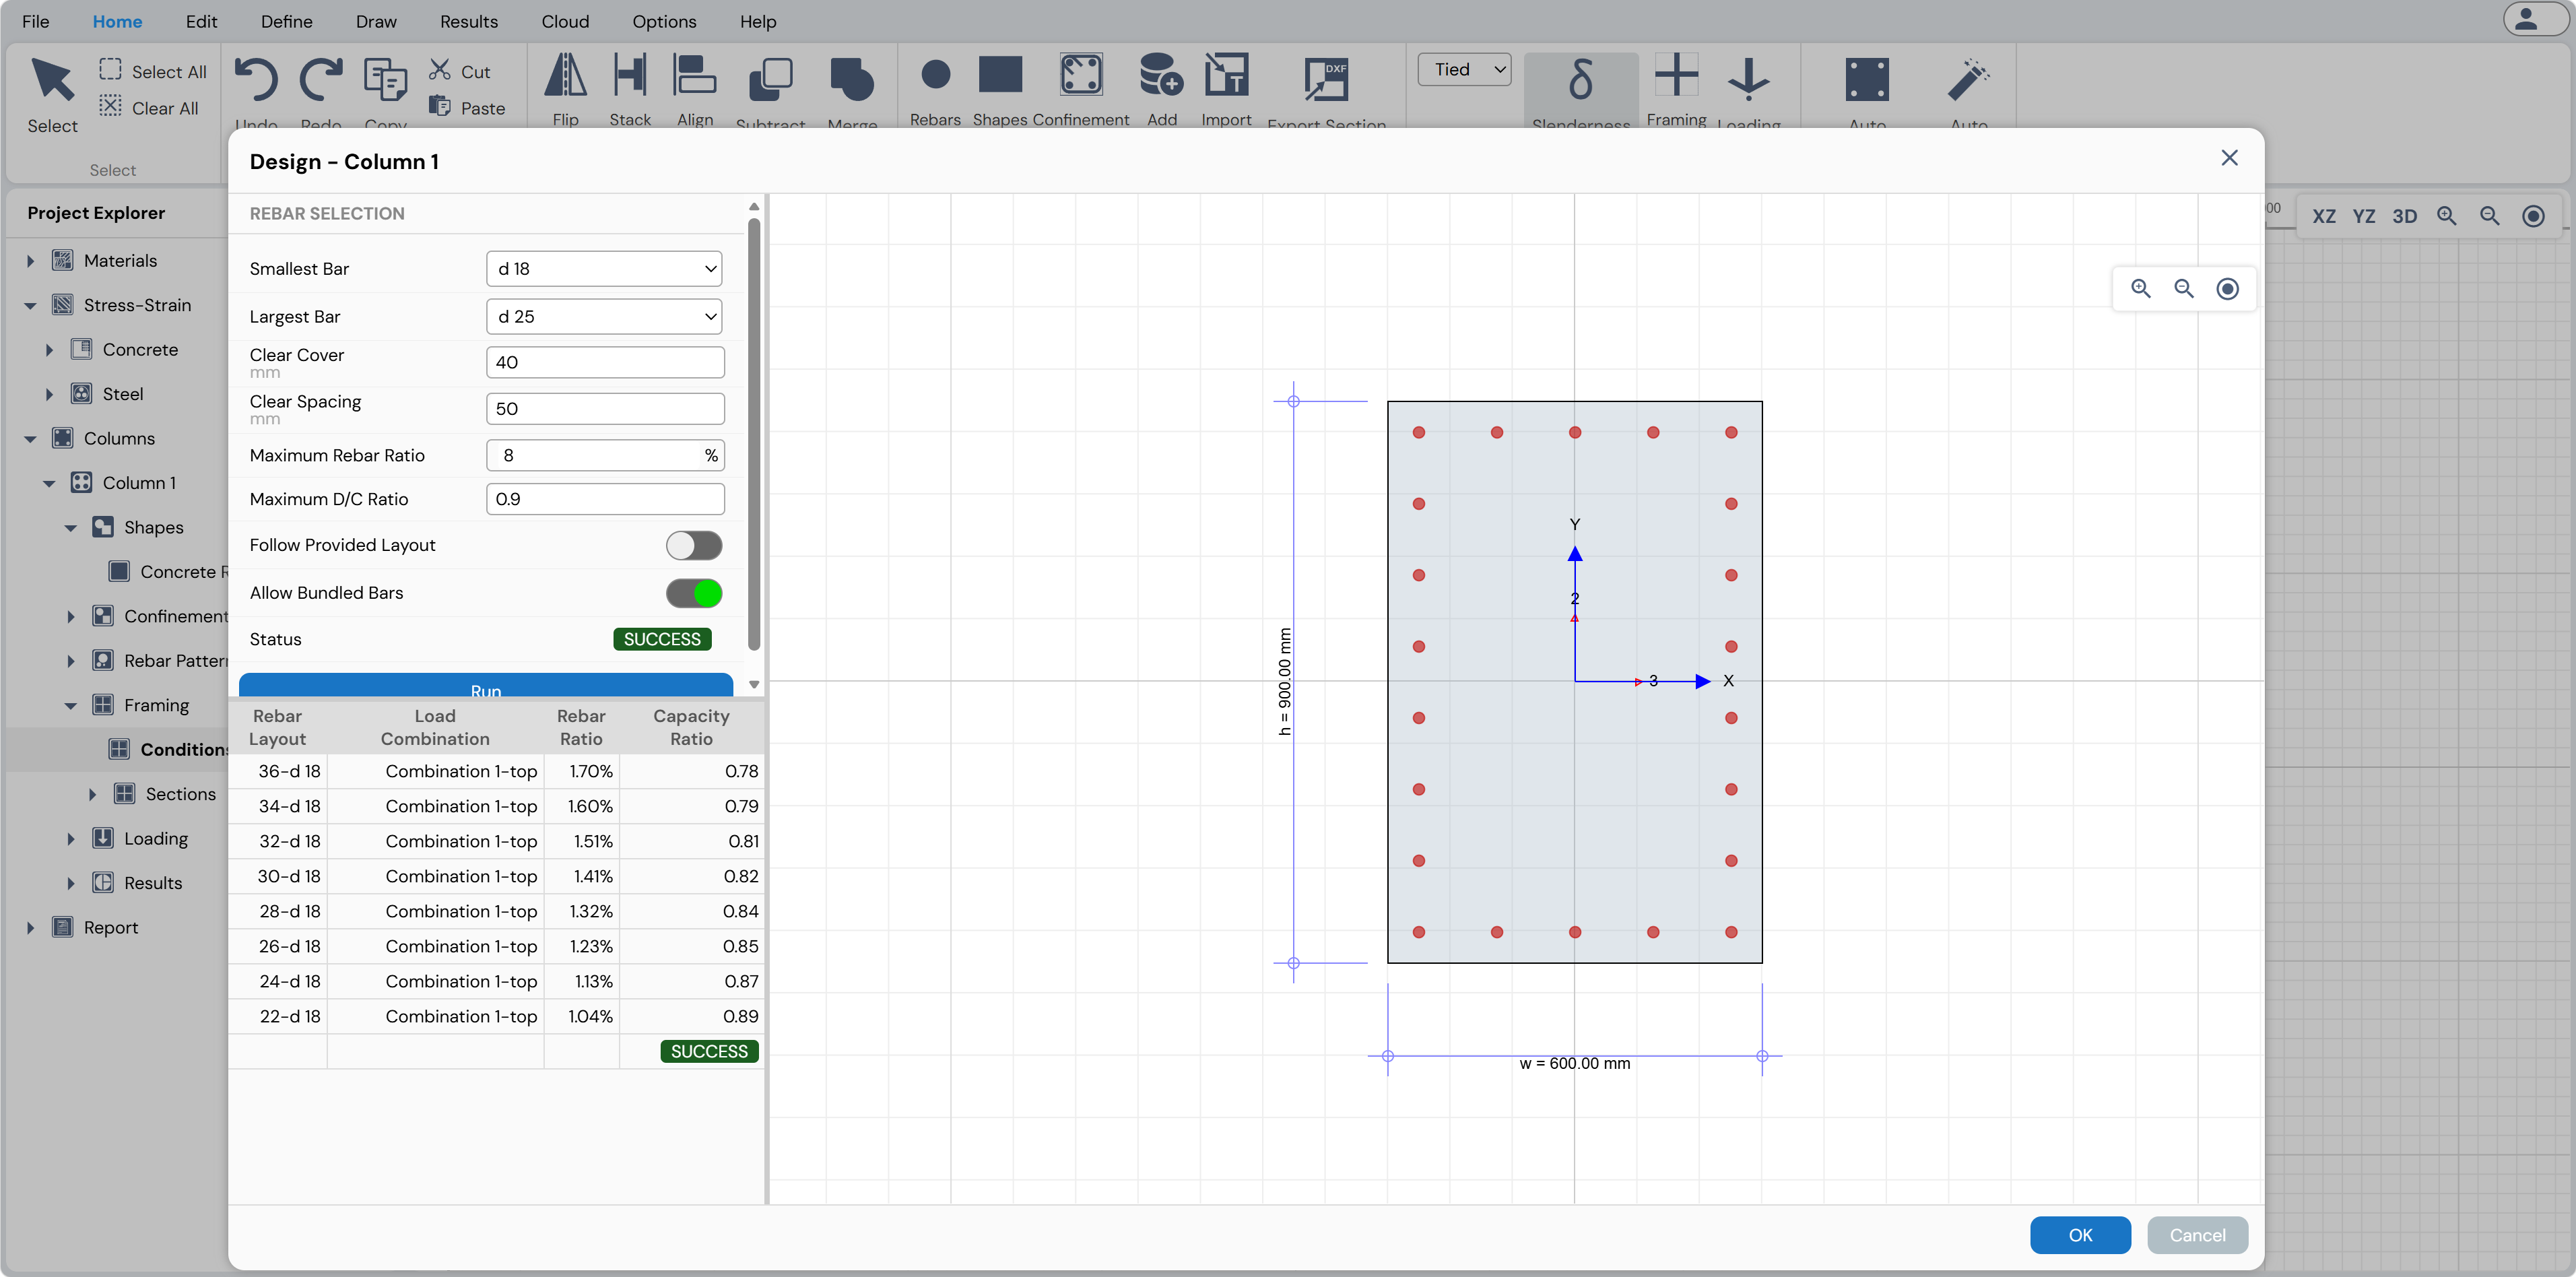
Figure: Auto Design Feature in Column Designer.
11. Review Results
Use the options available under:
o Results Menu, or
o Project Explorer → Columns → Results
to review analysis and design outputs for the selected column.
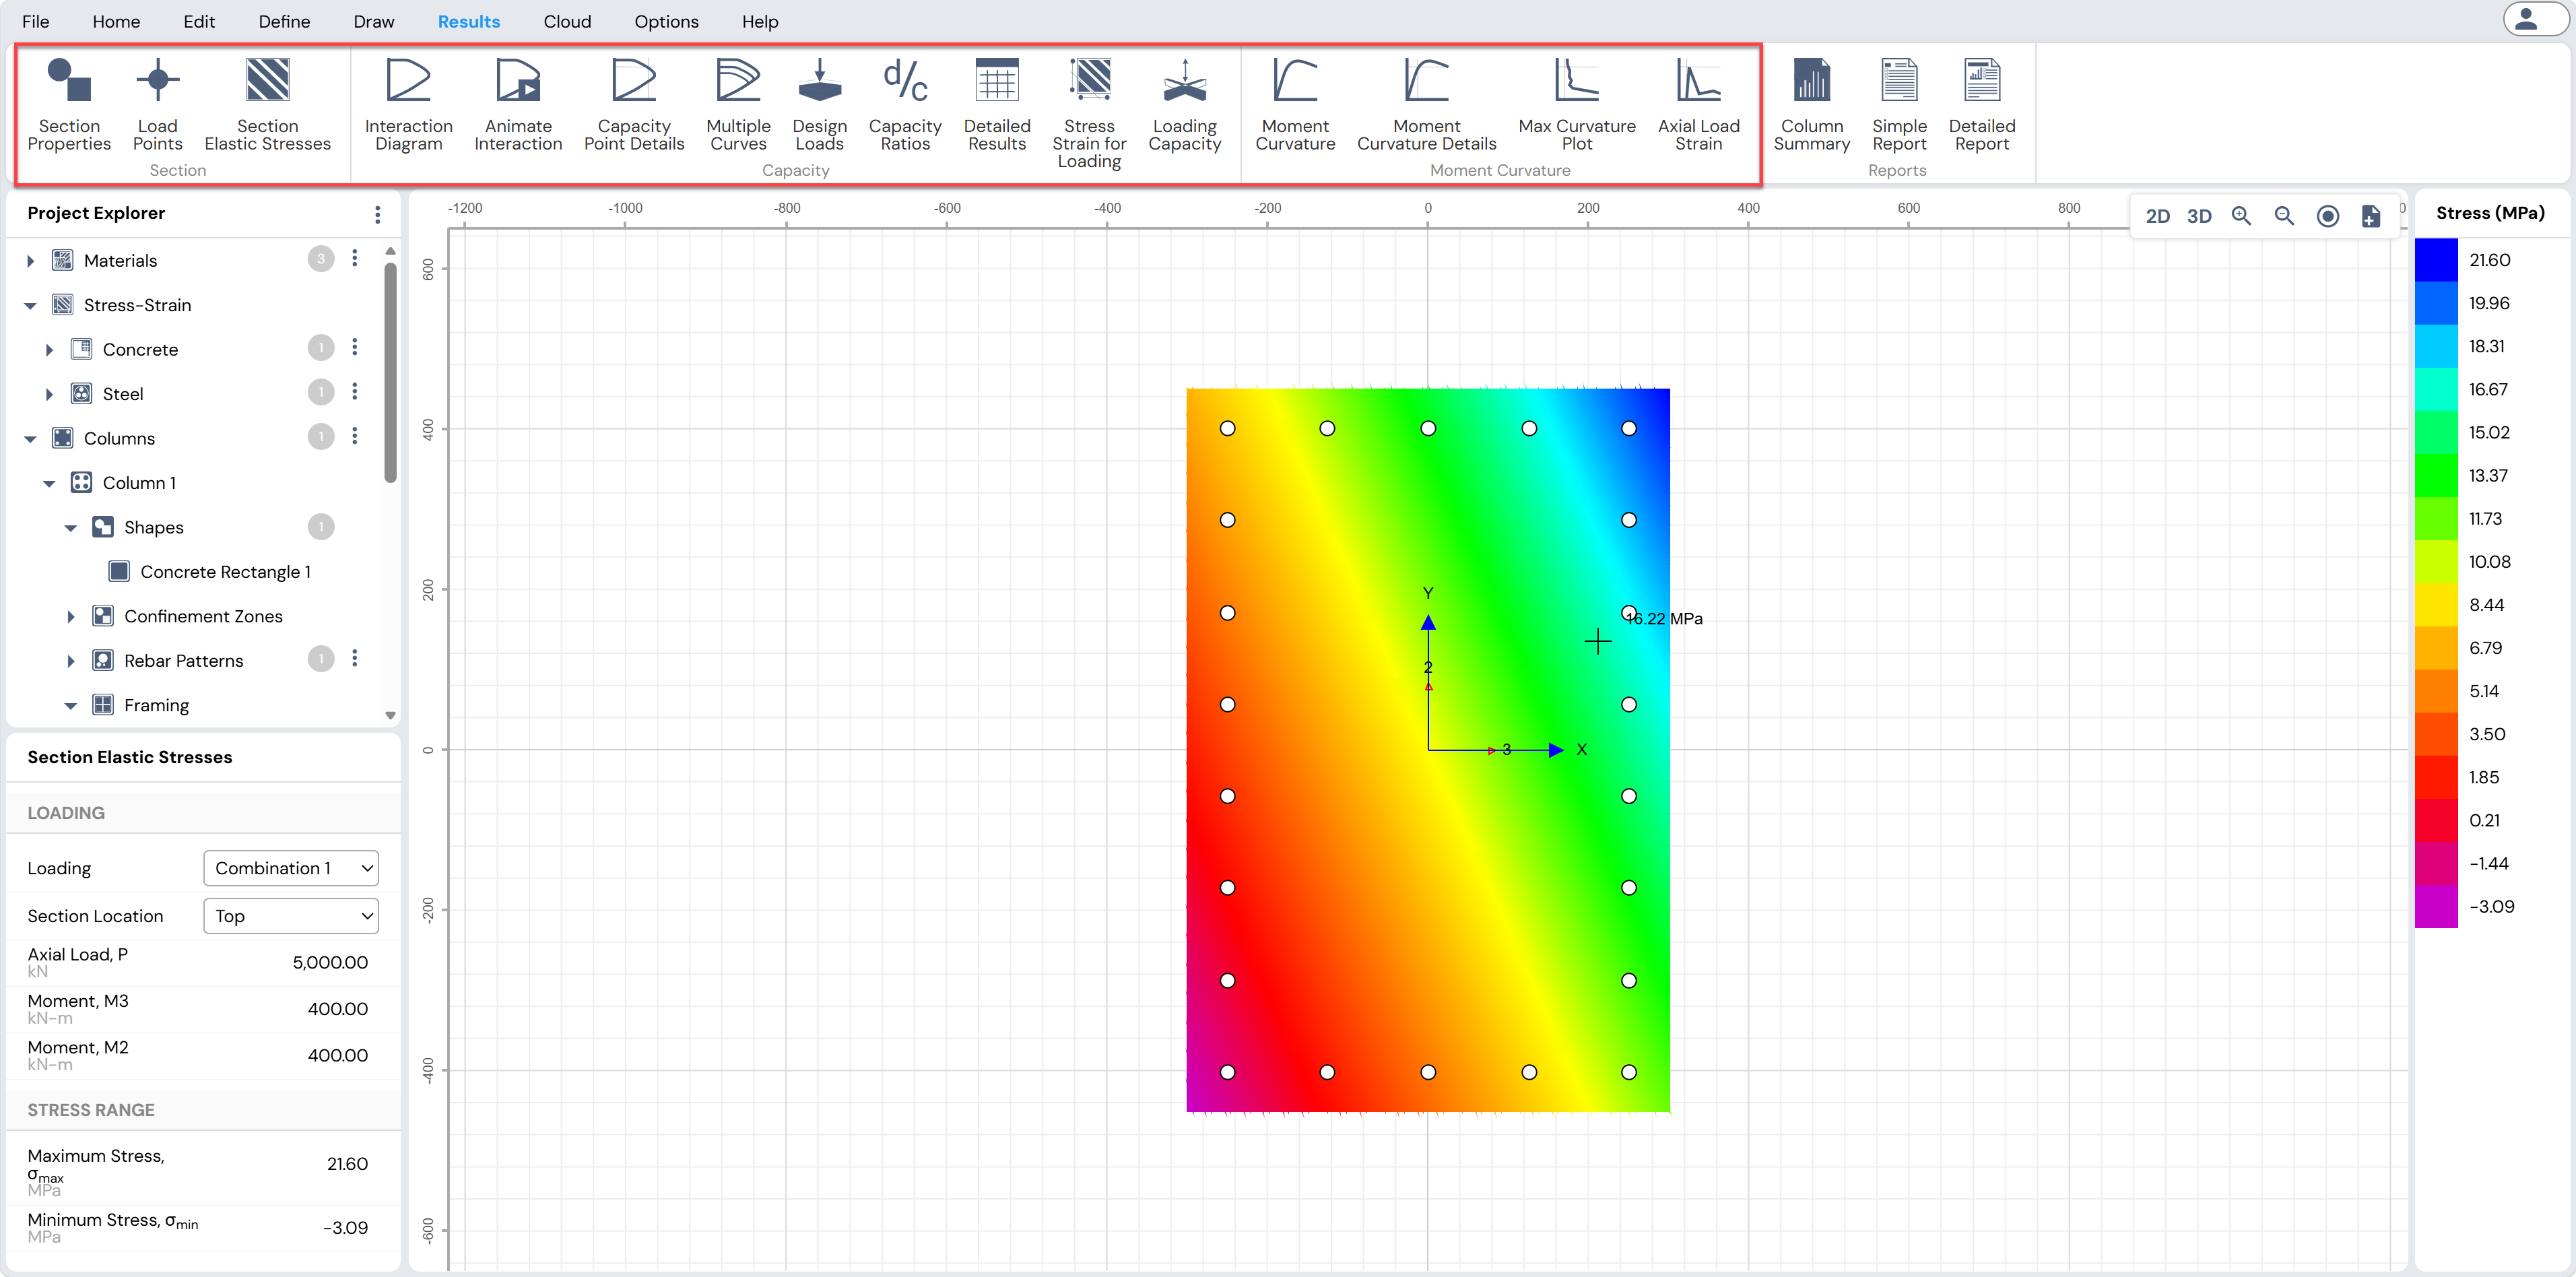
Figure: Effective Length Factors and Column Lengths in Column Designer.
12. Generate Reports
Use the Report view of the Project Explorer to:
o View the column summary
o Generate a one-page report
o Generate a detailed report
for the selected column.
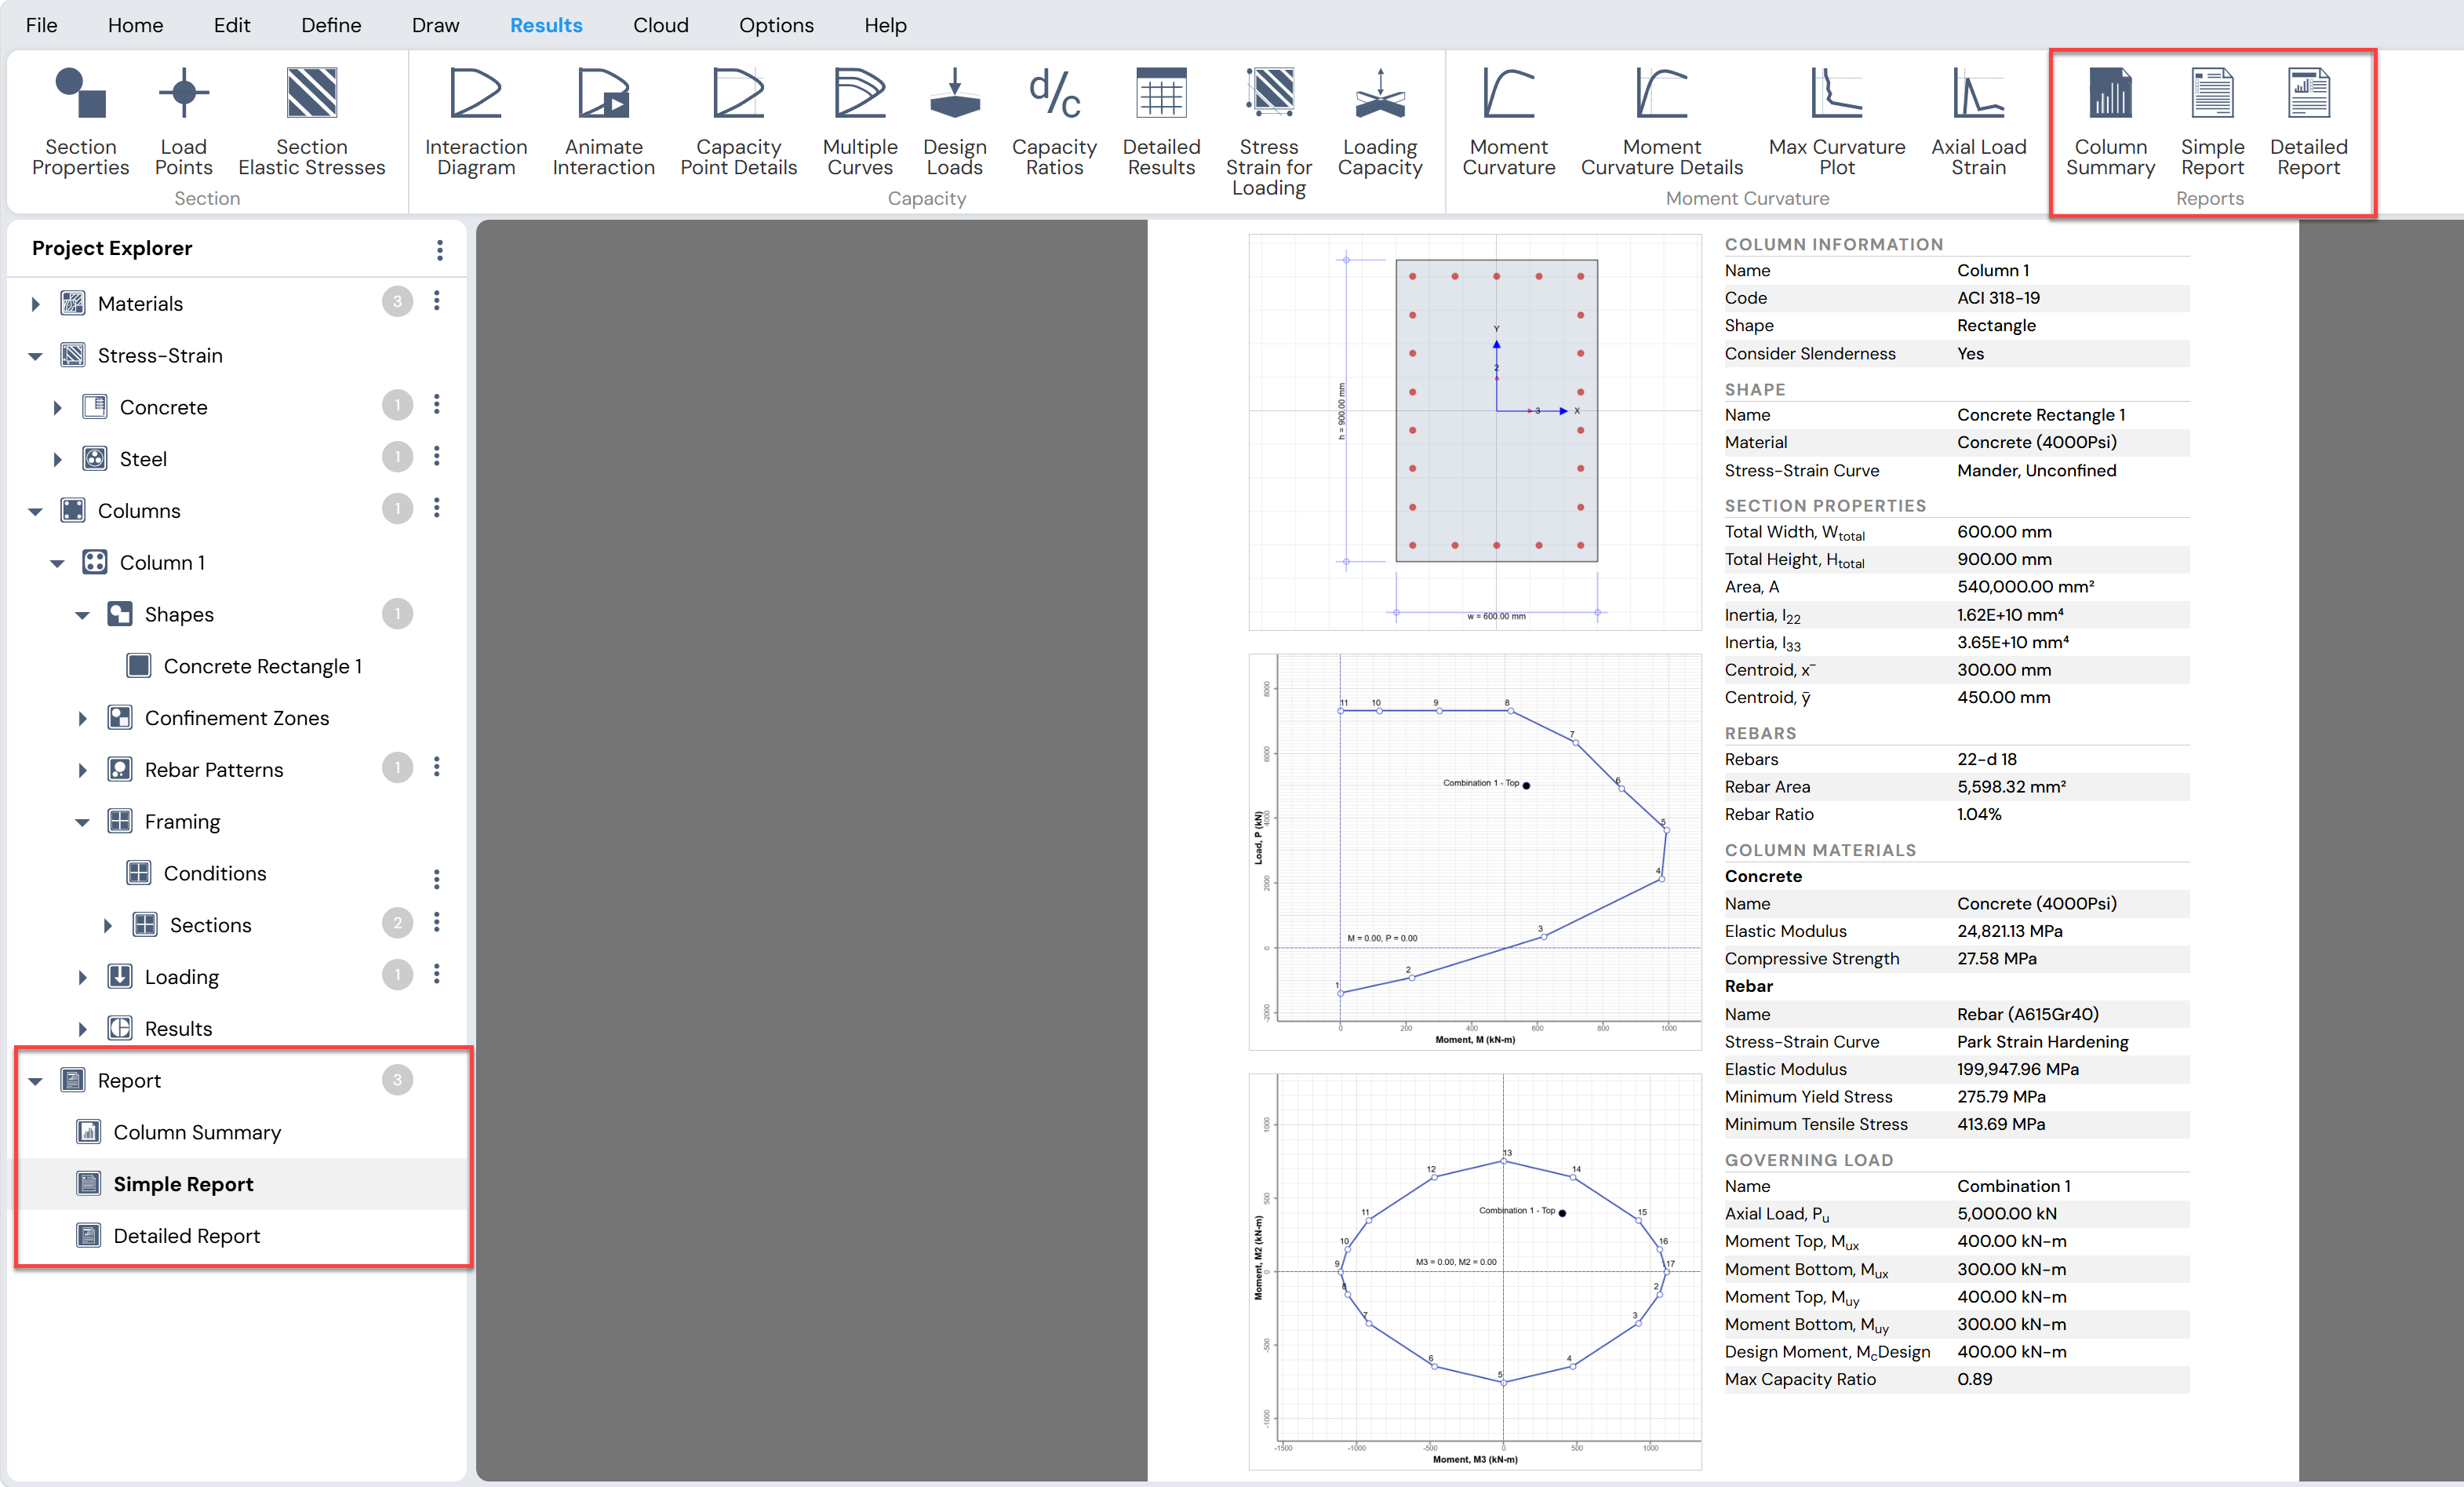
Figure: Reports Feature in Column Designer.
Methods for Importing Columns
Columns can be imported into Column Designer from the ETABS:
Import ETABS Model
The Import ETABS Model button allows the user to select an existing ETABS model and import the concrete columns defined in that model into Column Designer.
The basic procedure for importing an ETABS model is described below.
Procedure for Importing Columns from ETABS
Select ETABS Model File
Click the Import ETABS Model button to open the Open ETABS Model form.
Browse to the desired ETABS model file, select it, and click Open.Select Stories and Load Combinations
Select the stories and load cases or load combinations to be imported into Column Designer.
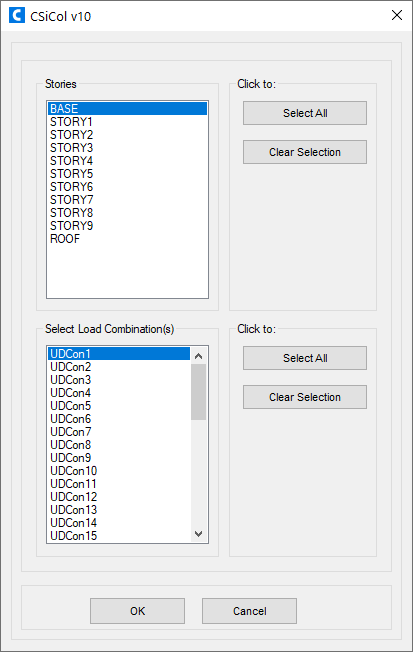
Figure: Select Load Cases/Combinations to Import
Select Columns from ETABS Model
After selecting the stories and load combinations, the ETABS Model form is displayed.
This form allows the user to:View the 3D ETABS model
Visually select the columns to be imported
Select multiple columns simultaneously
View properties of selected columns in the Property Grid
Columns can also be selected based on section type and story location by clicking the  button in the context-sensitive toolbar.
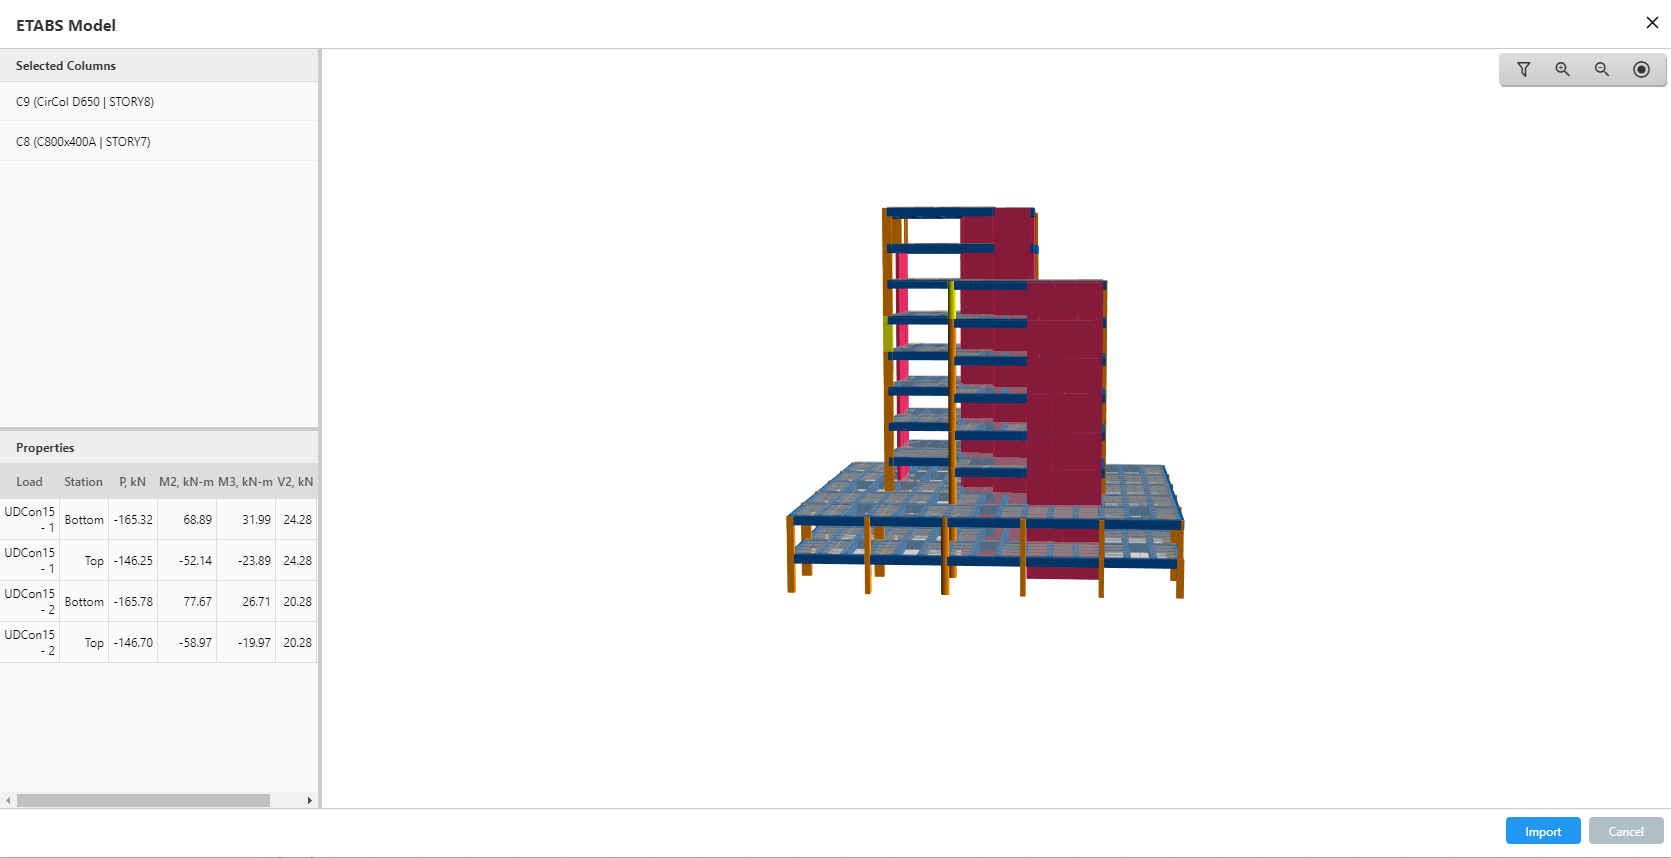
Figure: Importing Columns from ETABS Model
Notes on Importing from ETABS
This feature works only if ETABS is installed on the computer.
If the file path to the ETABS executable has not been set previously, the user will be prompted to define it.
Imported columns include:
Loading conditions
Material assignments
Framing conditions
Effective Length Factors (K) are not imported.
By default, the working units in Column Designer will match the database units used in ETABS.
Currently supported unit systems in Column Designer:
US (inch)
SI (mm)
If the ETABS model uses the MKS system, it is automatically converted to SI (mm).
If the ETABS model uses an older version of a design code available in Column Designer, the model opens using the newer version of that design code.
If the design code used in ETABS is not available in Column Designer, the model opens using the default design code (ACI 318-19).
If the ETABS building model has not been analyzed and designed, only the model geometry is imported.
If a column is failing in ETABS, it can still be imported, but reinforcement details will not be available.
Viewing Imported ETABS Columns
Imported columns are listed under Project Explorer → Columns.
When more than 10 columns are imported, only 10 columns are shown at a time.
To view all imported columns in tabular form:
Click the button next to Project Explorer → Columns, or
Use Define Menu → Project → Columns
Important Note on Clear Cover
Unlike ETABS, the clear cover in Column Designer is measured up to the outer edge of the main bar.
Therefore, when importing sections from ETABS:
The tie diameter is added to the clear cover of the confinement bars
This adjusted value is used as the clear cover in Column Designer
Add Shapes from a Library
Regardless of the method used to create a column, shapes from the standard shape libraries can be added to a column section. This allows the creation of complex and composite column sections.
Tools for merging and editing shapes are described in Editing Column Cross sections.
Shapes can be added from the following libraries:
Basic Concrete Shapes
Basic Steel Shapes
Shape Library
Steel Shapes
Each option is described below.
Basic Concrete Shapes
Select any of the basic concrete shapes available under:
Draw Menu → Concrete Shapes
These tools allow shapes to be drawn directly in the working area.
Available basic concrete shapes include:
Rectangle
Box
Circle
Tee
Pipe
Channel
Angle
Shapes of arbitrary geometry can also be created graphically by selecting the Polygon shape and drawing it directly in the working area.
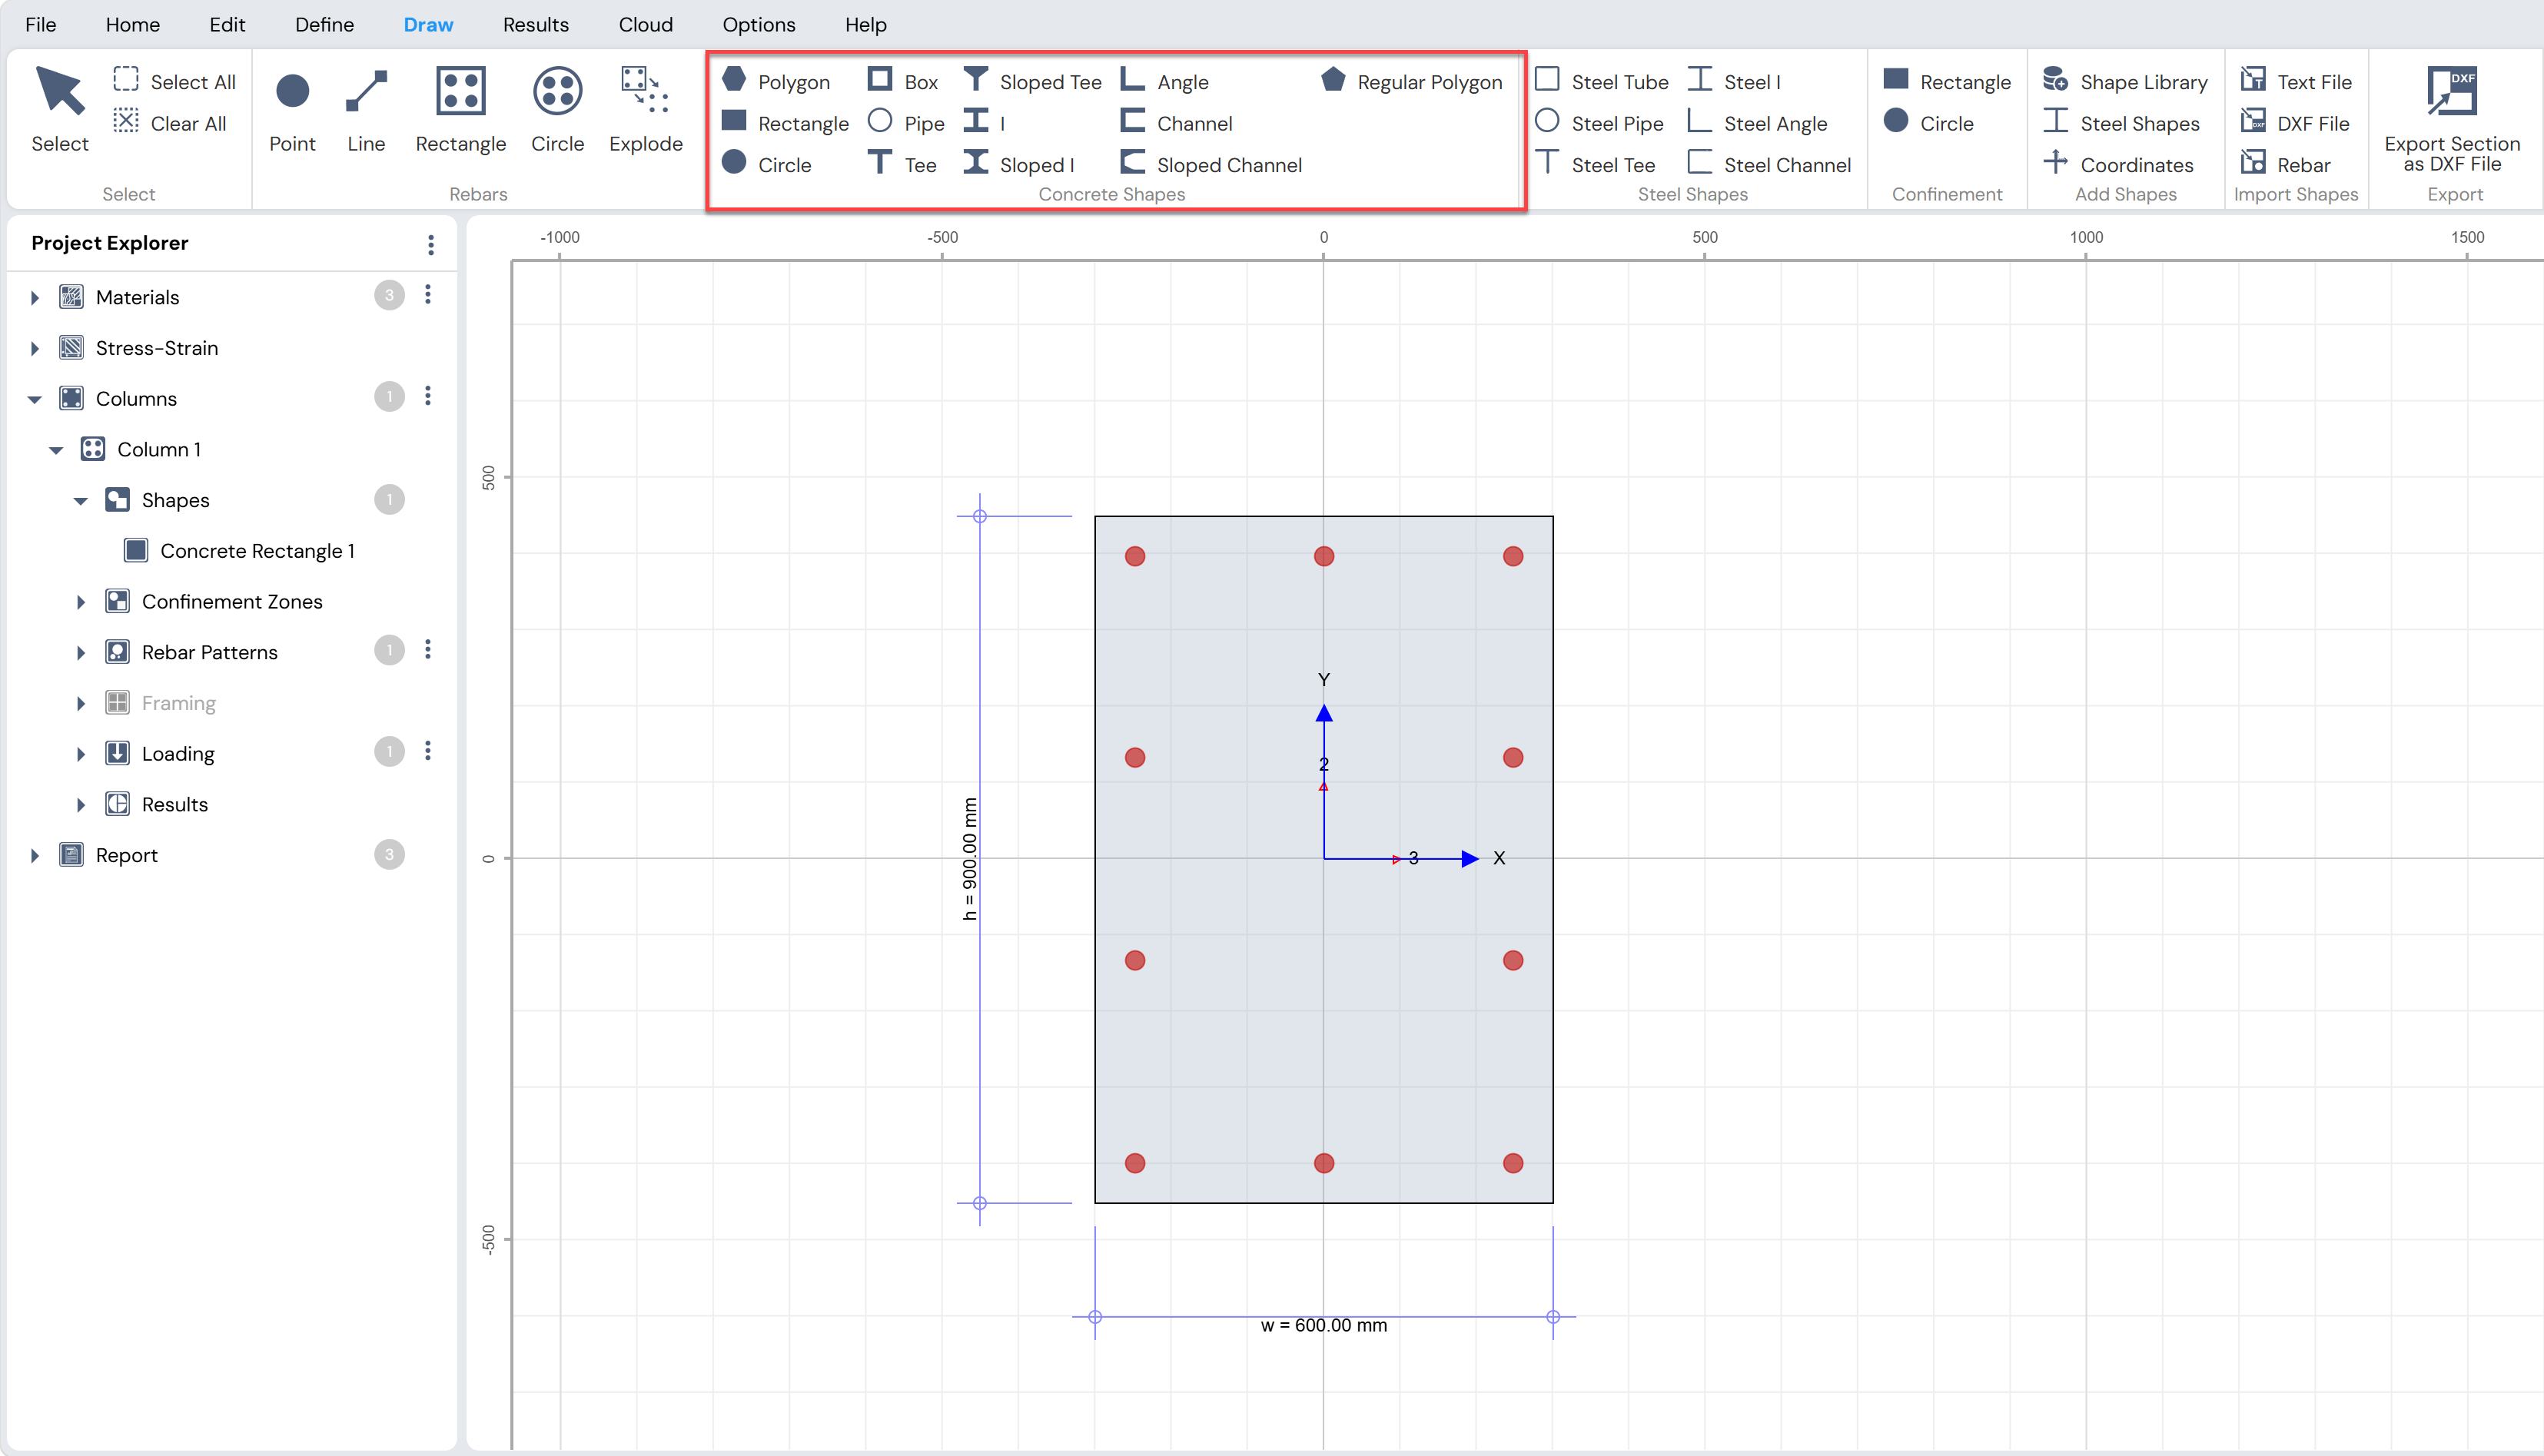
Figure: Adding Basic Concrete Shapes in Draw Menu
Basic Steel Shapes
Select any of the basic steel shapes available under:
Draw Menu → Steel Shapes
These tools allow steel shapes to be drawn directly in the working area.
Available basic steel shapes include:
Tube
Pipe
Angle
Tee
Channel
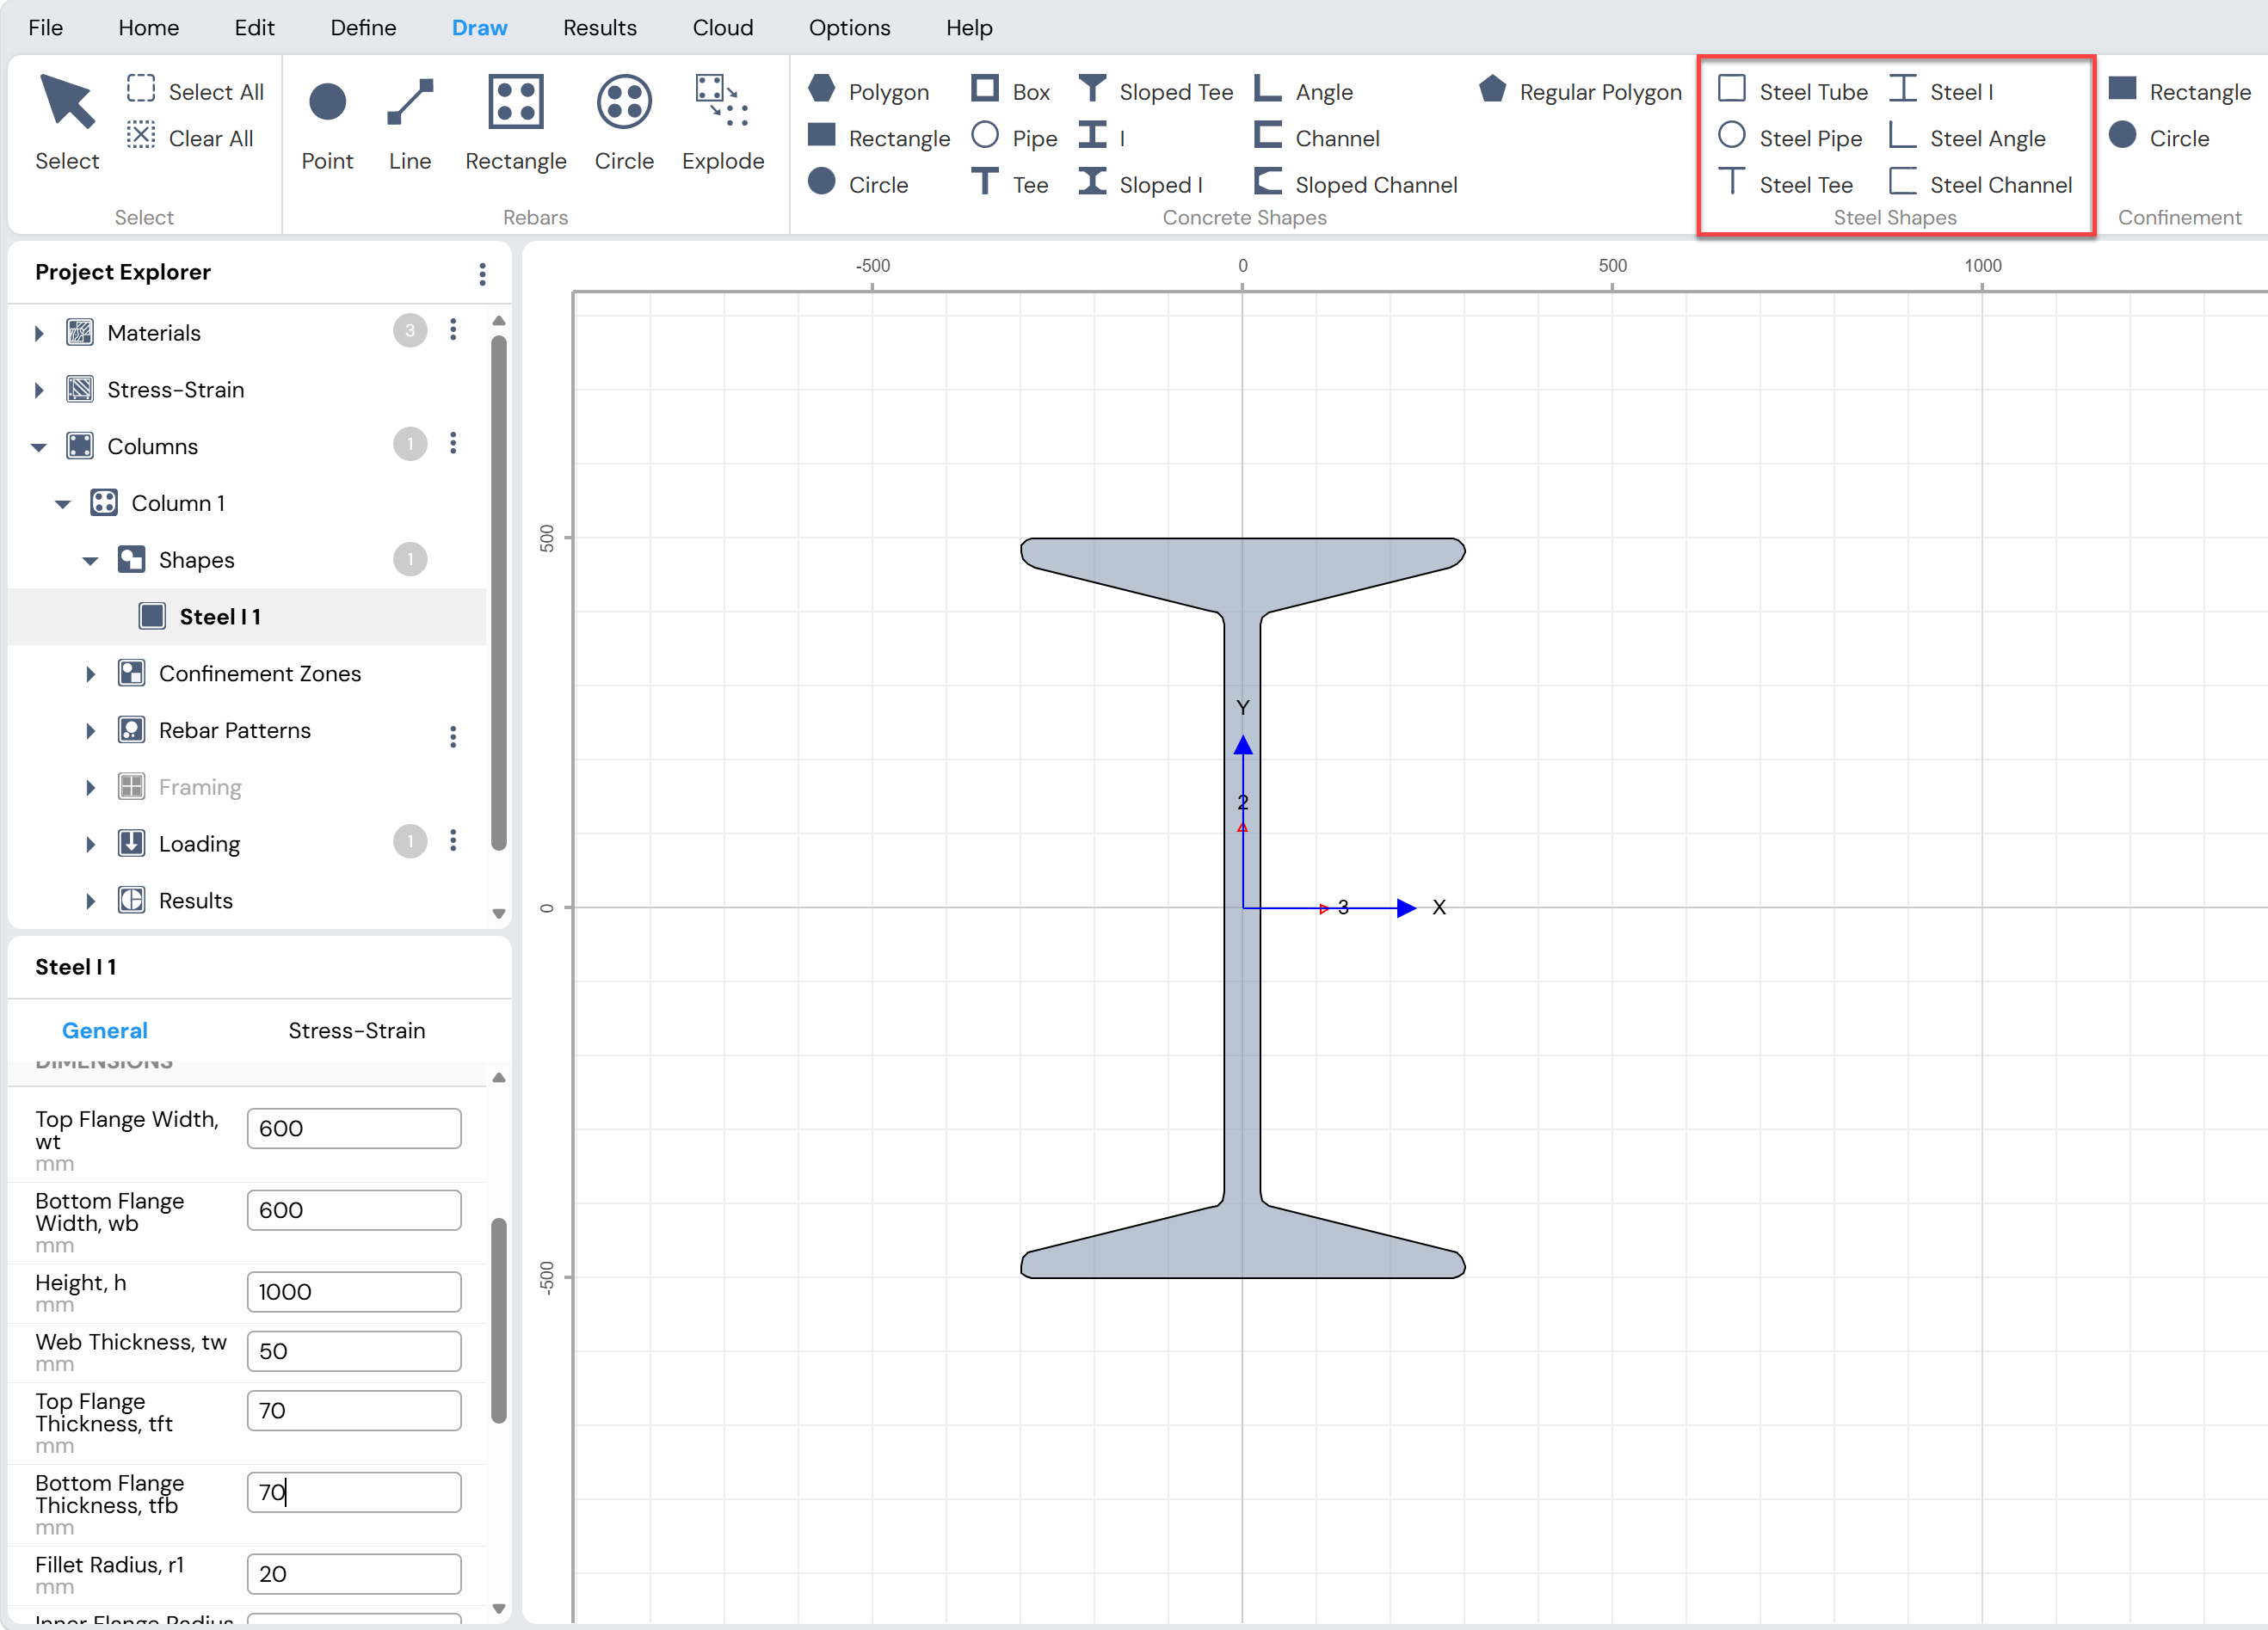
Figure: Adding Basic Steel Shapes in Draw Menu
Shape Library
Click:
Draw Menu → Add Shapes → Shape Library
to access a selection list of predefined shapes.
The Shape Library includes shapes from various standard and specialized libraries, such as:
AISC Steel Shapes
BS Steel Shapes
CISC Steel Shapes
Basic Concrete and Steel Shapes
Box Girder Shapes
Bridge Pier Shapes
Cold-Formed Shapes
Fillet and Chamfer Shapes
Plate Library
Rounded Steel Shapes
Shear Walls
These shapes can be edited parametrically after insertion.
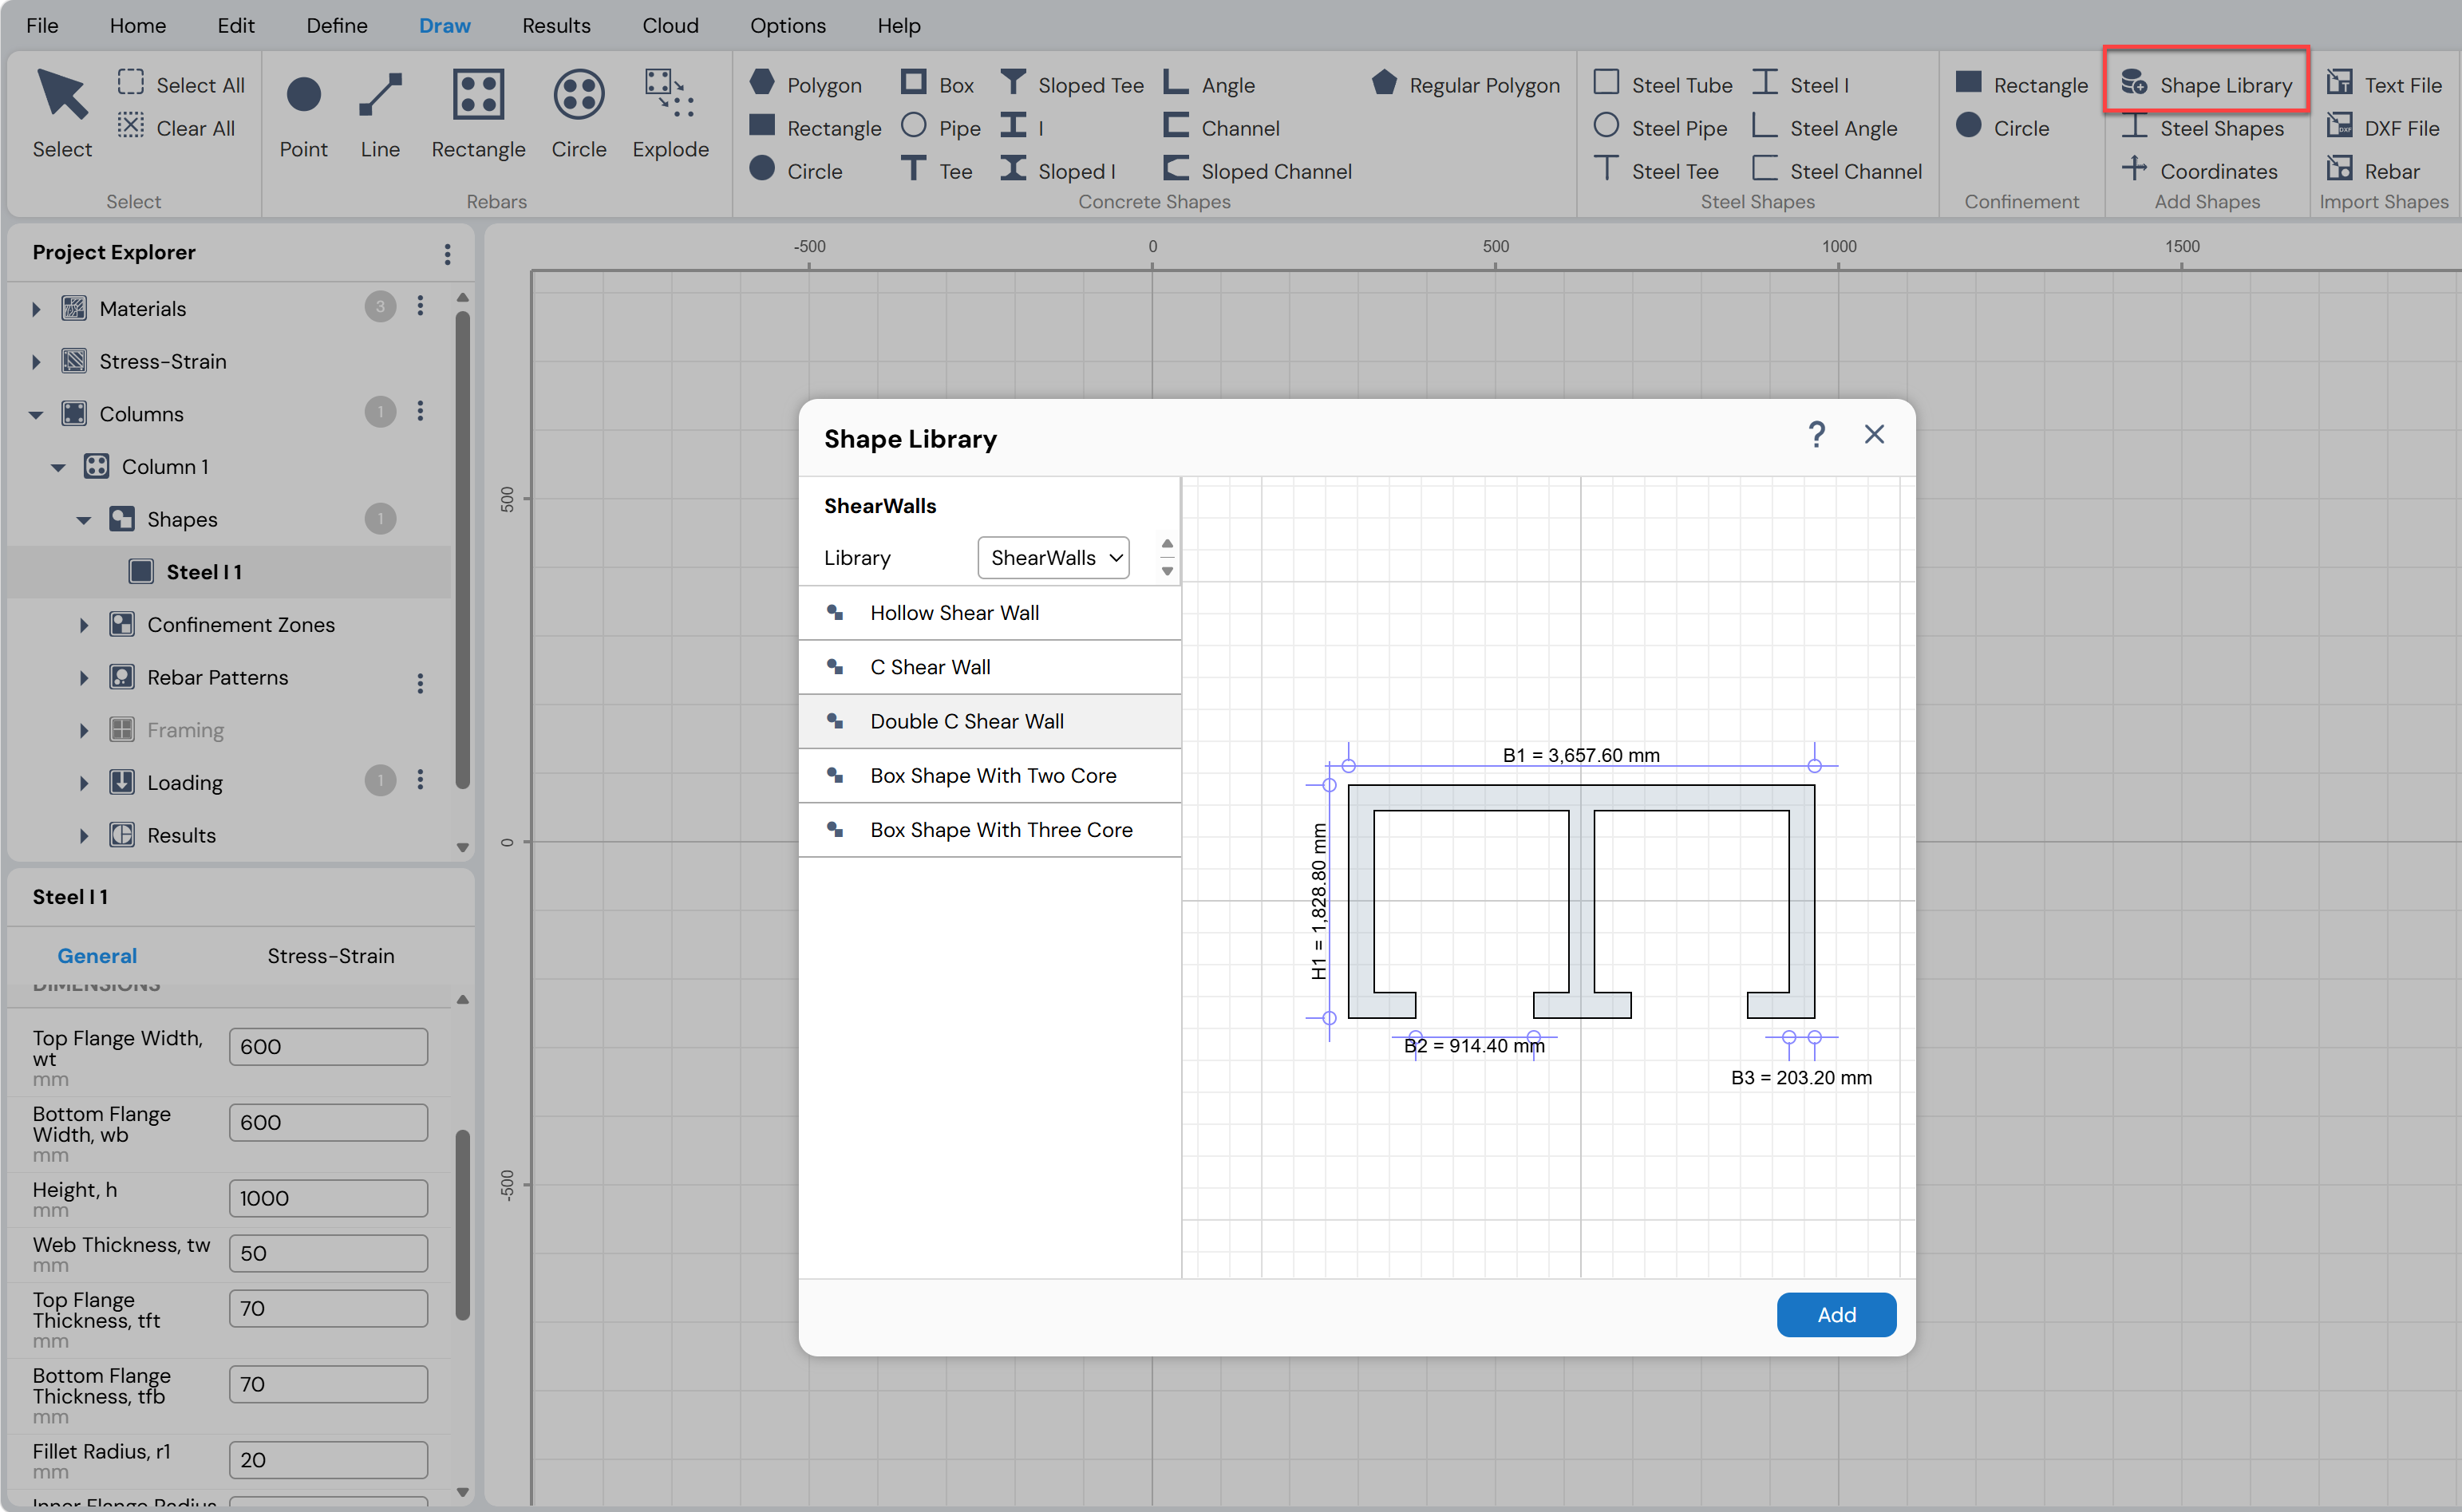
Figure: Adding Shapes from Shape Library in Draw Menu
Steel Shapes
Select standard steel shapes by clicking:
Draw Menu → Add Shapes → Steel Shapes
This option provides access to a library of predefined standard steel sections, which can be added directly to the column section.
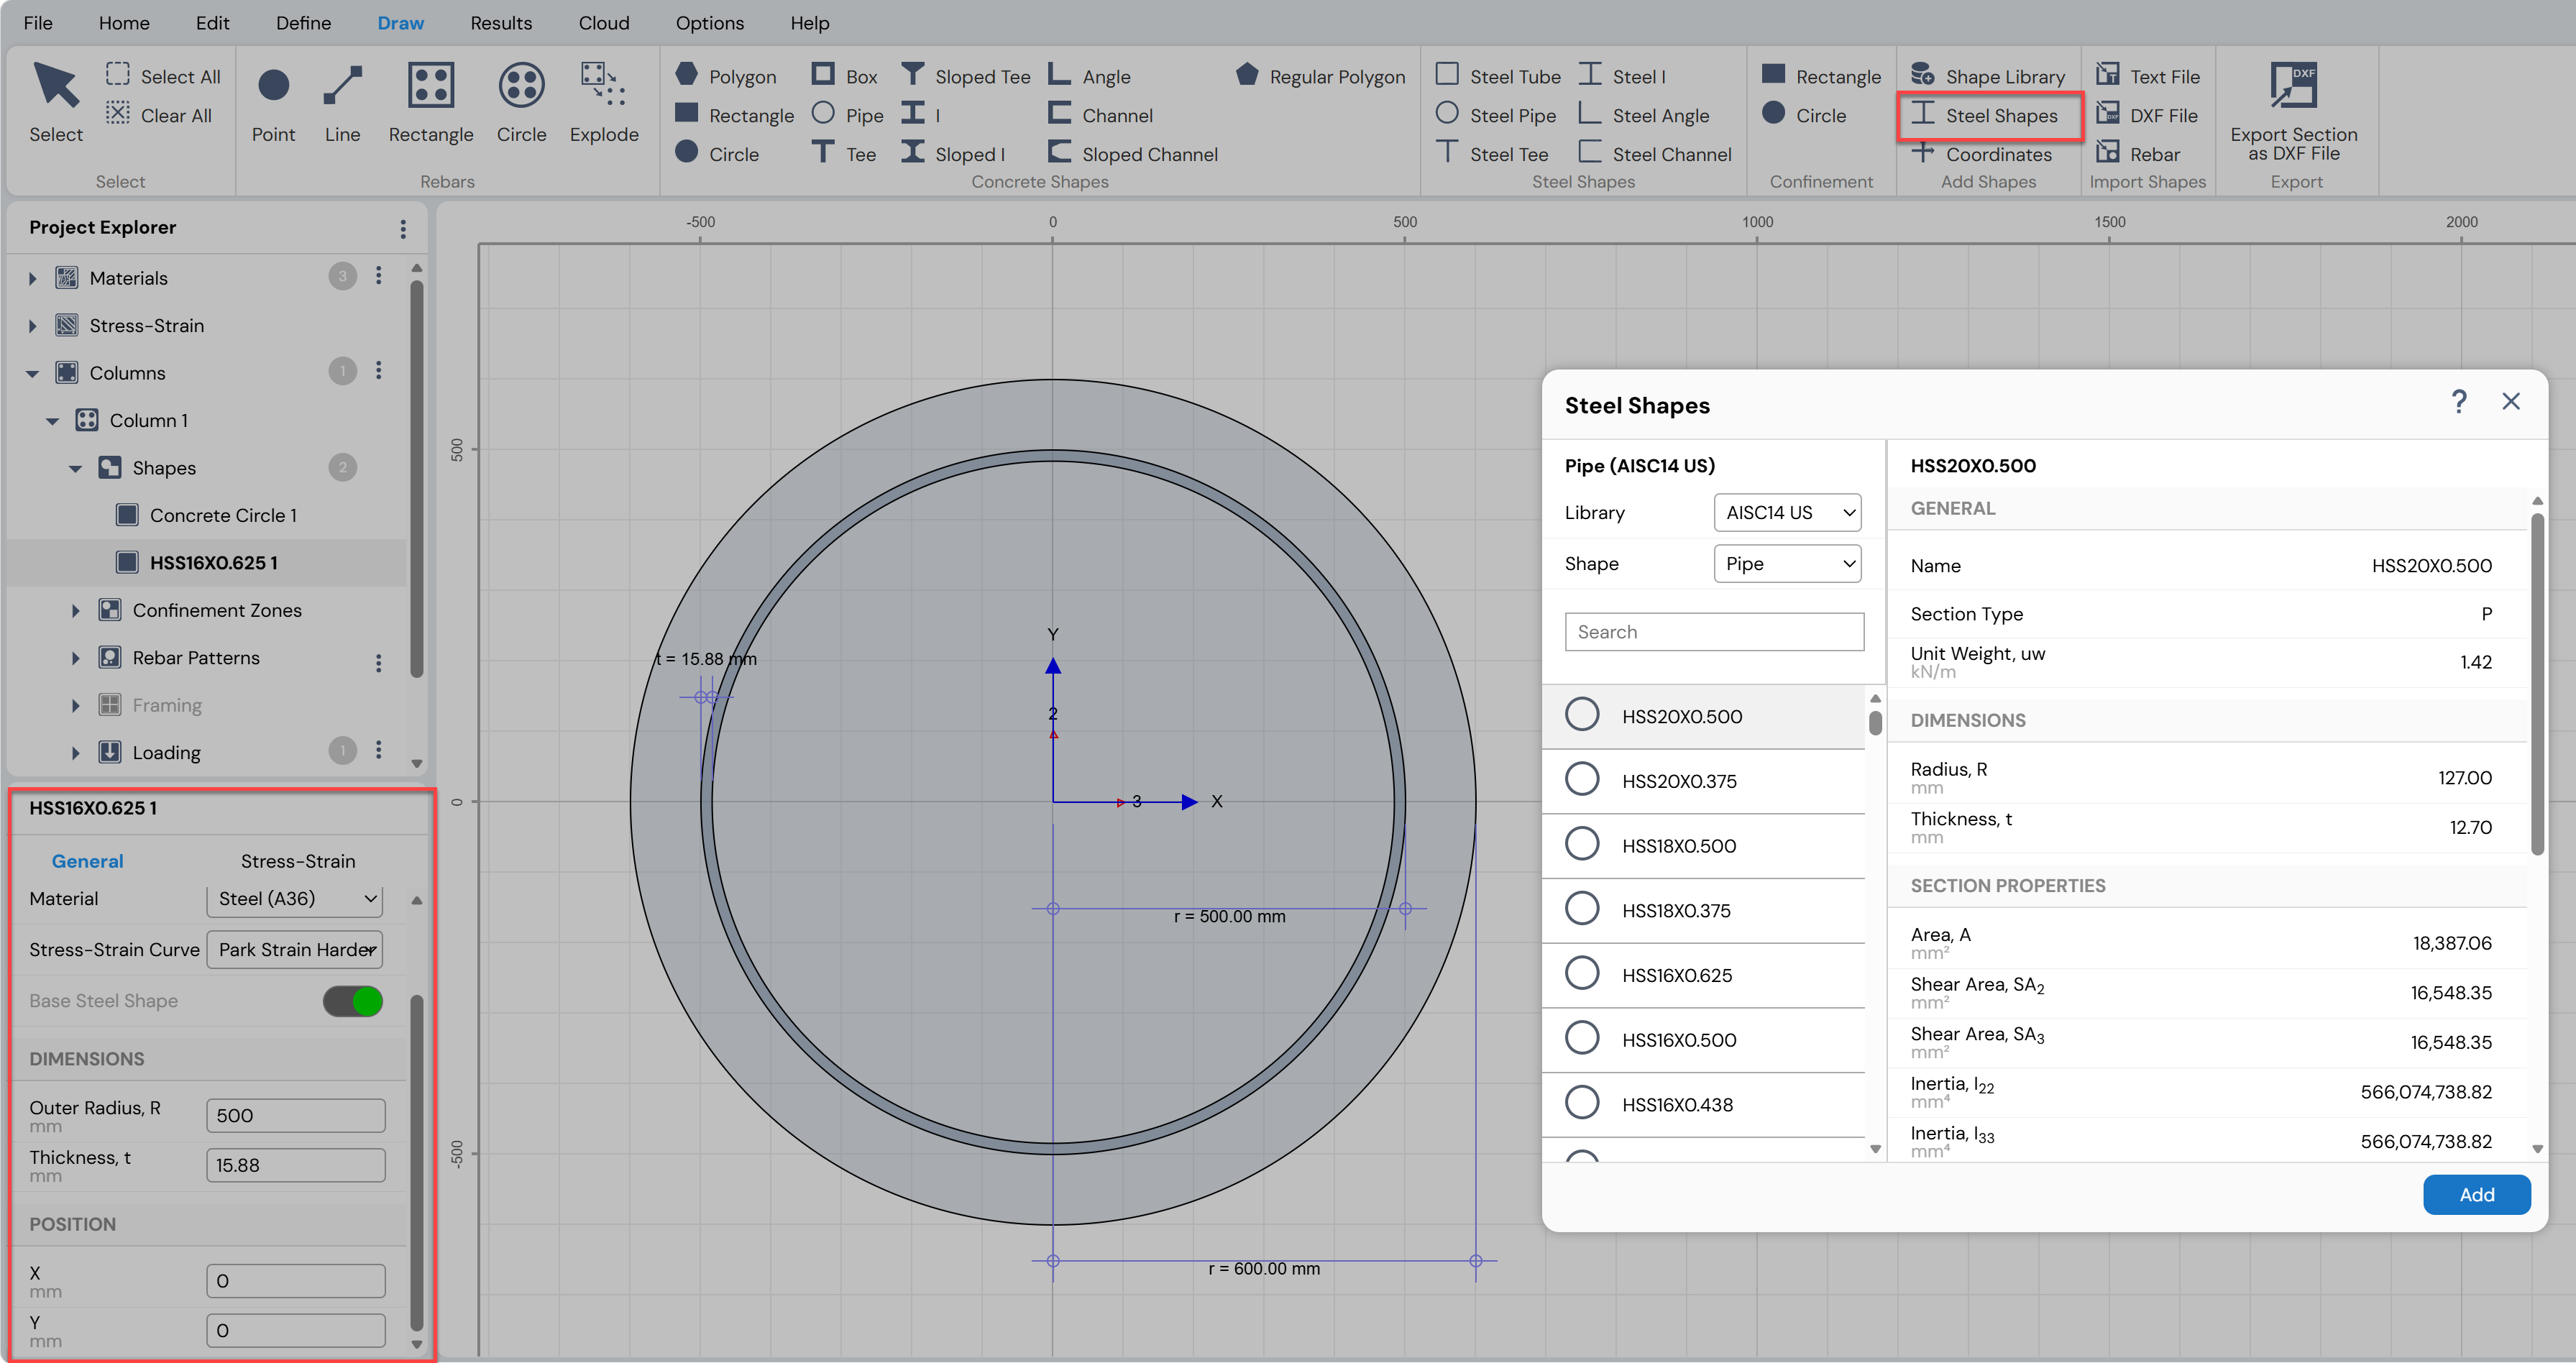
Figure: Adding Standard Steel Shapes in Draw Menu
Add Shape by Coordinates
A shape can be defined by explicitly specifying its nodal point coordinates.
Coordinates may be entered manually using the keyboard or imported from an external file.
Supported external sources include:
Comma-separated text files
Tab-separated text files
Space-separated text files
Defining a Shape Using Coordinates
The following options are available for defining shapes by coordinates:
Draw Menu → Add Shapes → Coordinates
Click this option to open the Add Points form.
In this form, coordinate values for the desired shape can be:Entered directly using the keyboard, or
Imported from an external file using the Import button
Draw Menu → Import Shapes → Text File
Click this option to import a shape directly from a text file containing the nodal coordinates.
These methods are useful for creating irregular or user-defined geometries that cannot be easily drawn using parametric shape tools.
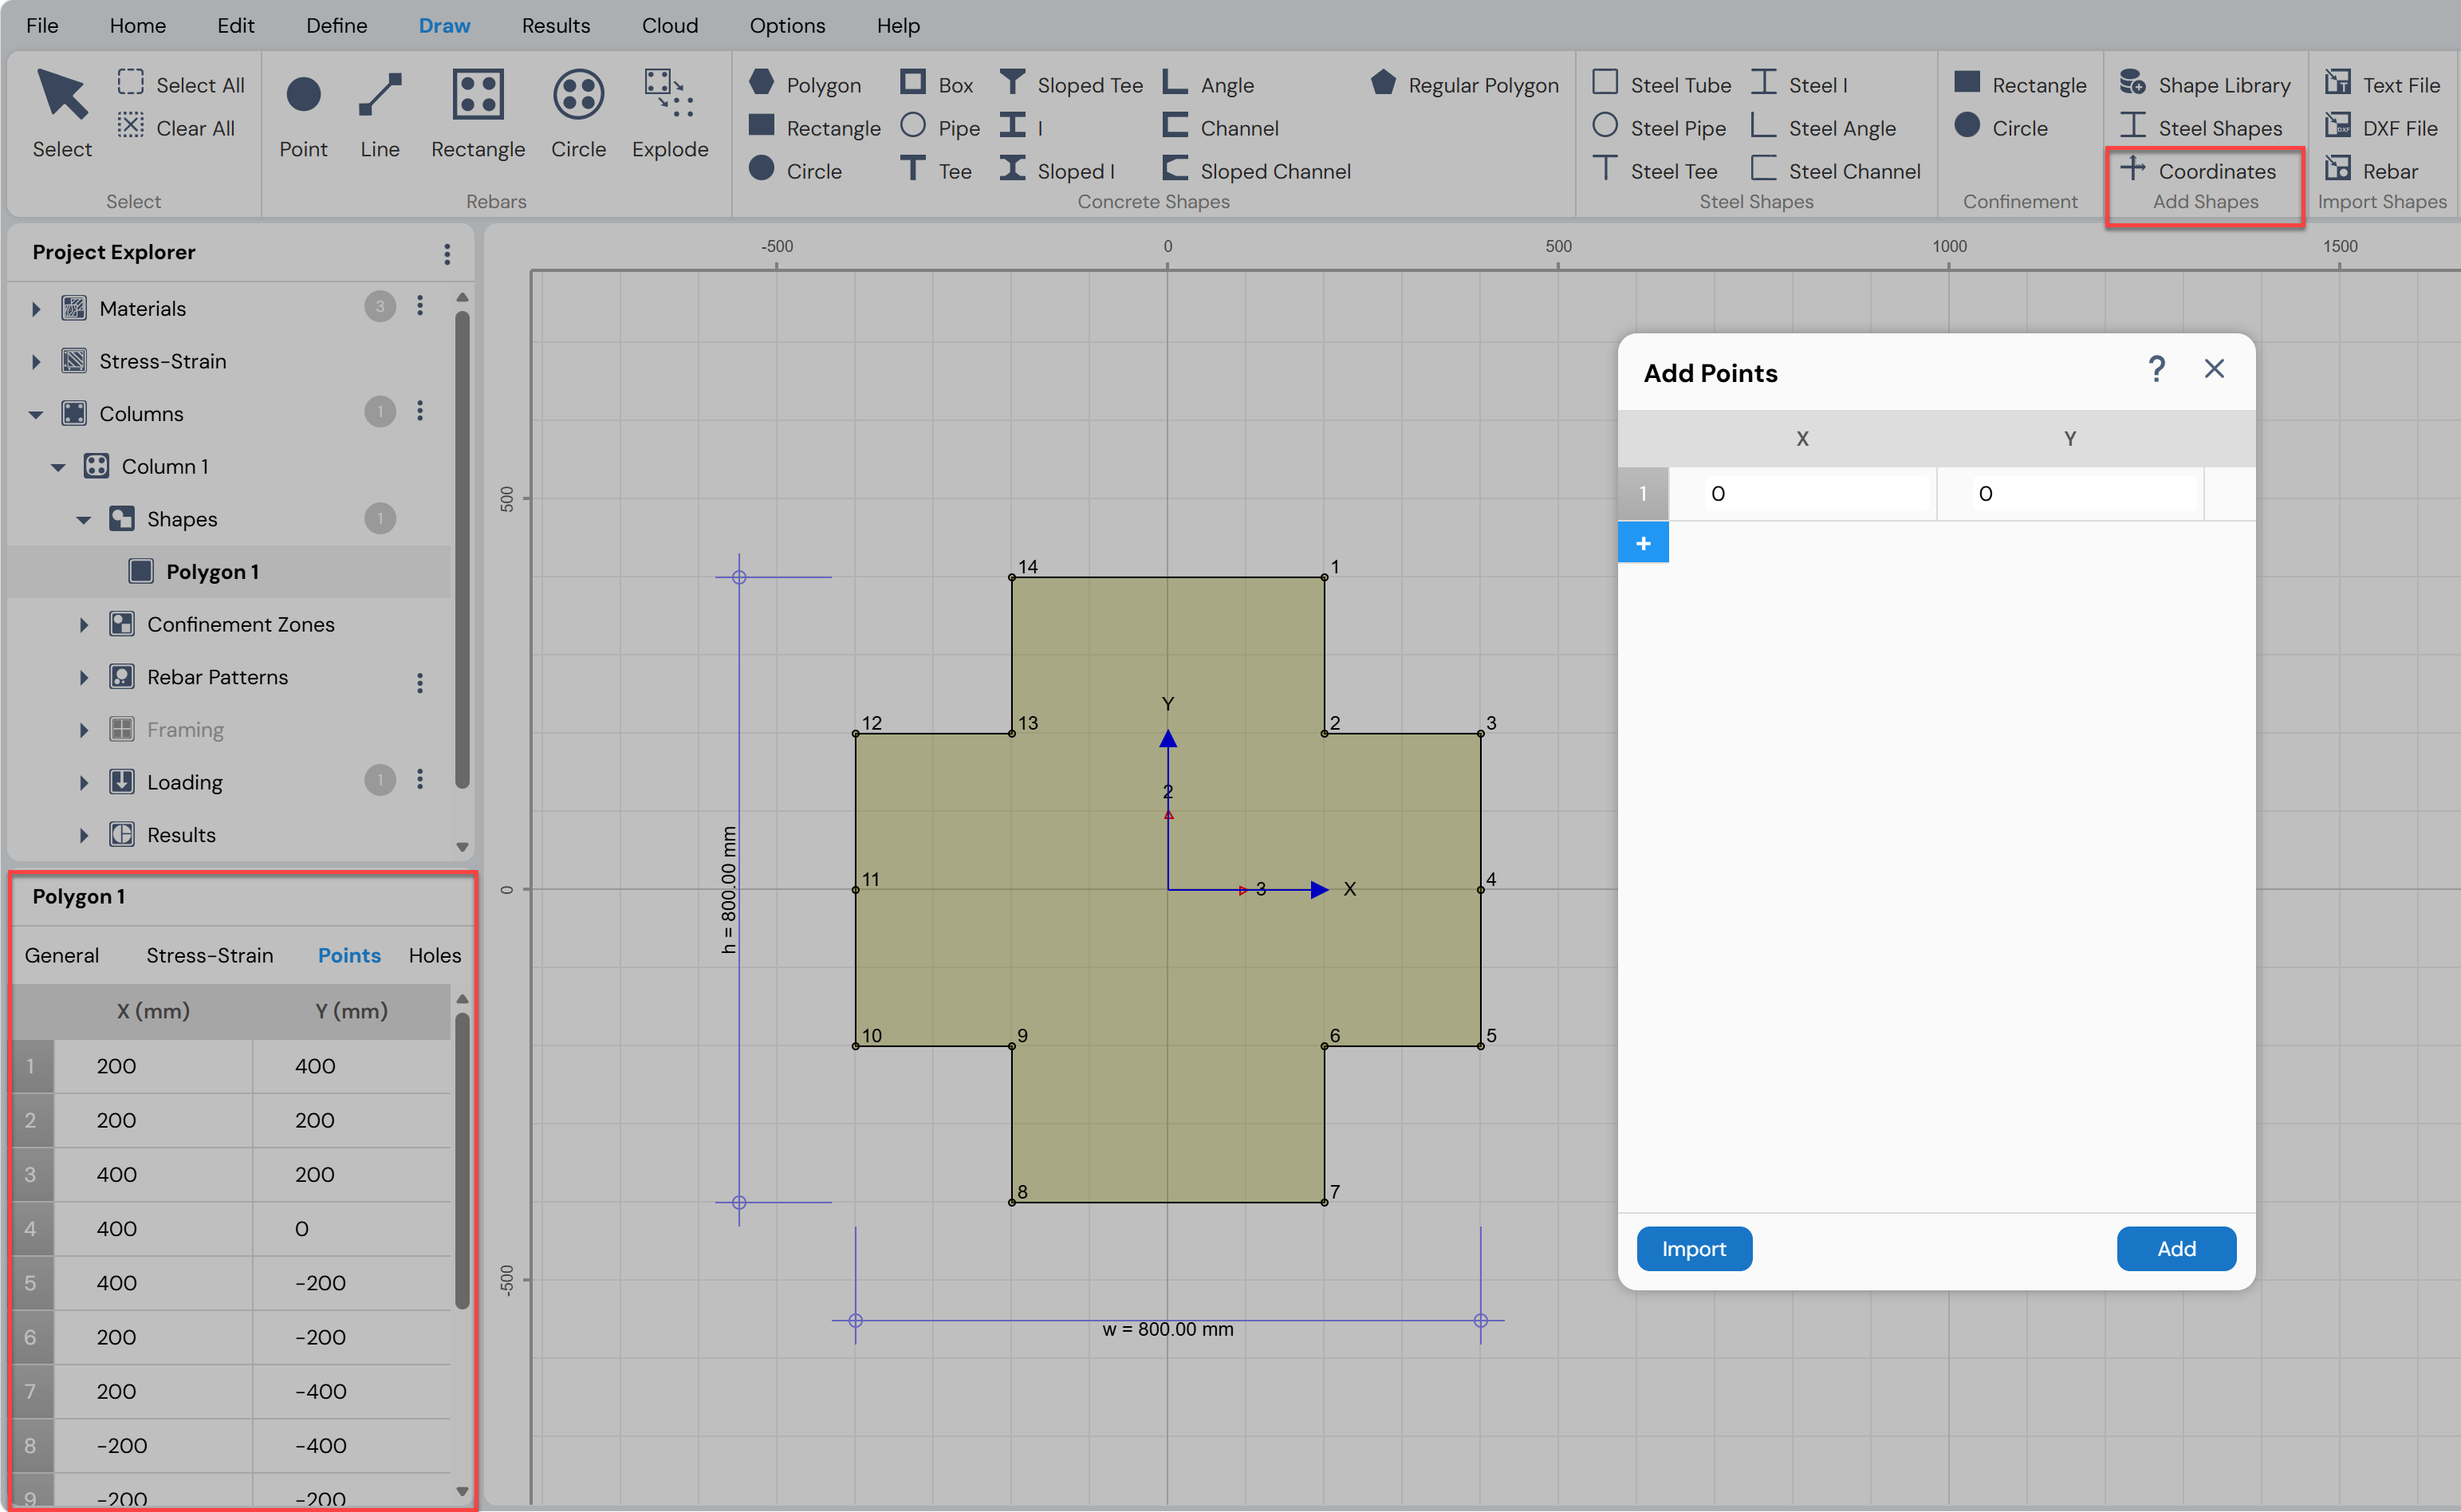
Figure: Adding Shapes using Coordinates in Draw Menu
Add Shape by Importing a DXF File
Column Designer allows users to import custom shapes from DXF files created in AutoCAD.
To import a shape:
Use Draw Menu → Import Shapes → DXF File
Select the DXF file containing the shape
Note:
This feature is intended only for importing shapes.
Rebar layouts cannot be imported using a DXF file.
Export Shapes
Column Designer allows users to export shapes for use in external drafting and CAD applications.
To export a shape:
Use Draw Menu → Export → Export Section as DXF File
Select the desired shape or section
Save the file in DXF format
The exported DXF file can be opened and edited using AutoCAD or other compatible CAD software.
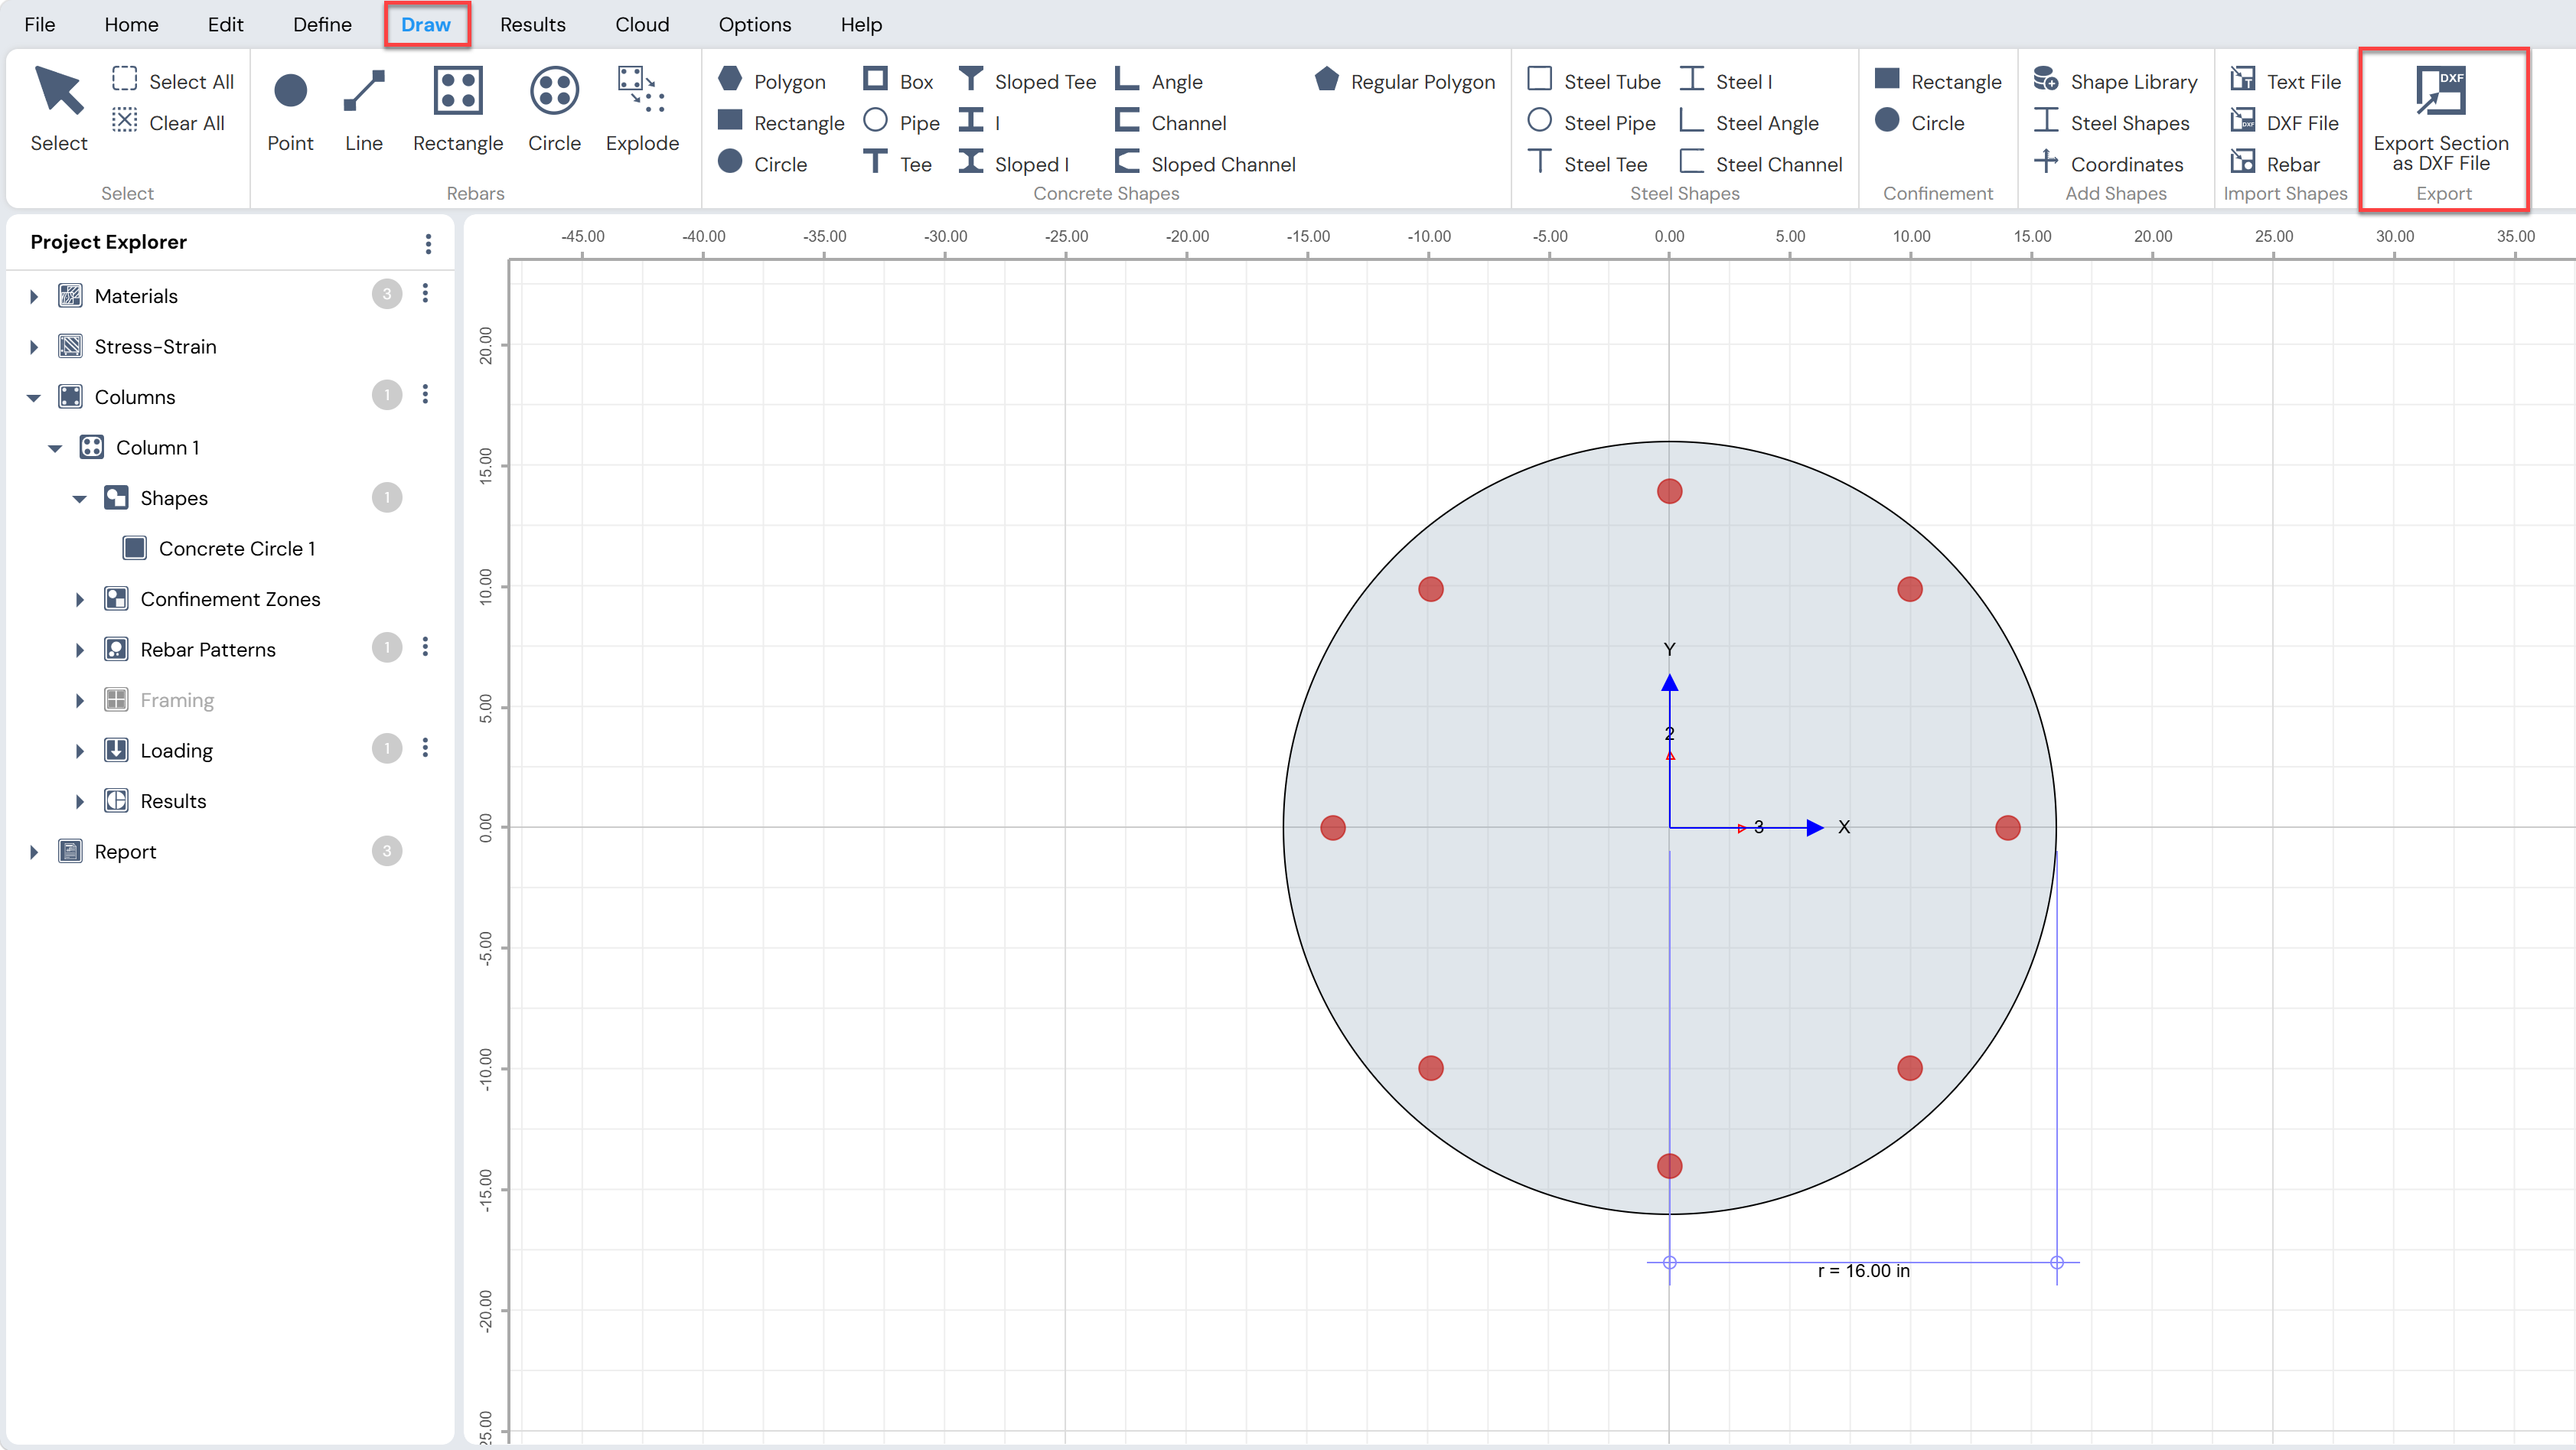
Figure: Exporting Shapes Option in Draw Menu
Add Rebars
Reinforcement bars can be added to a column section using different patterns as required.
Rebar placement tools are available under Draw Menu → Rebars.
The available rebar drawing options are described below.
Rebar Drawing Options
- Point
Use this option to draw a single rebar by clicking at the desired location in the working area.
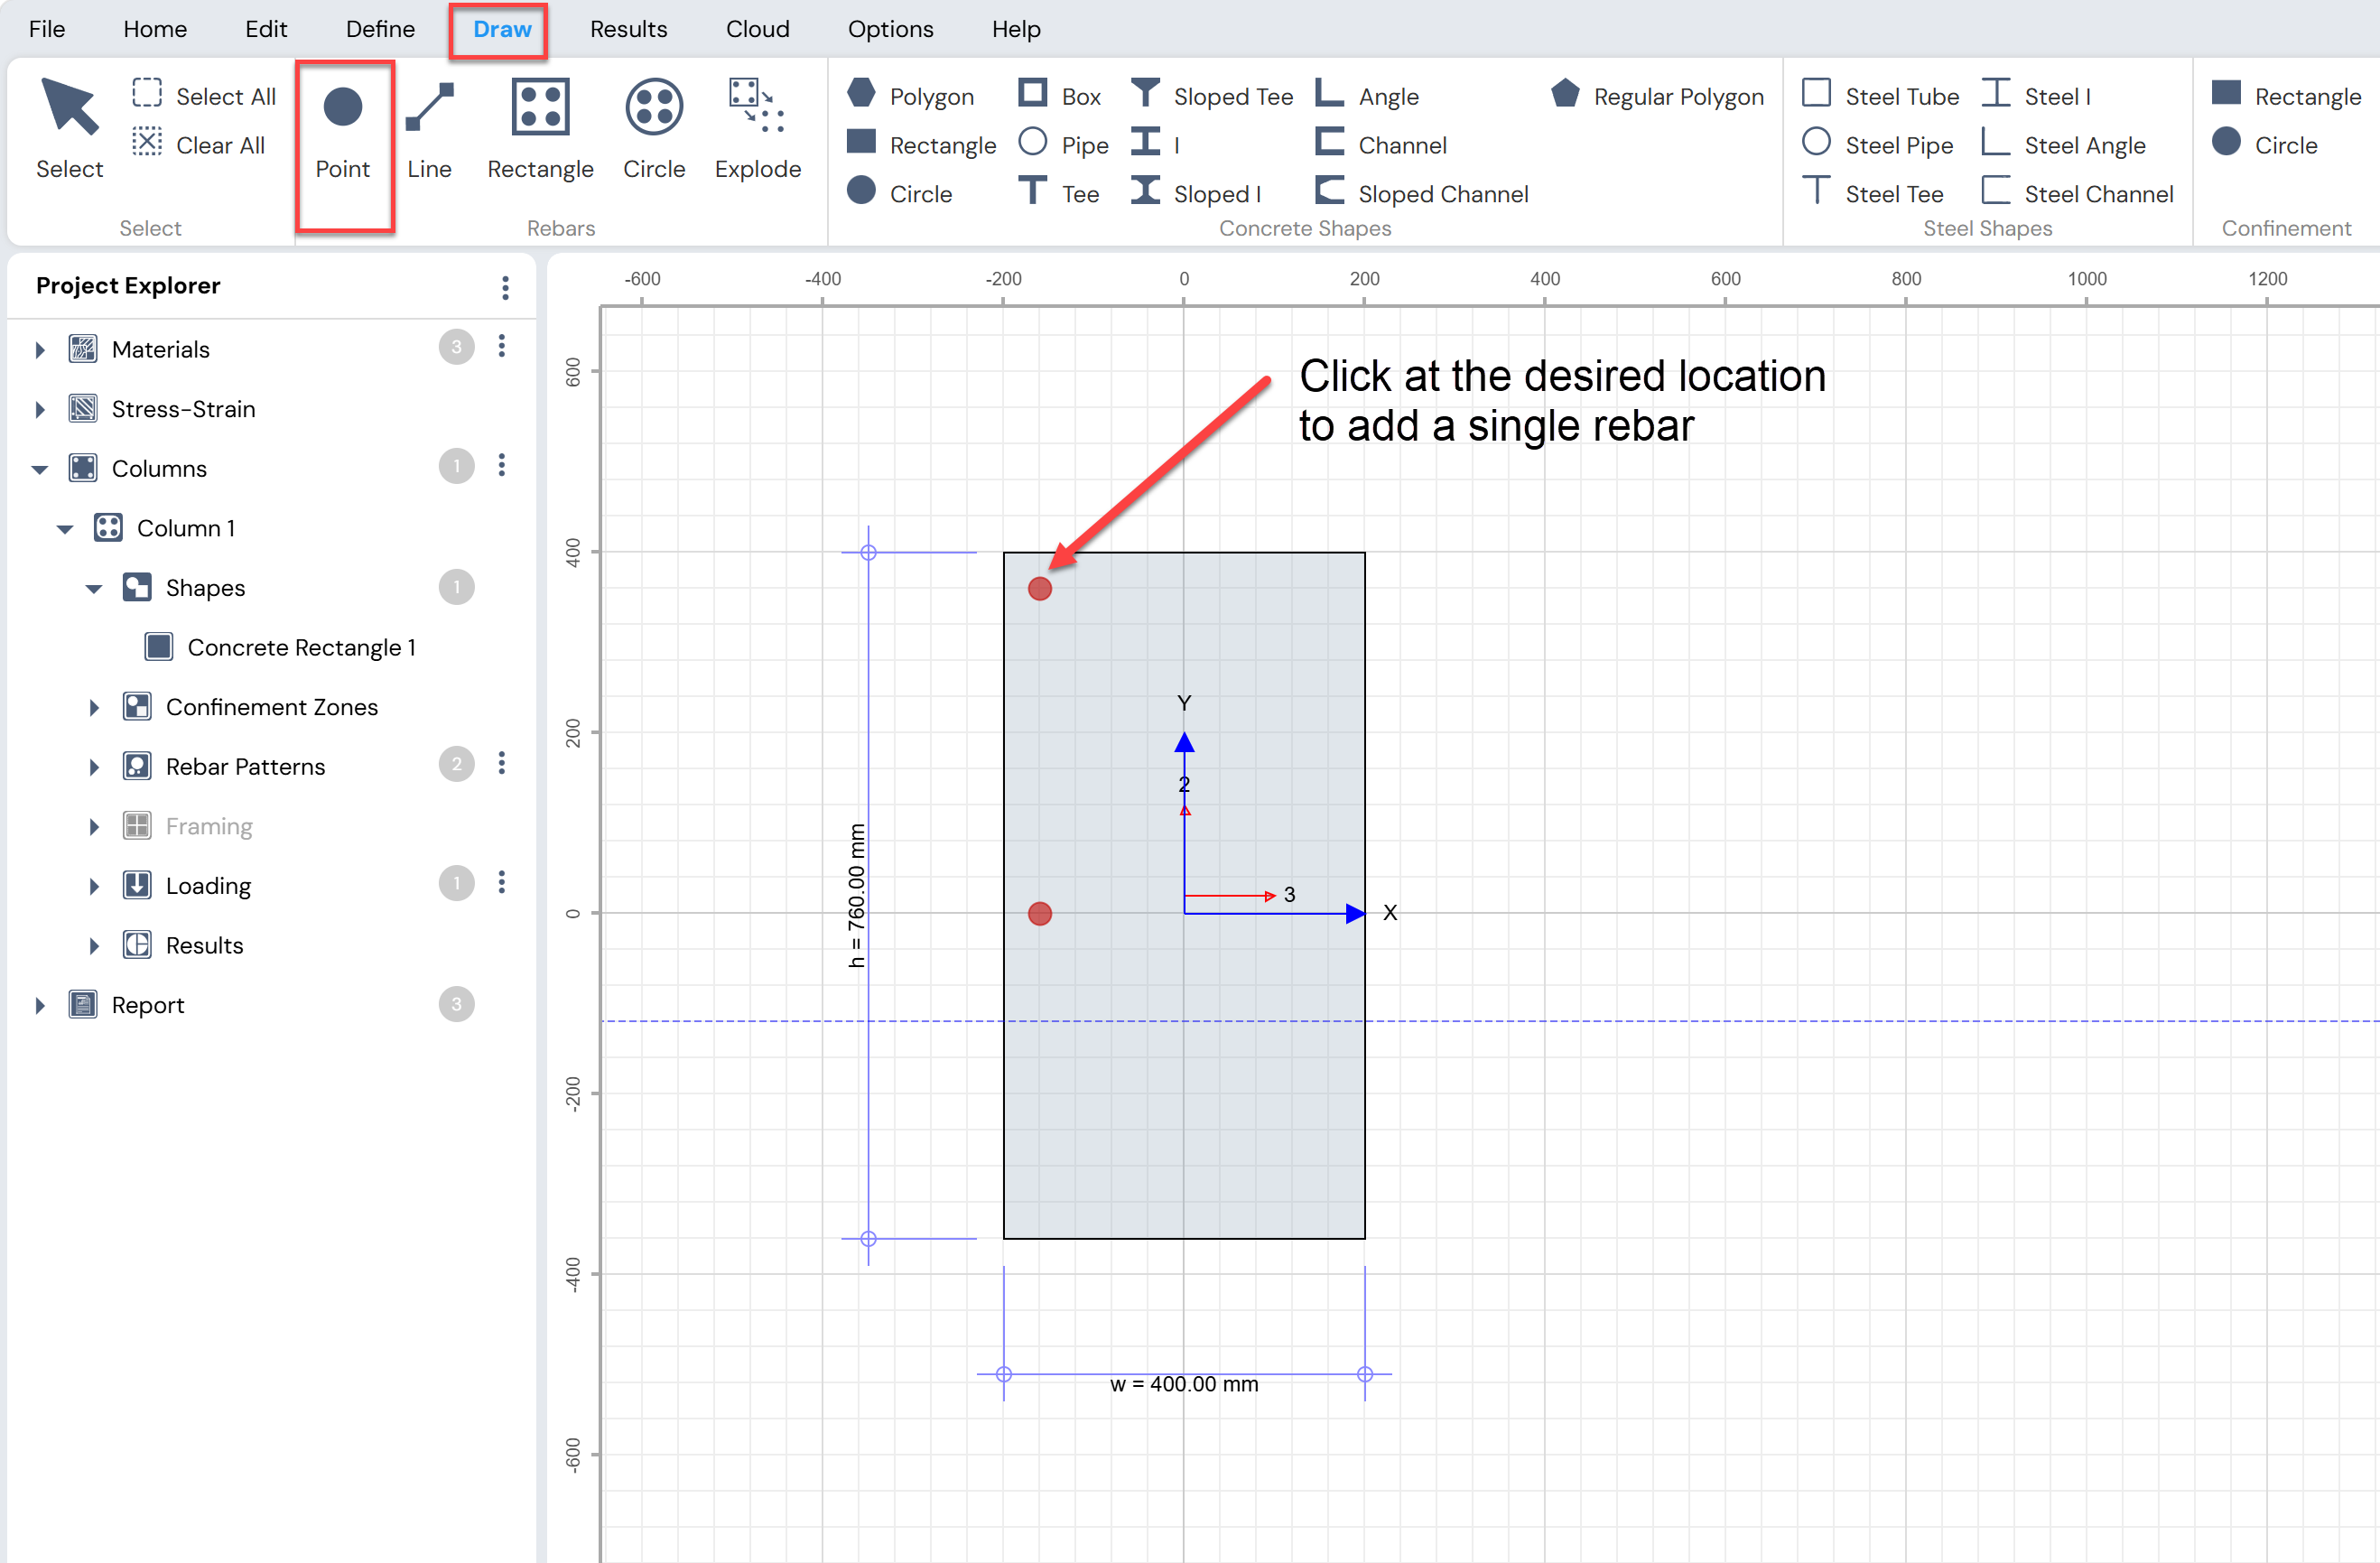
Figure: Single Rebar Drawing Using Point Option in Draw Menu
- Line
Use this option to draw a line of rebars along a specified direction.
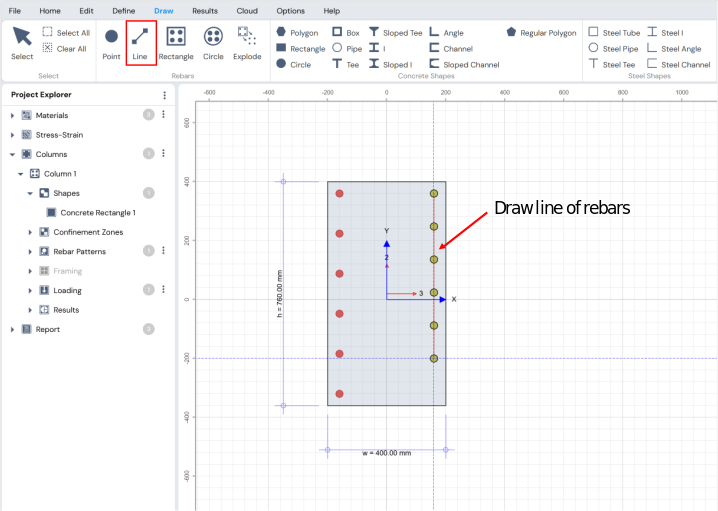
Figure: Drawing Multiple Rebars Using Line Option in Draw Menu
Rectangle
Use this option to draw rebars arranged in a rectangular pattern.Circle
Use this option to draw rebars arranged in a circular pattern.
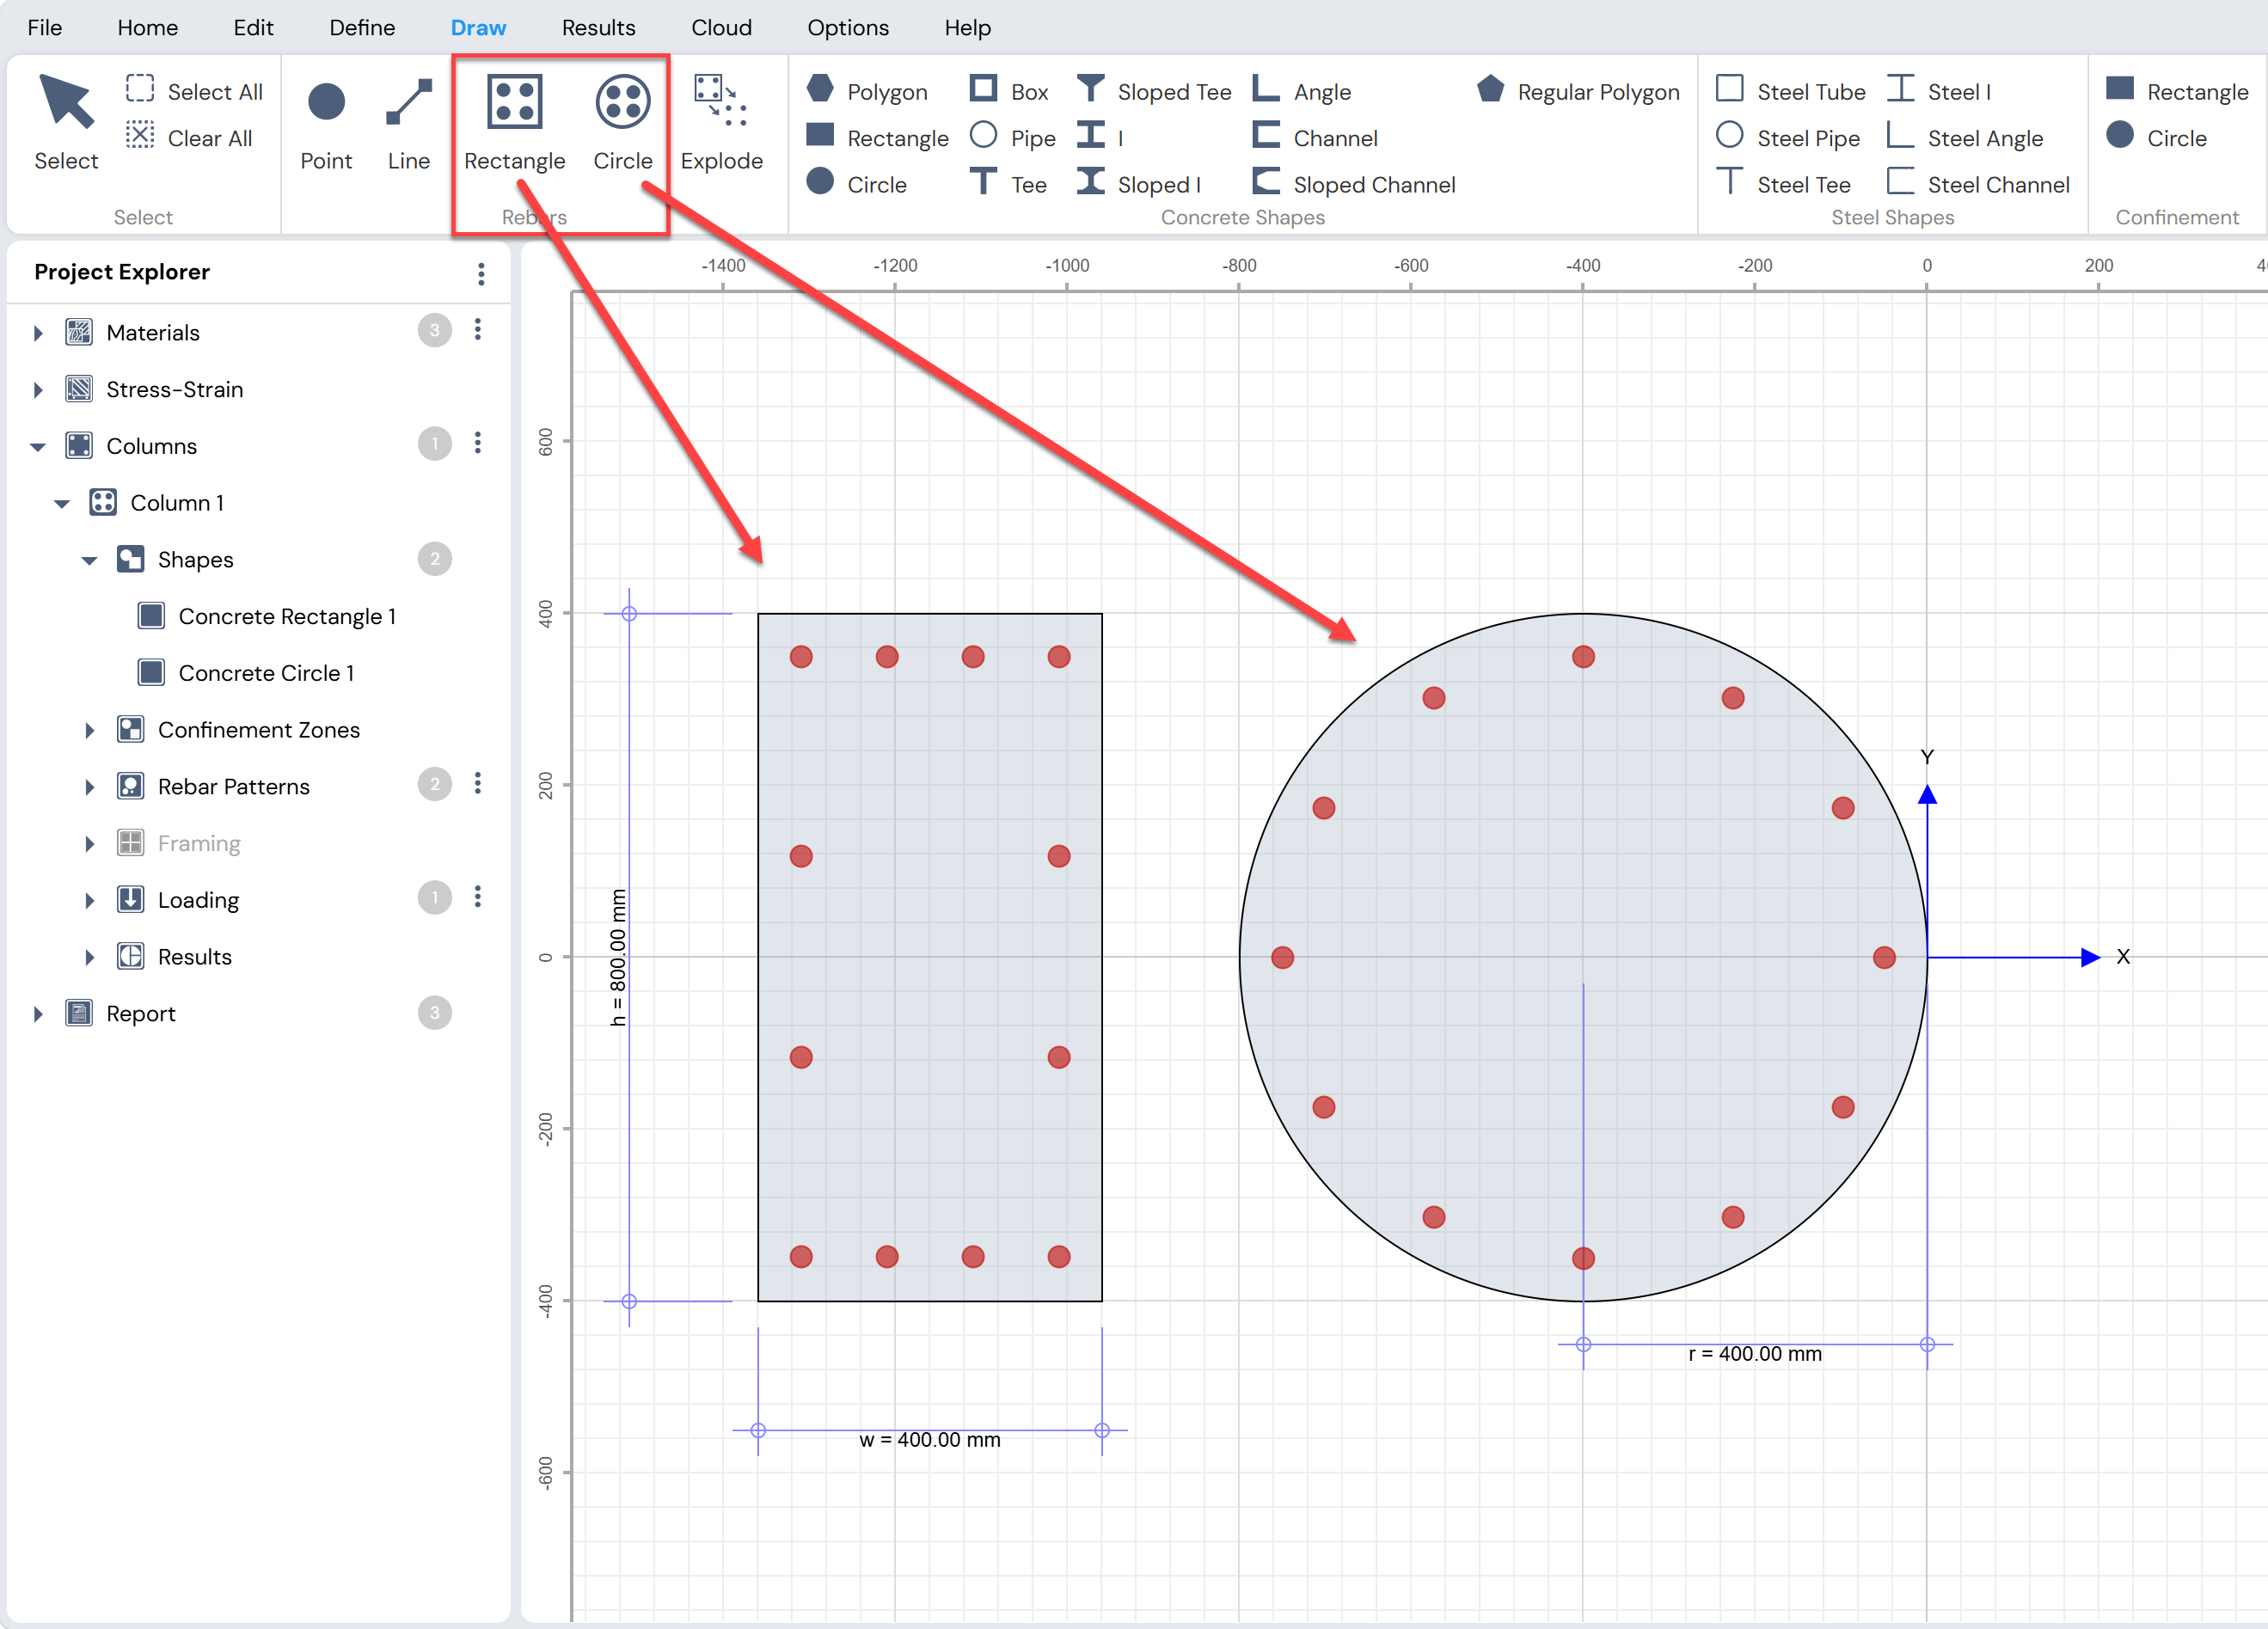
Figure: Drawing Rectangular/Circular Rebar Pattern Option in Draw Menu
Import Rebars
Rebars can also be imported from an external file by clicking:
Draw Menu → Import Shapes → Rebar
This option allows reinforcement to be imported from a CSV file.
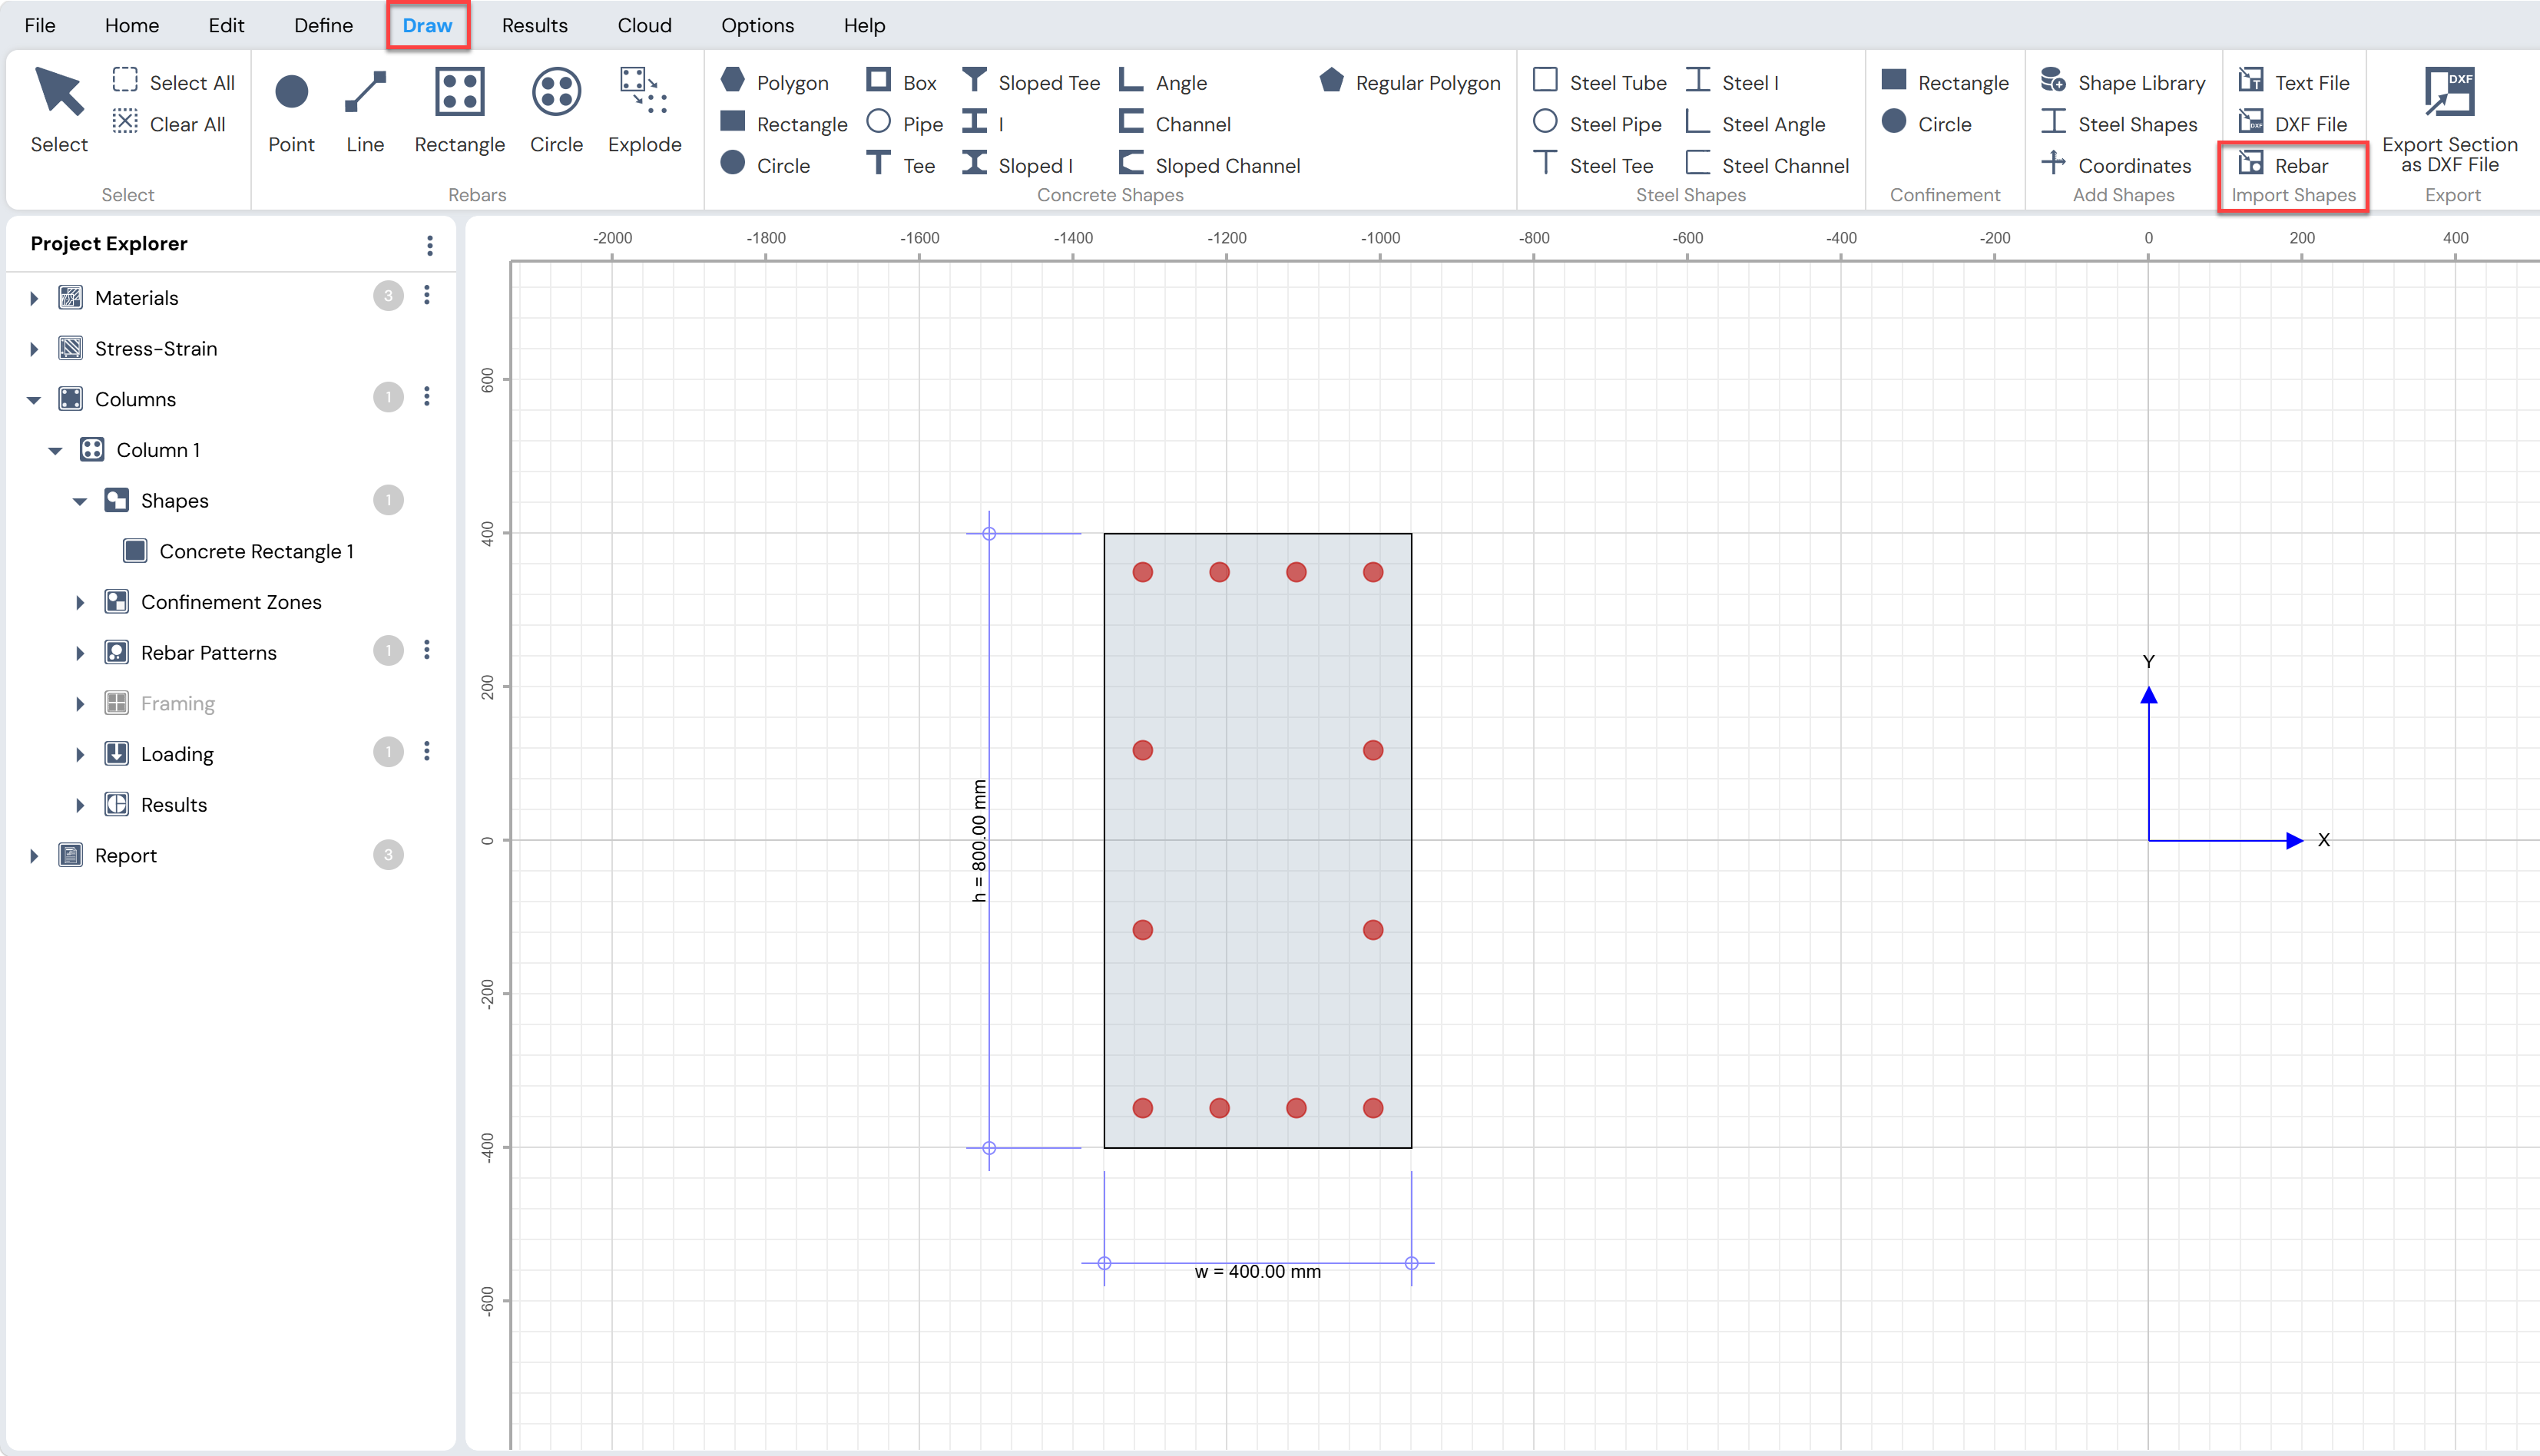
Figure: Import Rebar Option in Draw Menu
Important Notes on Rebars
The following parameters can be modified using the Property Grid:
Number of rebars in a pattern
Clear cover
Minimum clear spacing
The Property Grid is activated by:
Clicking on a rebar in the working area, or
Selecting a rebar pattern from Project Explorer → Columns → Rebar Patterns
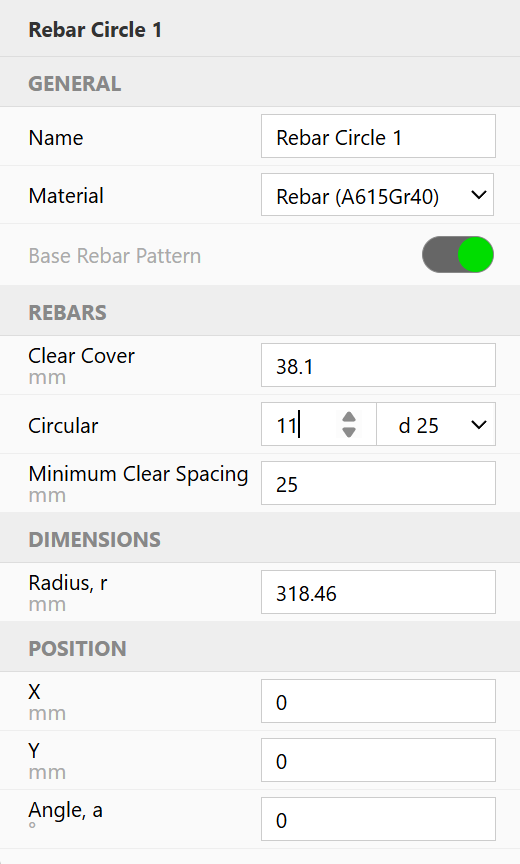
Figure: Property Grid for rebars
- In Column Designer, clear cover is defined as the distance up to the outer edge of the main reinforcement bar.
Base Rebar Pattern
The Base Rebar Pattern assignment is required for the calculation of magnified moments.
Key rules for Base Rebar Pattern assignment:
By default, the first rebar or rebar layout drawn is assigned as the Base Rebar Pattern under the General tab of the Property Grid.
This field can be toggled only when two or more rebar layouts exist in the section.
Assigning a rebar layout as the Base Rebar Pattern automatically removes this assignment from the previously assigned layout.
If the rebar layout currently assigned as the Base Rebar Pattern is deleted, the first rebar layout in the drawing order is automatically assigned as the new Base Rebar Pattern.
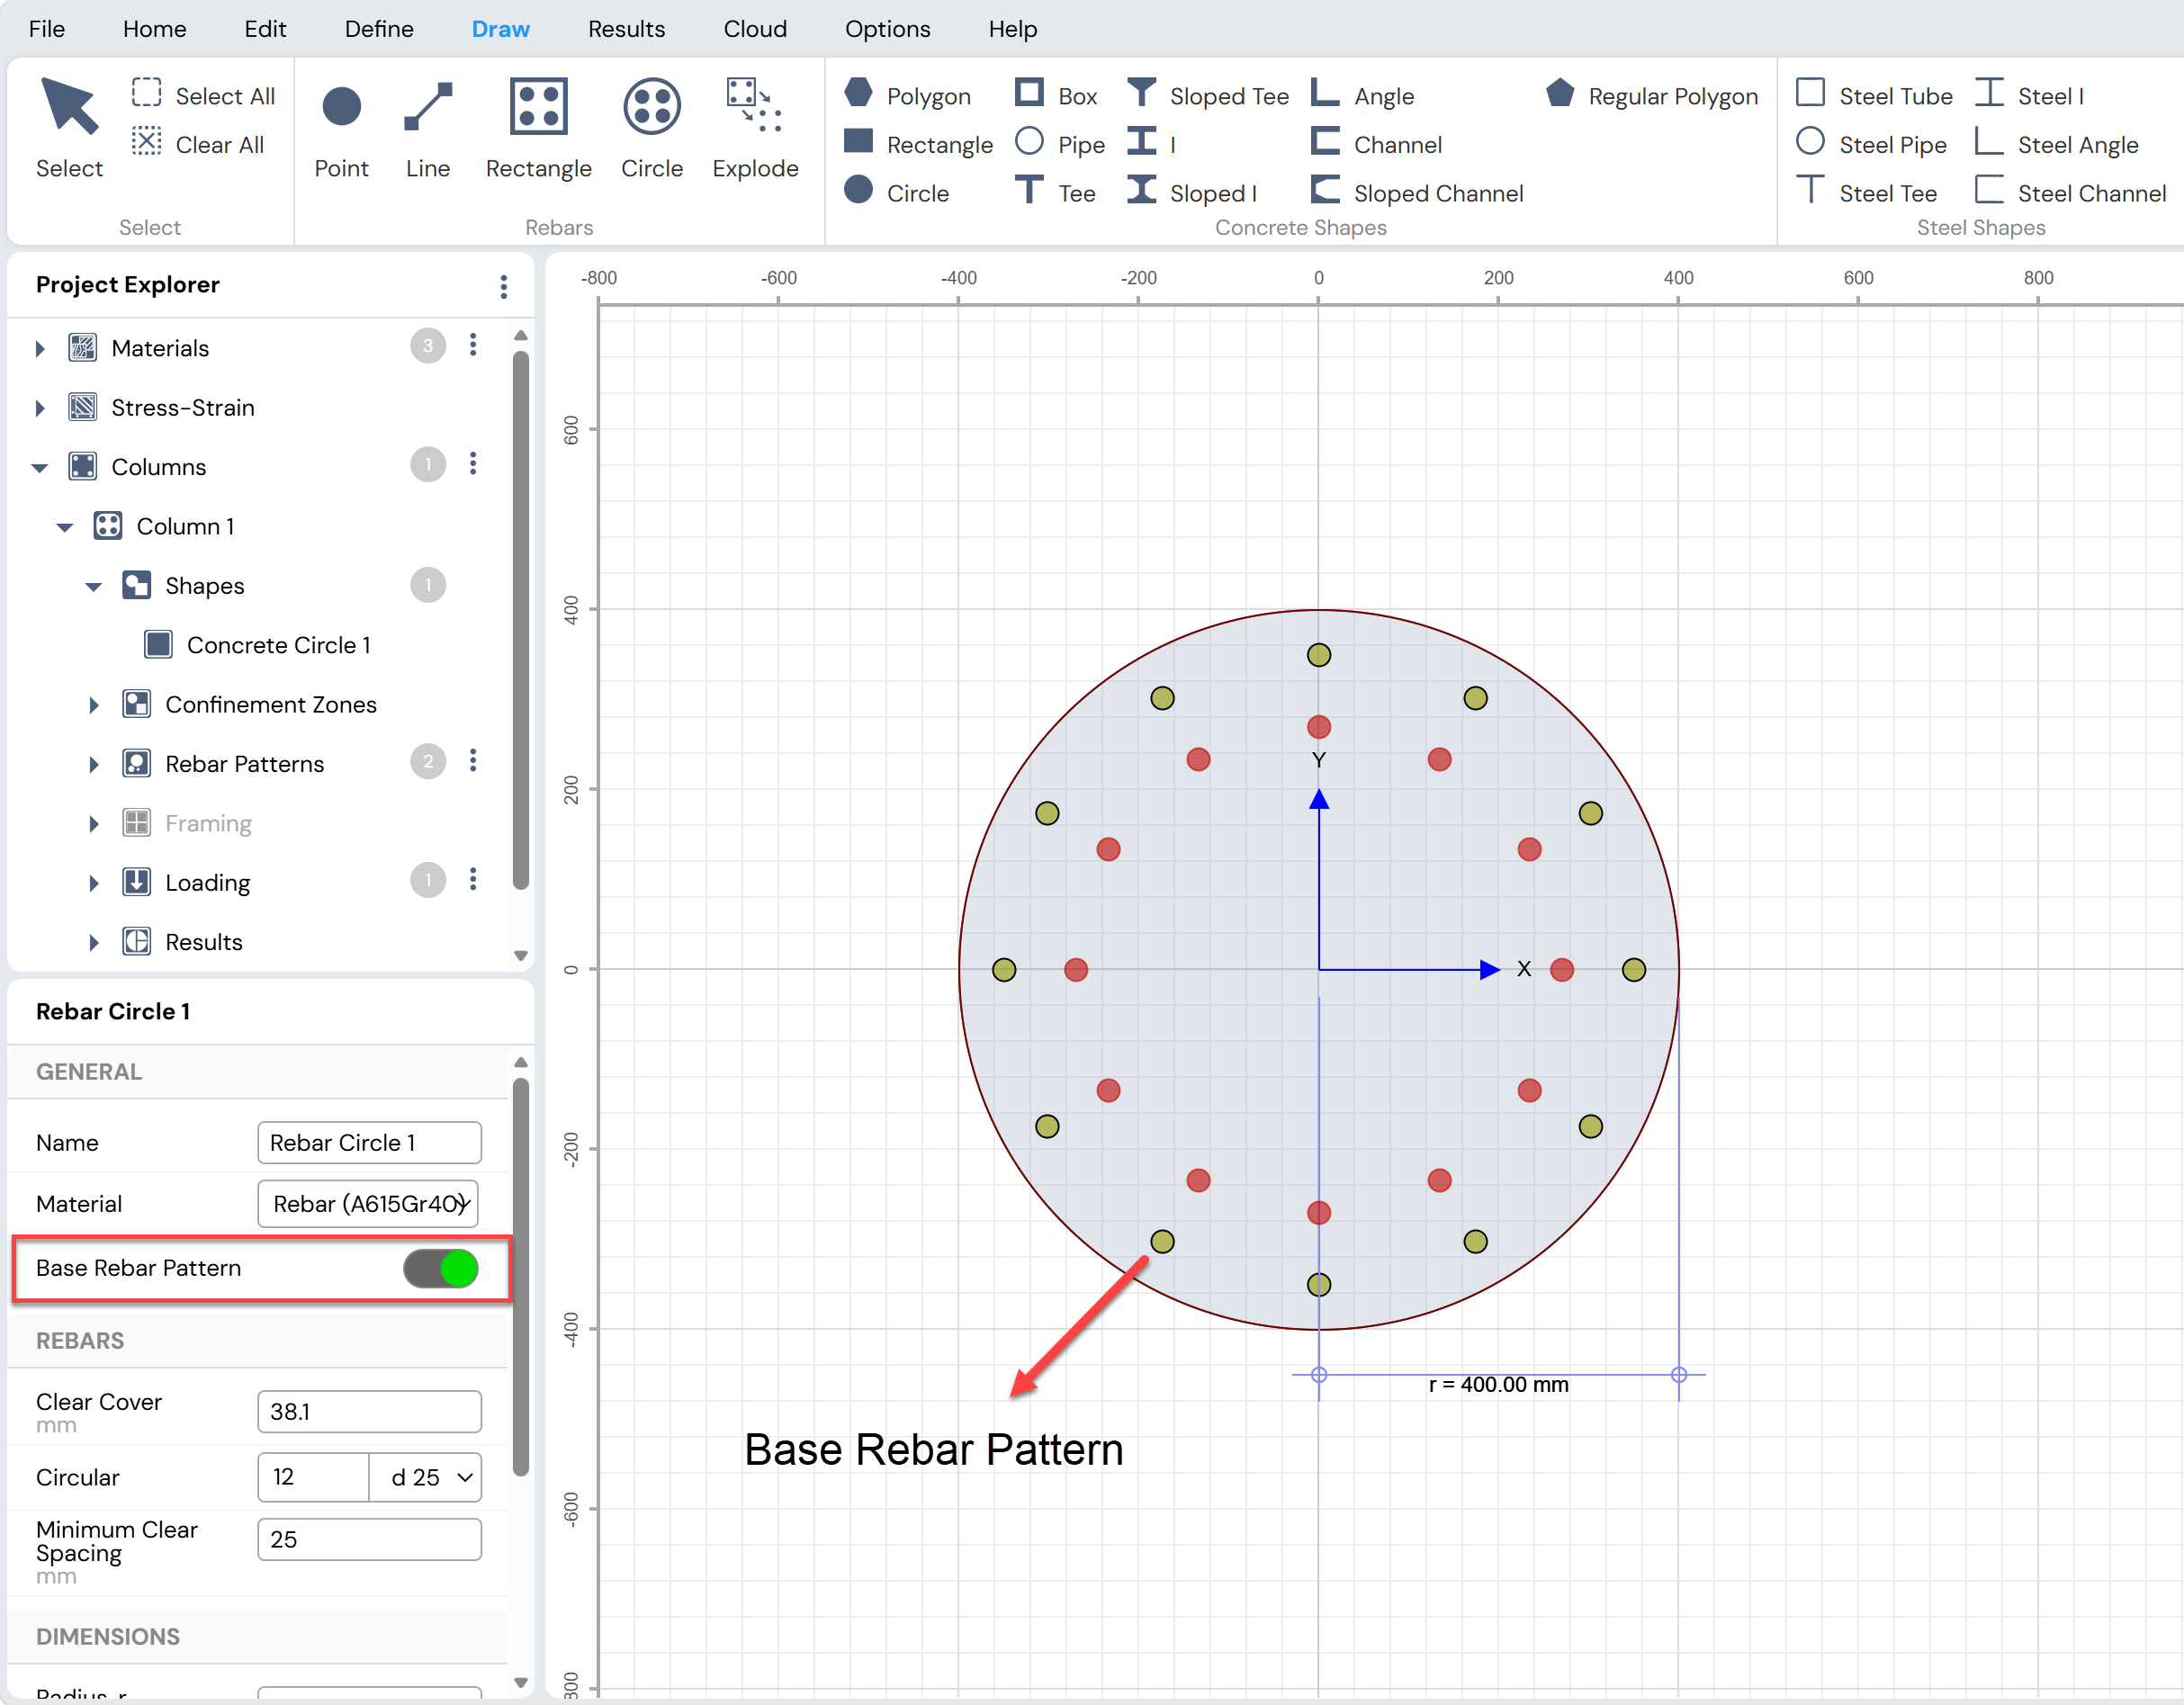
Figure: Base Rebar Pattern Option
Explode Rebar Patterns
The Explode Rebar Patterns feature allows a rebar pattern to be broken into its individual rebar points.
To explode a rebar pattern:
- Use Draw Menu → Rebar → Explode
After exploding a rebar pattern:
Each rebar is converted into an independent rebar point
Individual rebars can be selected, moved, edited, or deleted separately
This feature is useful when fine control over individual reinforcement placement is required.
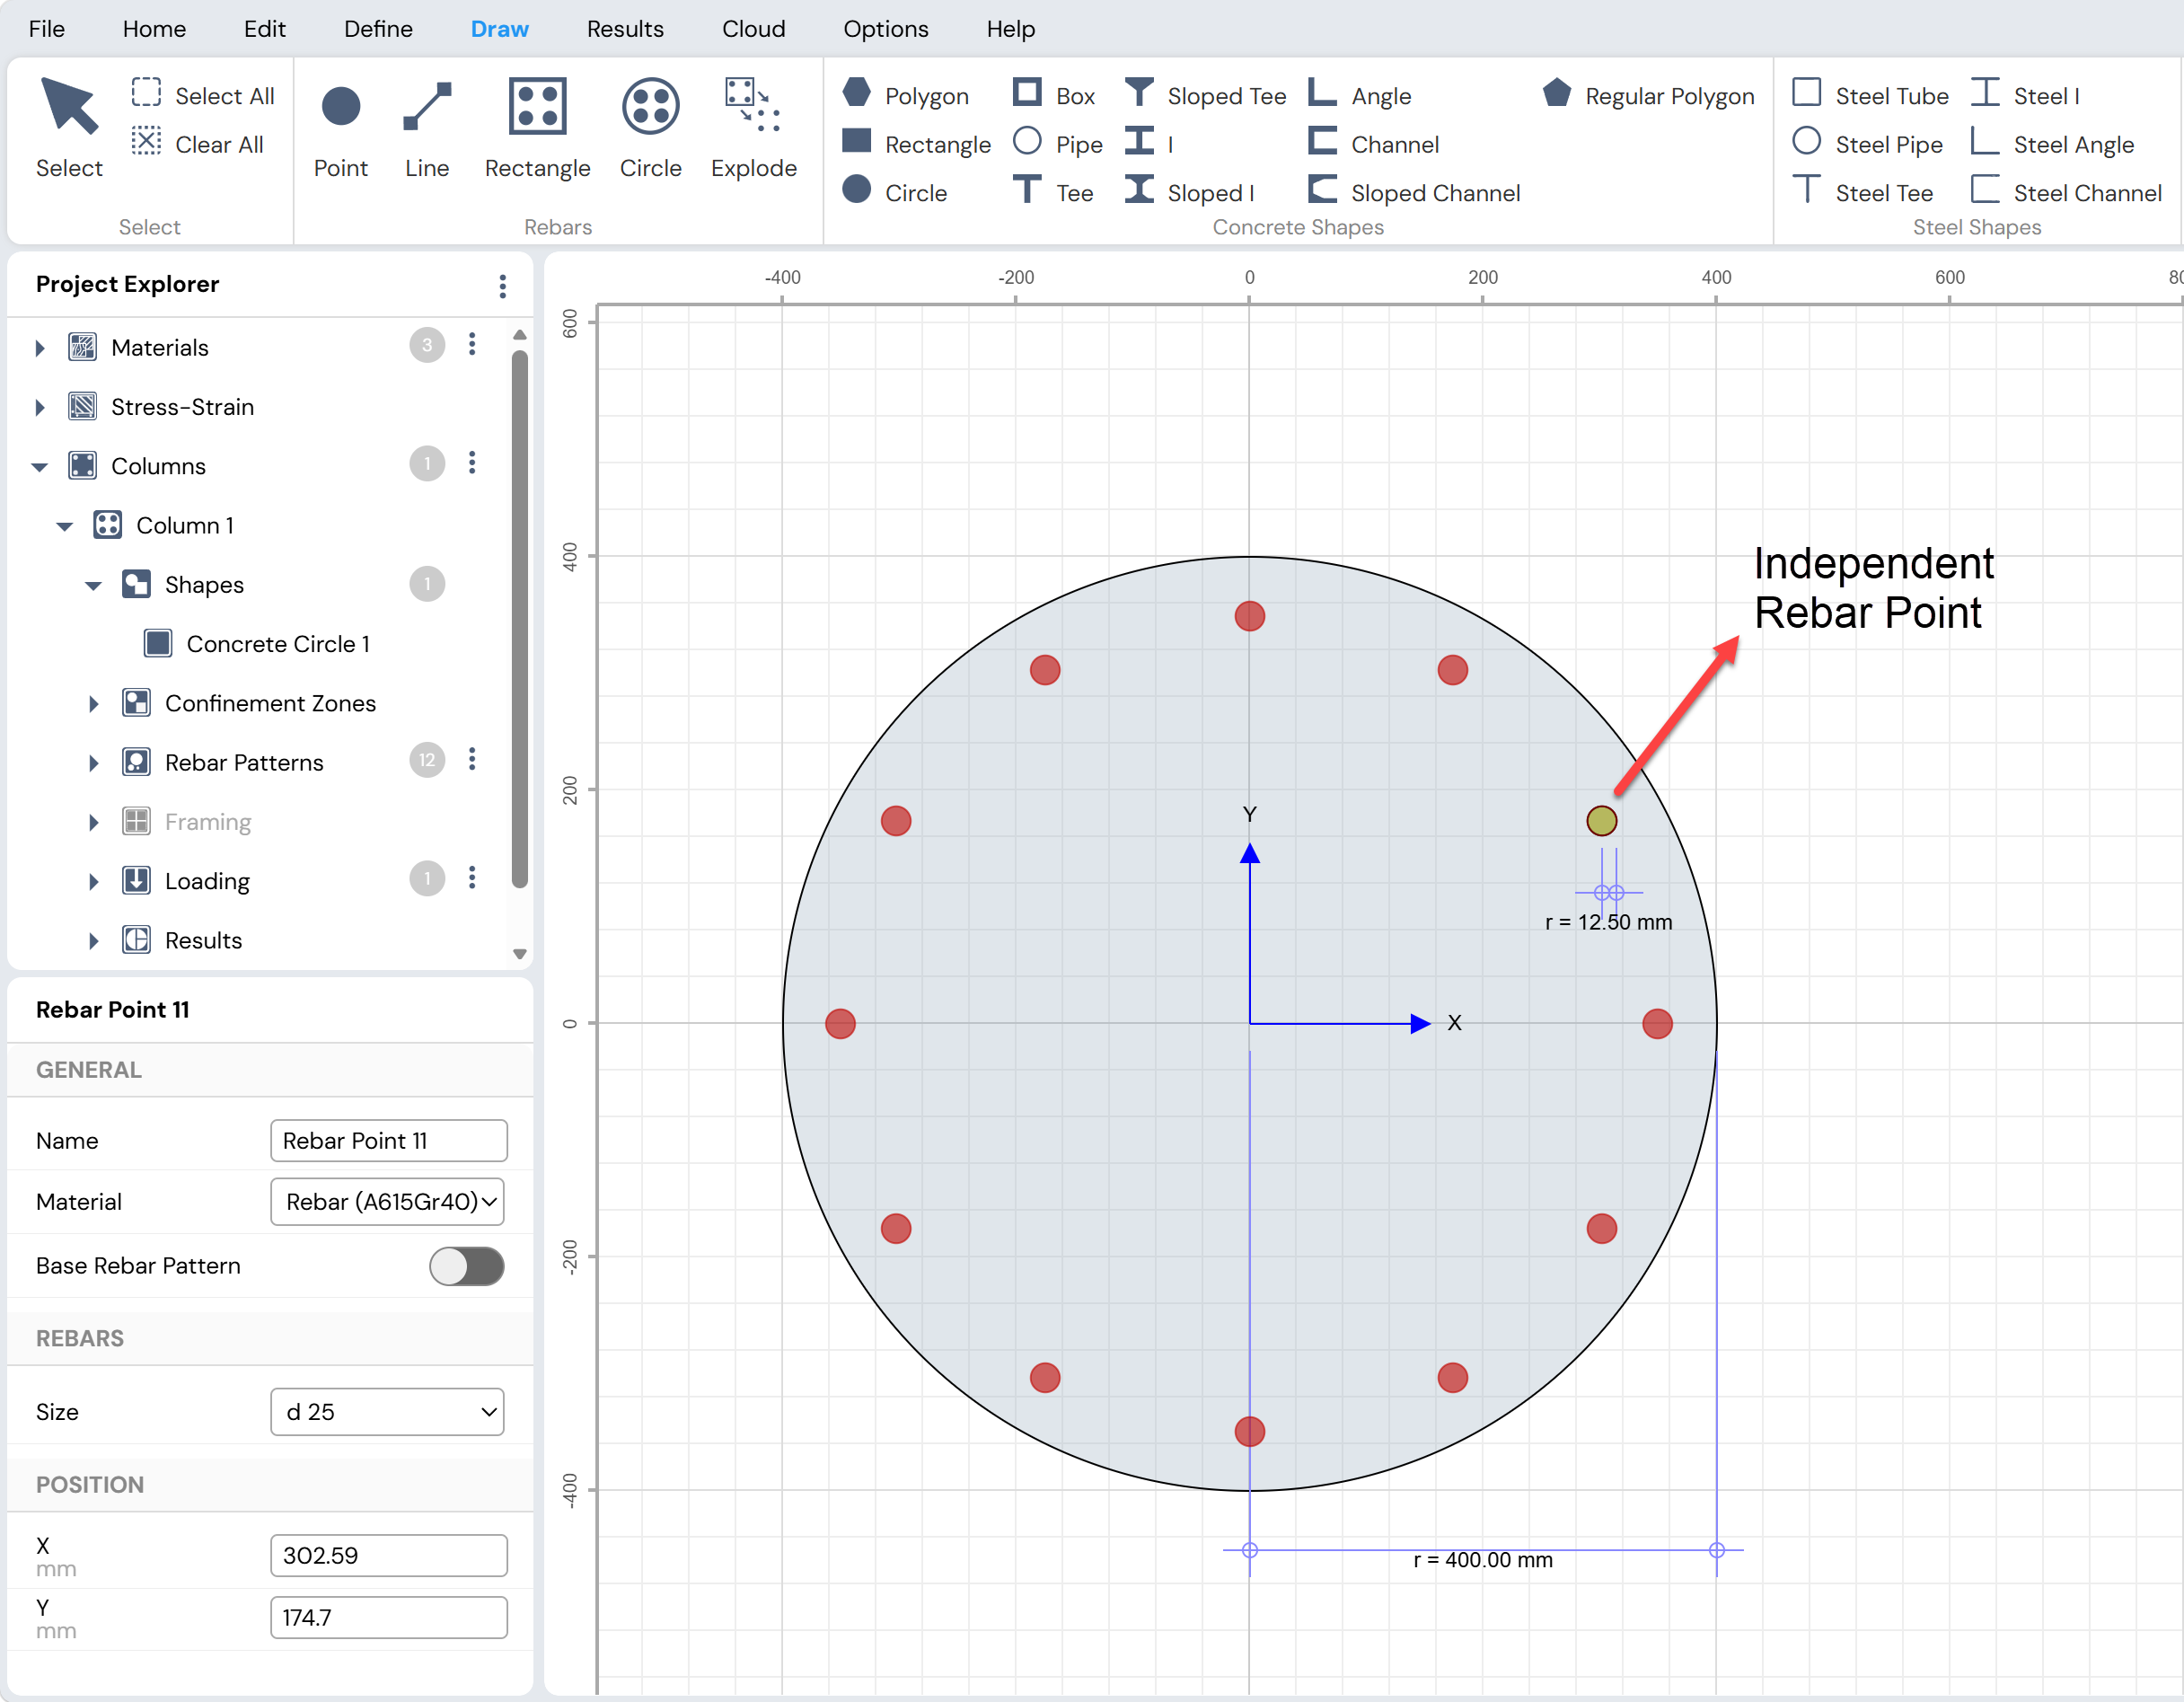
Figure: Explode Rebar Pattern Option to convert Patterns in to Individual Points
Add Columns to Project File
Columns can be managed within the Project File using the Define Column form.
To access the Define Column form:
Use Define Menu → Project → Columns, or
Click the button next to Project Explorer → Columns
The Define Column form allows the user to:
Add new columns to the Project File
Rename existing columns
Remove columns from the Project File
Columns stored in the Project File can be viewed and modified by selecting the desired column from Project Explorer → Columns.
Note on Imported Columns
When columns are imported from ETABS, the Define Menu → Project → Columns option displays a tabular view containing information about all imported columns.
This table provides a convenient way to review and manage multiple imported columns.
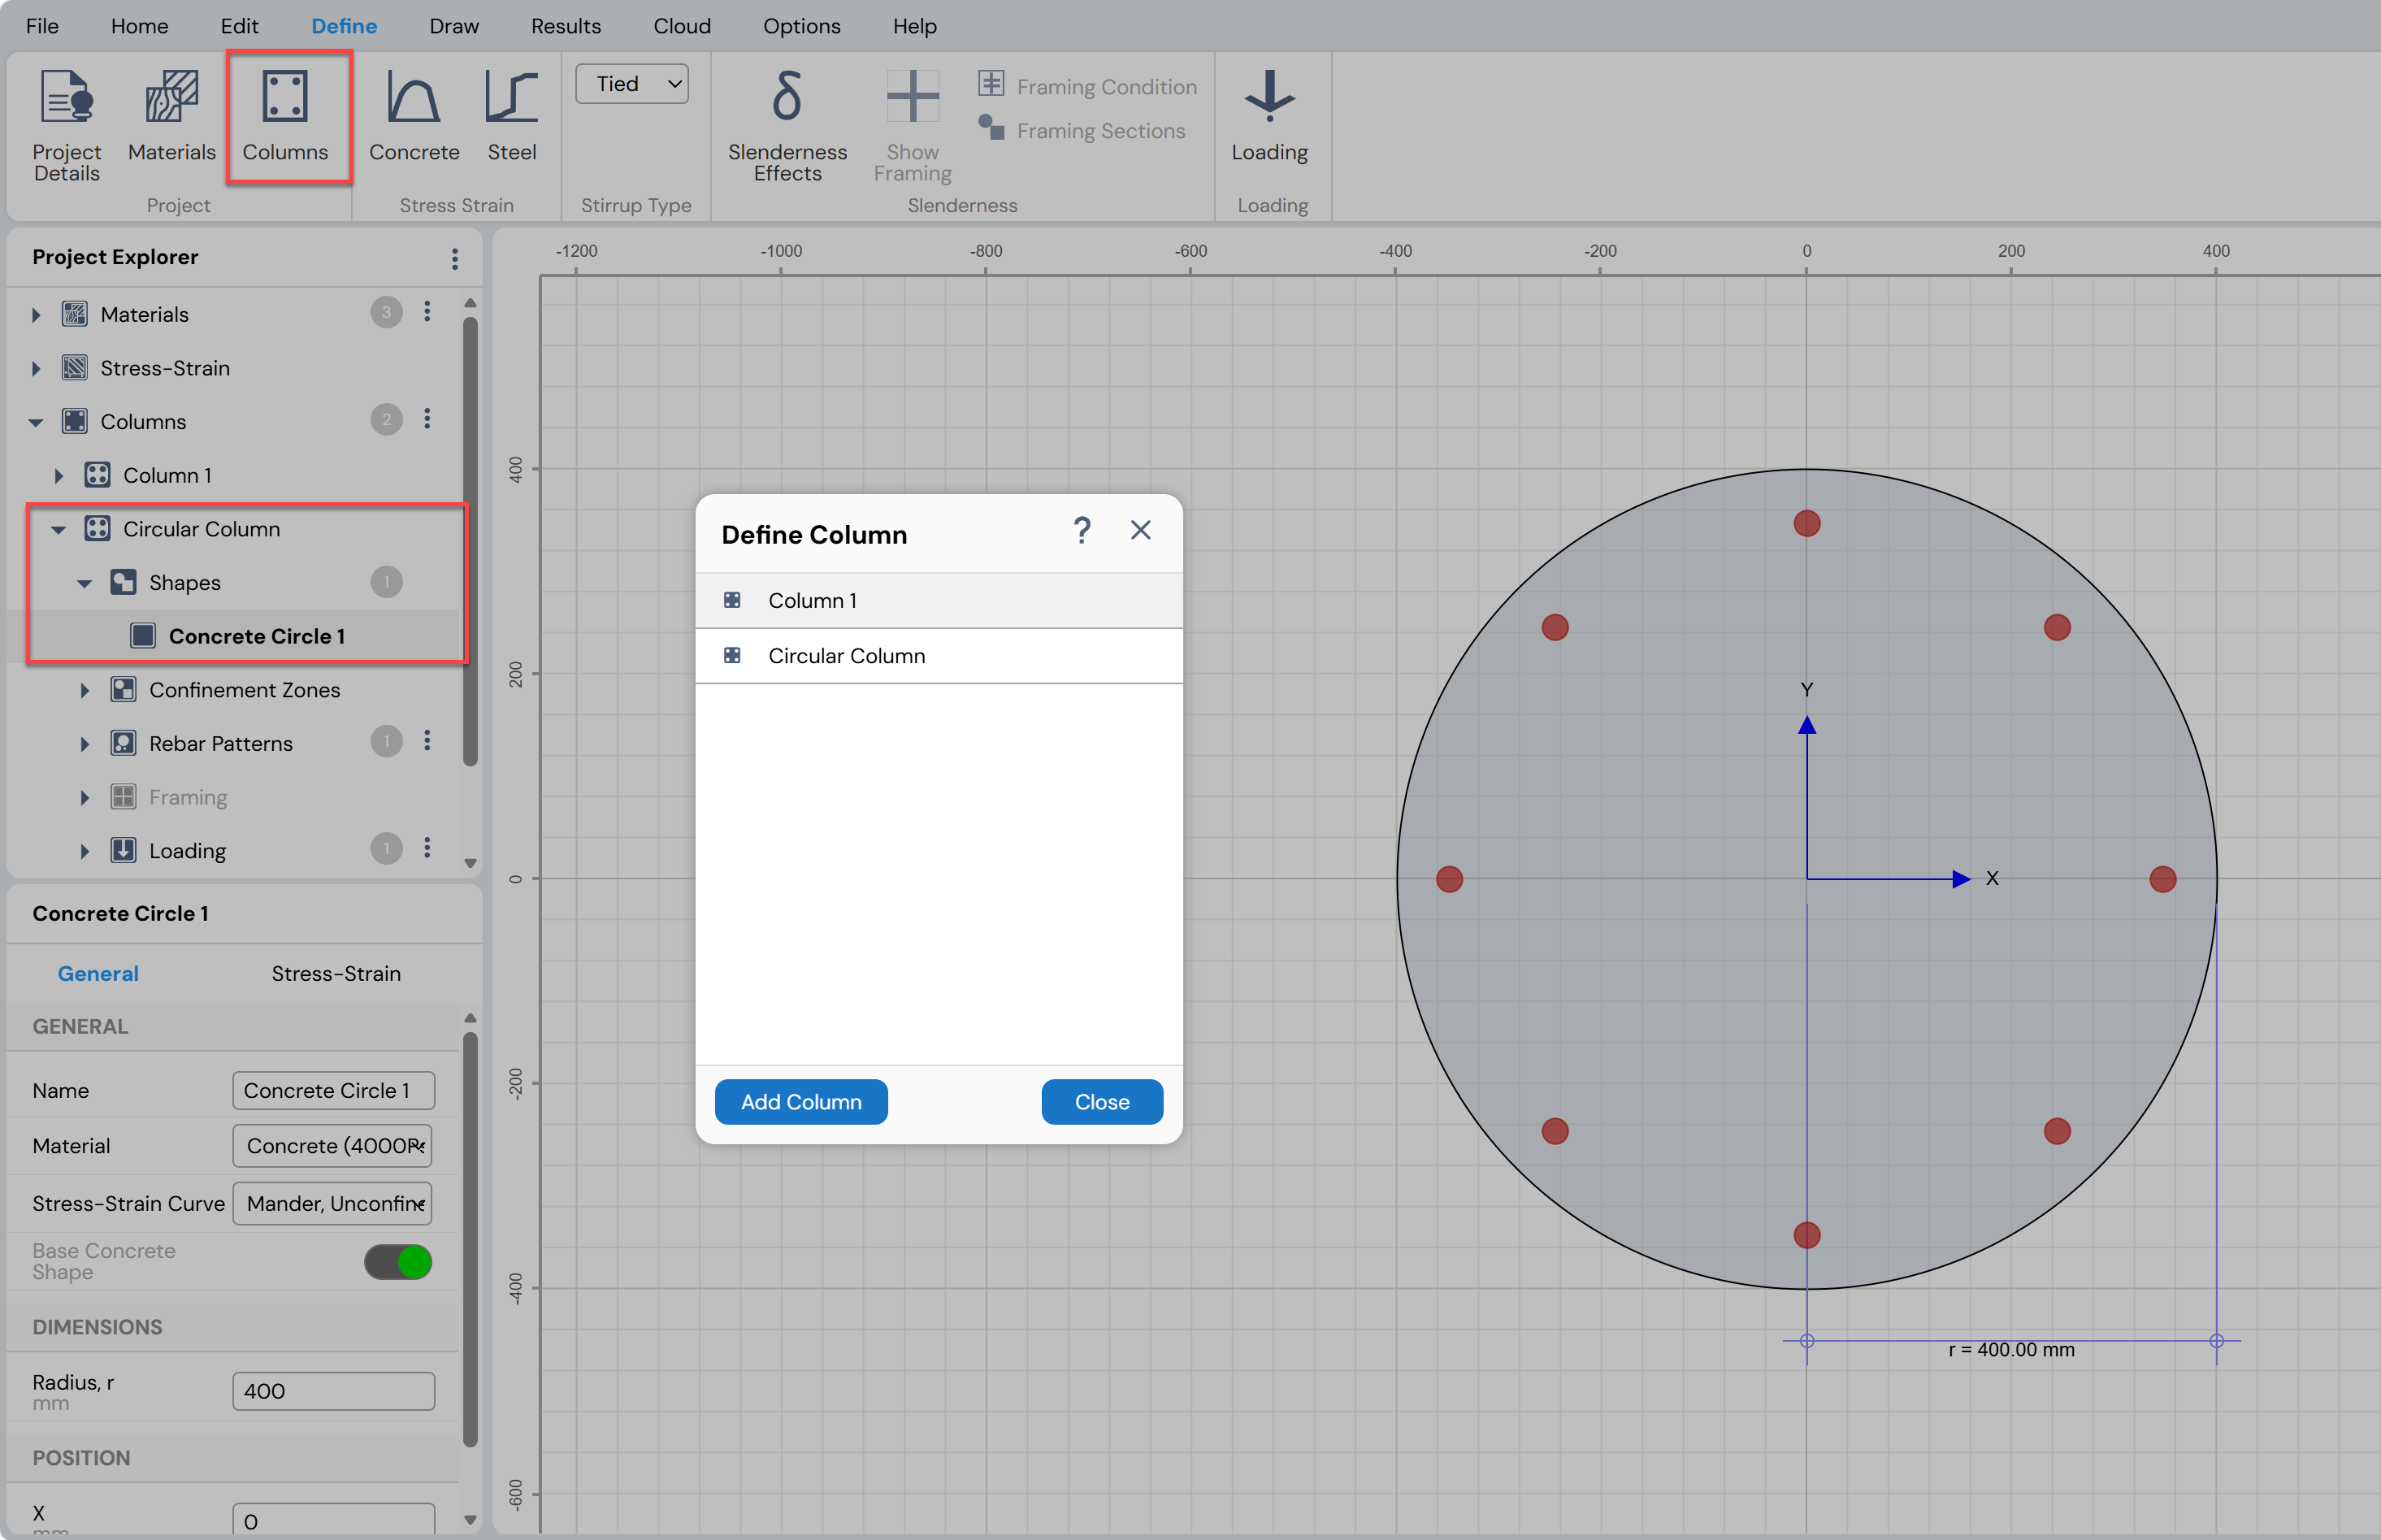
Figure: Add Columns to Project File Feature
Create Composite Columns
Composite columns can be created by placing shapes made of different materials directly over one another in the desired configuration.
It is not necessary to create holes before overlapping shapes. Column Designer automatically accounts for overlapping areas when computing section properties and performing analysis and design.
The procedure for moving and positioning shapes within a section is described in Editing Column Cross sections.
Note on Composite Sections
For composite sections:
Concrete is considered the base material
Transformed section properties are reported in the Results
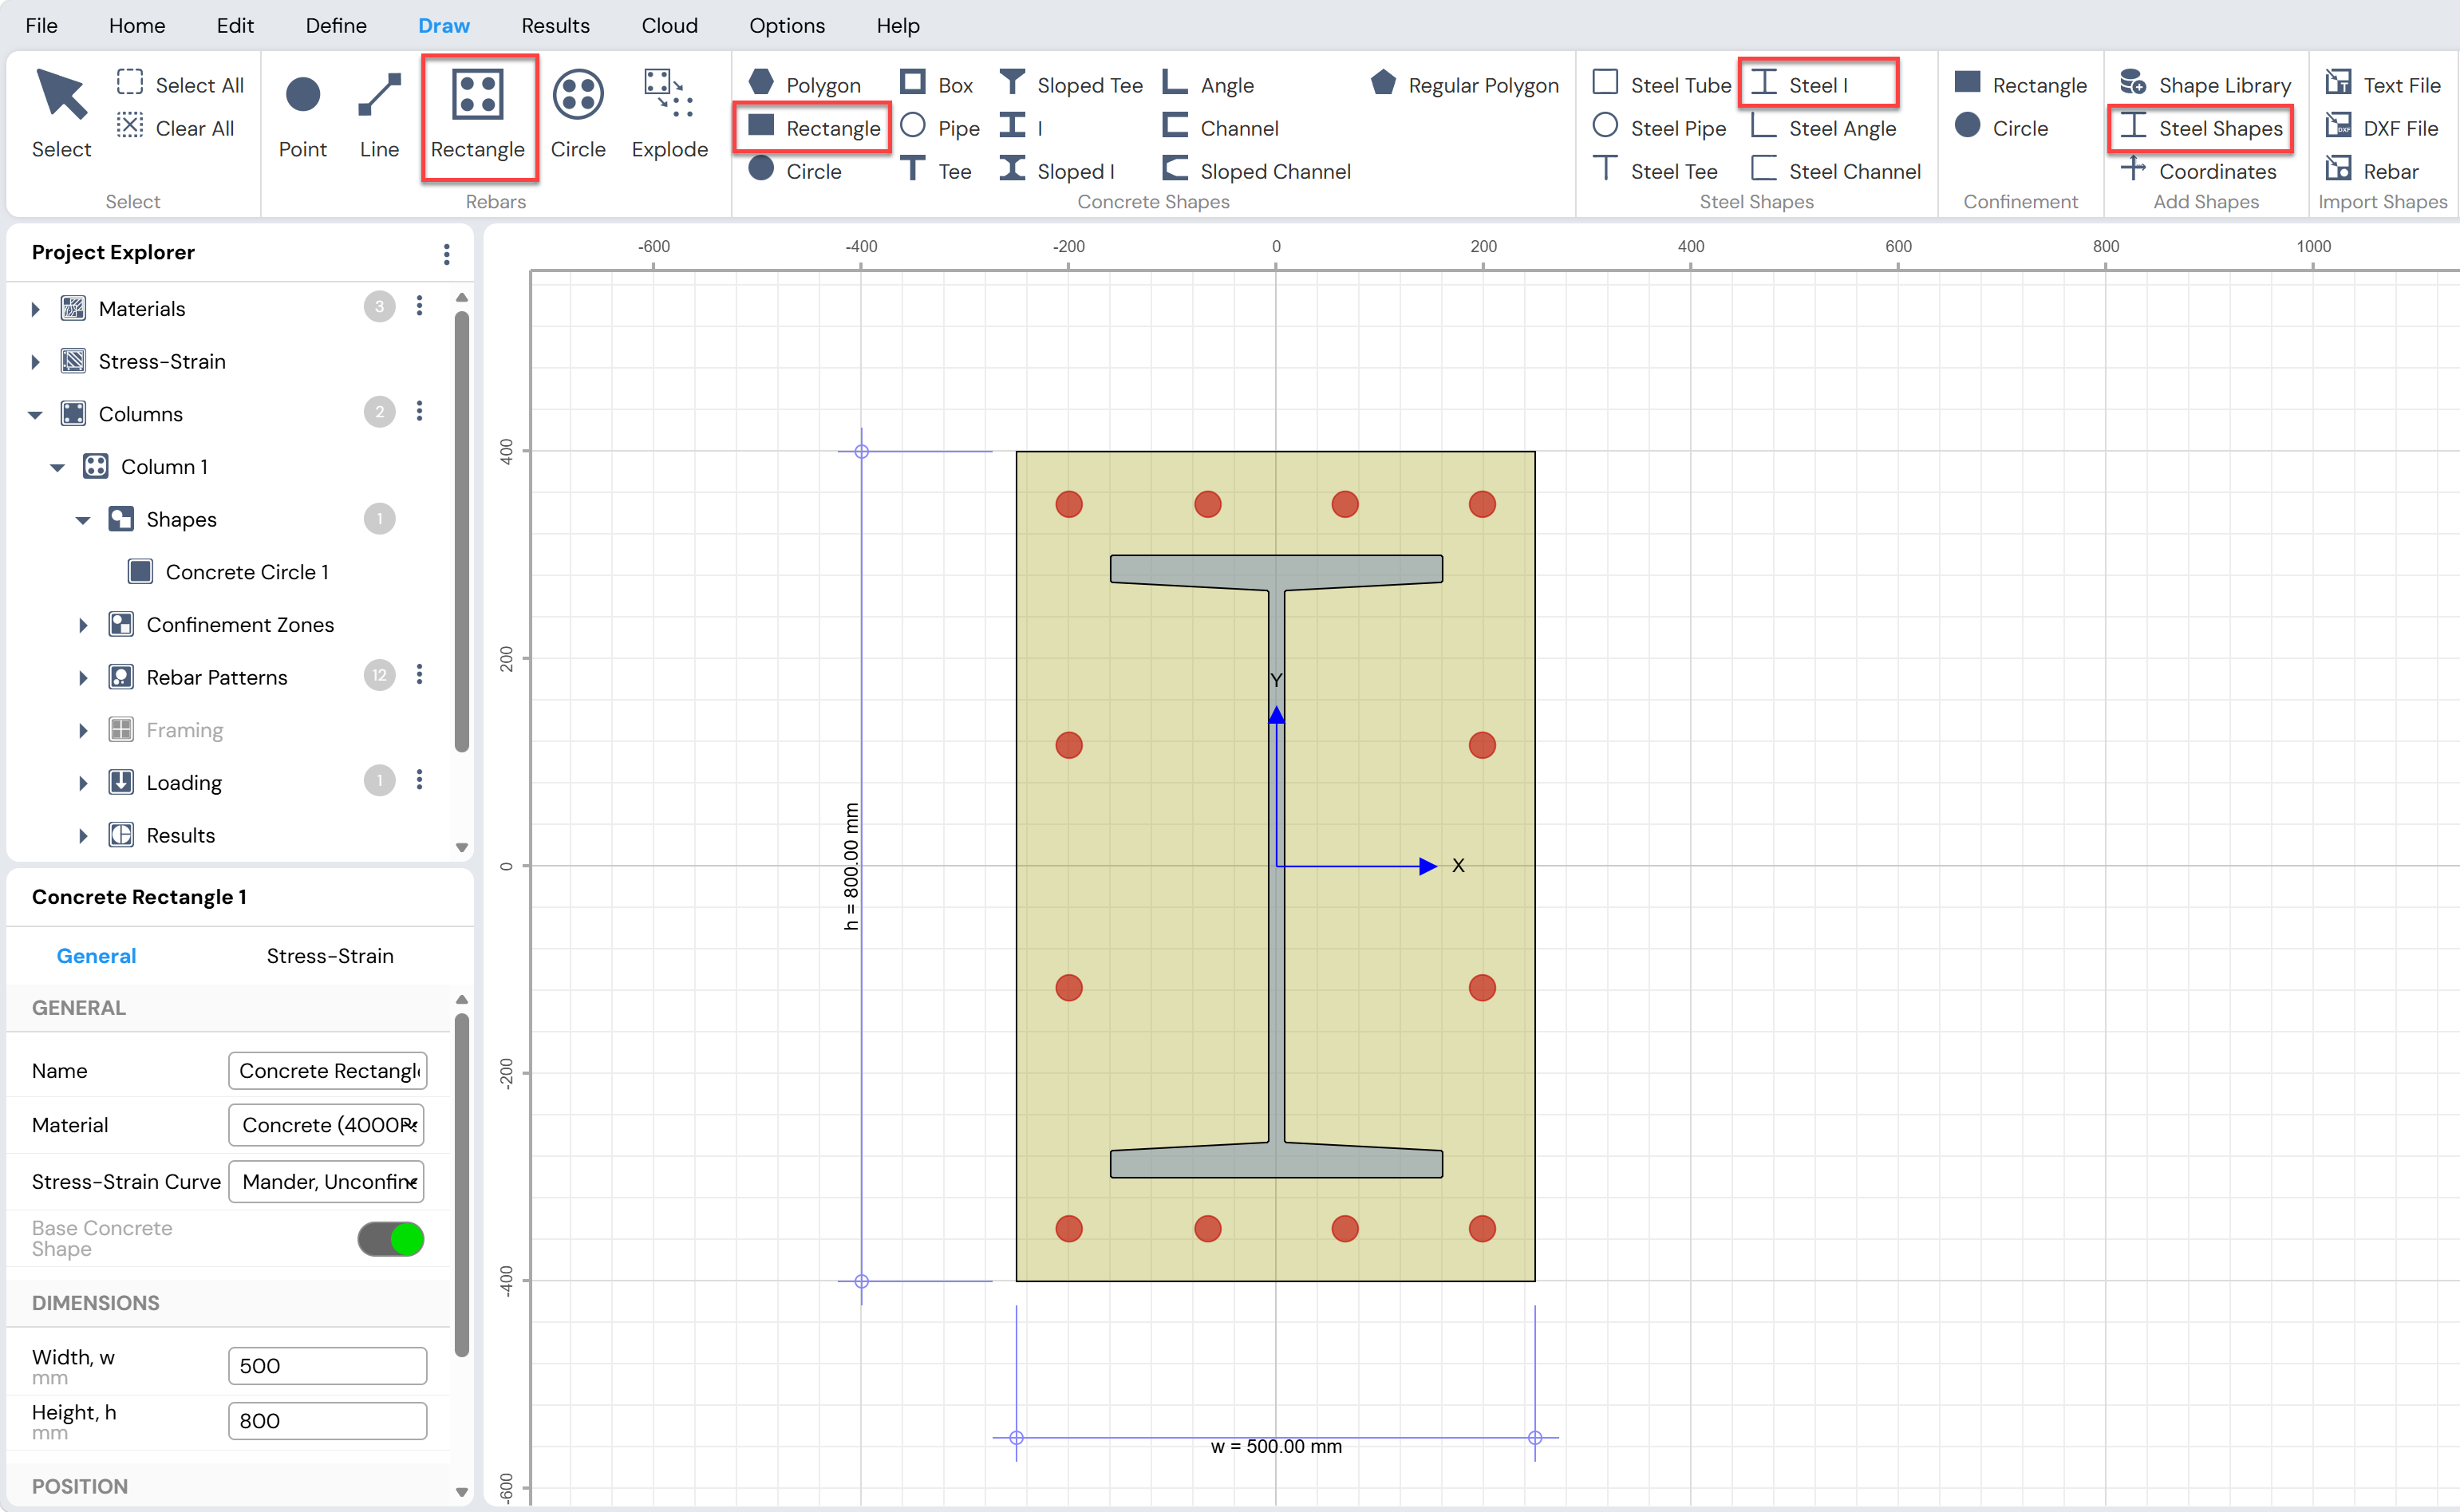
Figure: Creating Composite Column Feature in Column Designer
Materials, Stress–Strain Models, and Confinement Models
Define Material Properties
Material properties in Column Designer are defined and managed using the Define Materials form.
To access the Define Materials form:
Use Define Menu → Project → Materials, or
Click the button next to Project Explorer → Materials
The Define Materials form, shown in Figure, allows users to view, modify, and add material definitions.
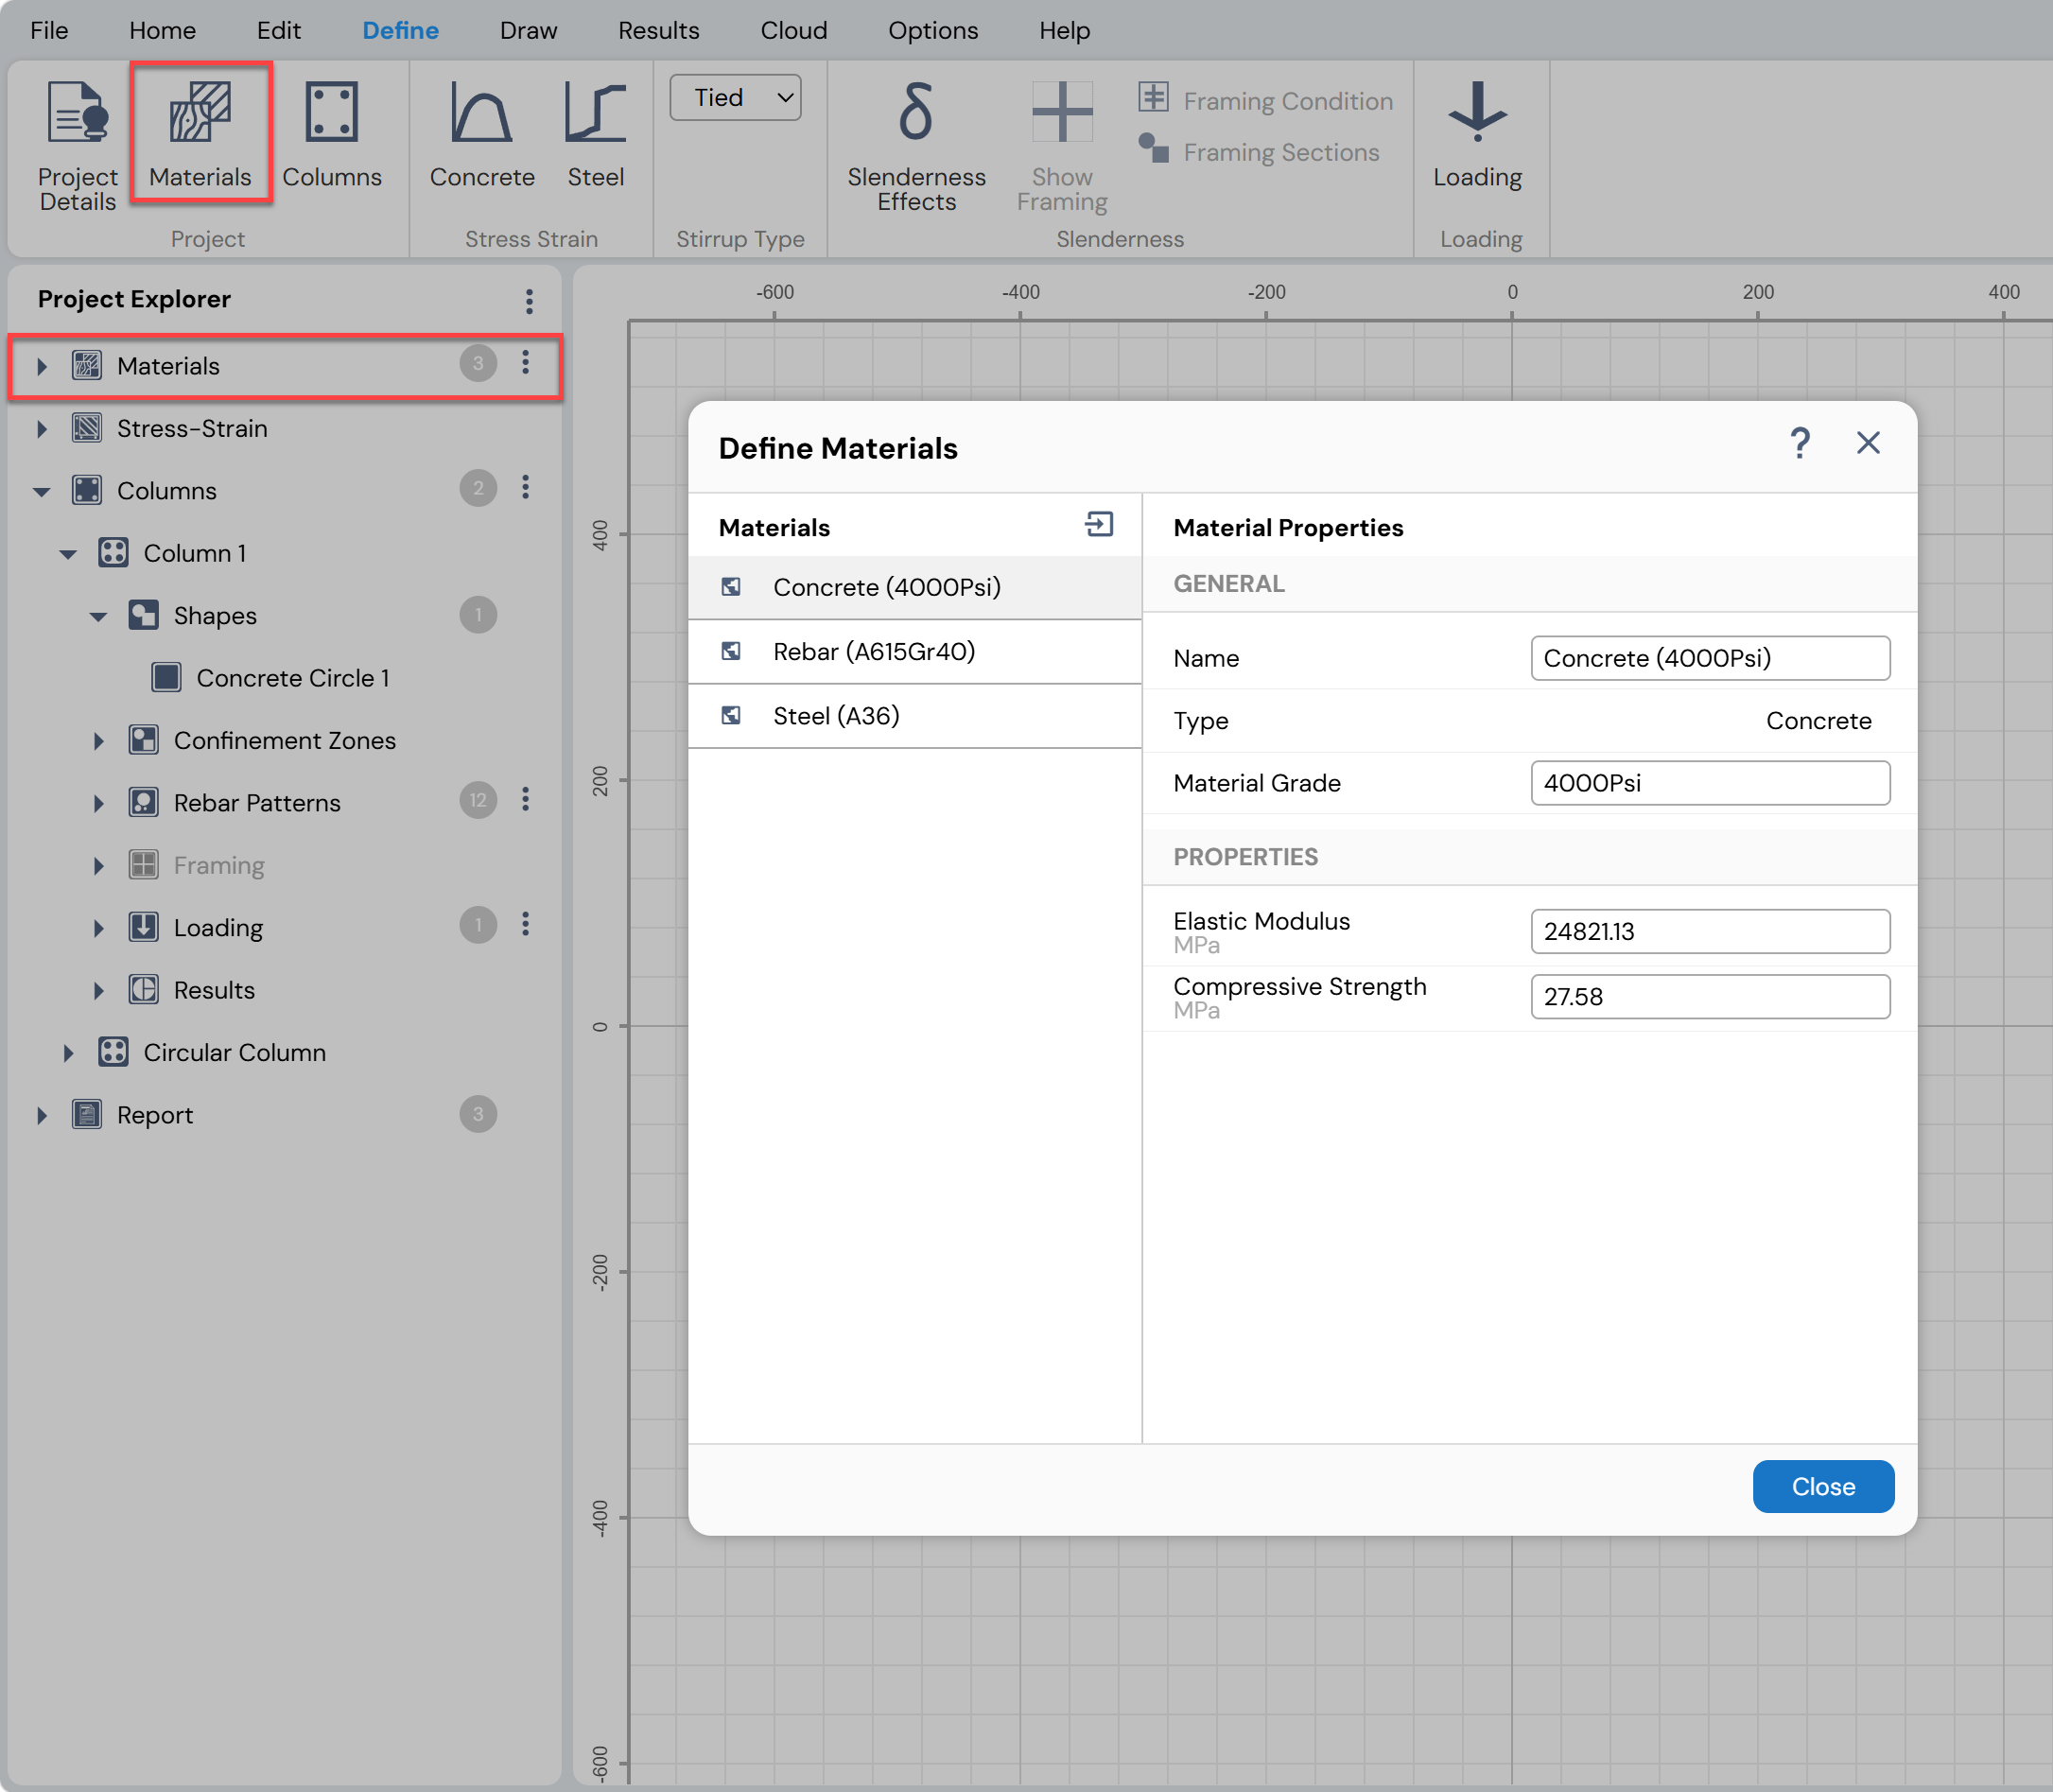
Figure: Define Materials Form
Using the Define Materials Form
The Define Materials form is divided into two main sections:
Materials Section
Displays a list of all materials currently defined in the Project File.Material Properties Section
Displays the properties of the selected material.
Material properties can be modified by directly entering the desired values into the available edit boxes.
Adding New Materials
New materials can be added using the Material Library form.
To access the Material Library:
- Click the
 button provided on the Define Materials form
The Material Library provides predefined materials from multiple regional libraries, including:
USA
China
Europe
Available material types include:
Concrete
Reinforcing steel (rebar)
Structural steel
Selected materials from the Material Library can be added to the Project File and customized as needed.
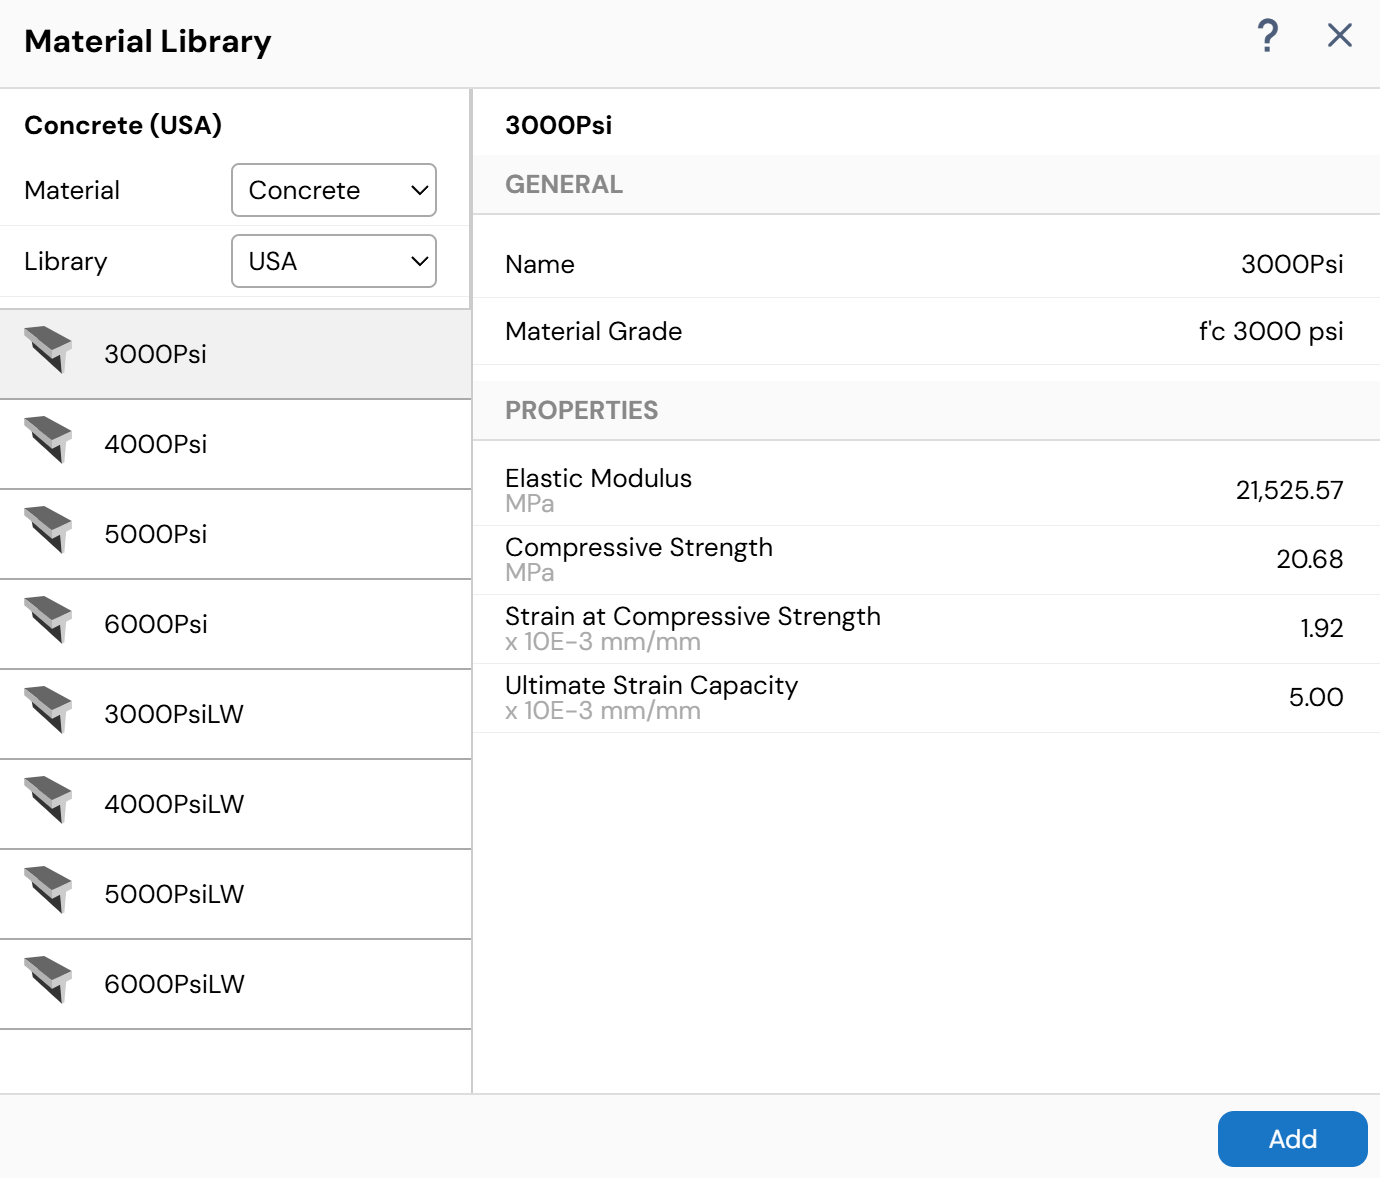
Figure: Adding New Materials Form
Additional Notes
Existing material properties can also be modified by selecting materials directly from Project Explorer → Materials.
The Define Materials form can be accessed at any time during the modeling and design process by clicking on the
 .
.
Define Confinement Models and Stress–Strain Models
The options available under Define Menu → Stress Strain allow the user to define and manage stress–strain models for concrete and steel materials.
Concrete Stress–Strain and Confinement Models
Click the Concrete button under Define Menu → Stress Strain to access the Define Concrete Confinements form.
This form allows the user to:
View existing concrete confinement models
Modify properties of existing confinement models
Add new confinement models
The form is divided into two main sections:
Confinement Models section, which lists all available confinement models
Properties section, which displays the properties of the selected confinement model
Model properties can be modified by directly entering values into the provided edit boxes.
New confinement models can be added using the Add Confinement Model form, which is accessed by clicking the  button.
The Add Confinement Model form provides a selection of several predefined confinement models.
The Define Concrete Confinements form can also be accessed by clicking the  button next to
Project Explorer → Stress–Strain → Concrete.
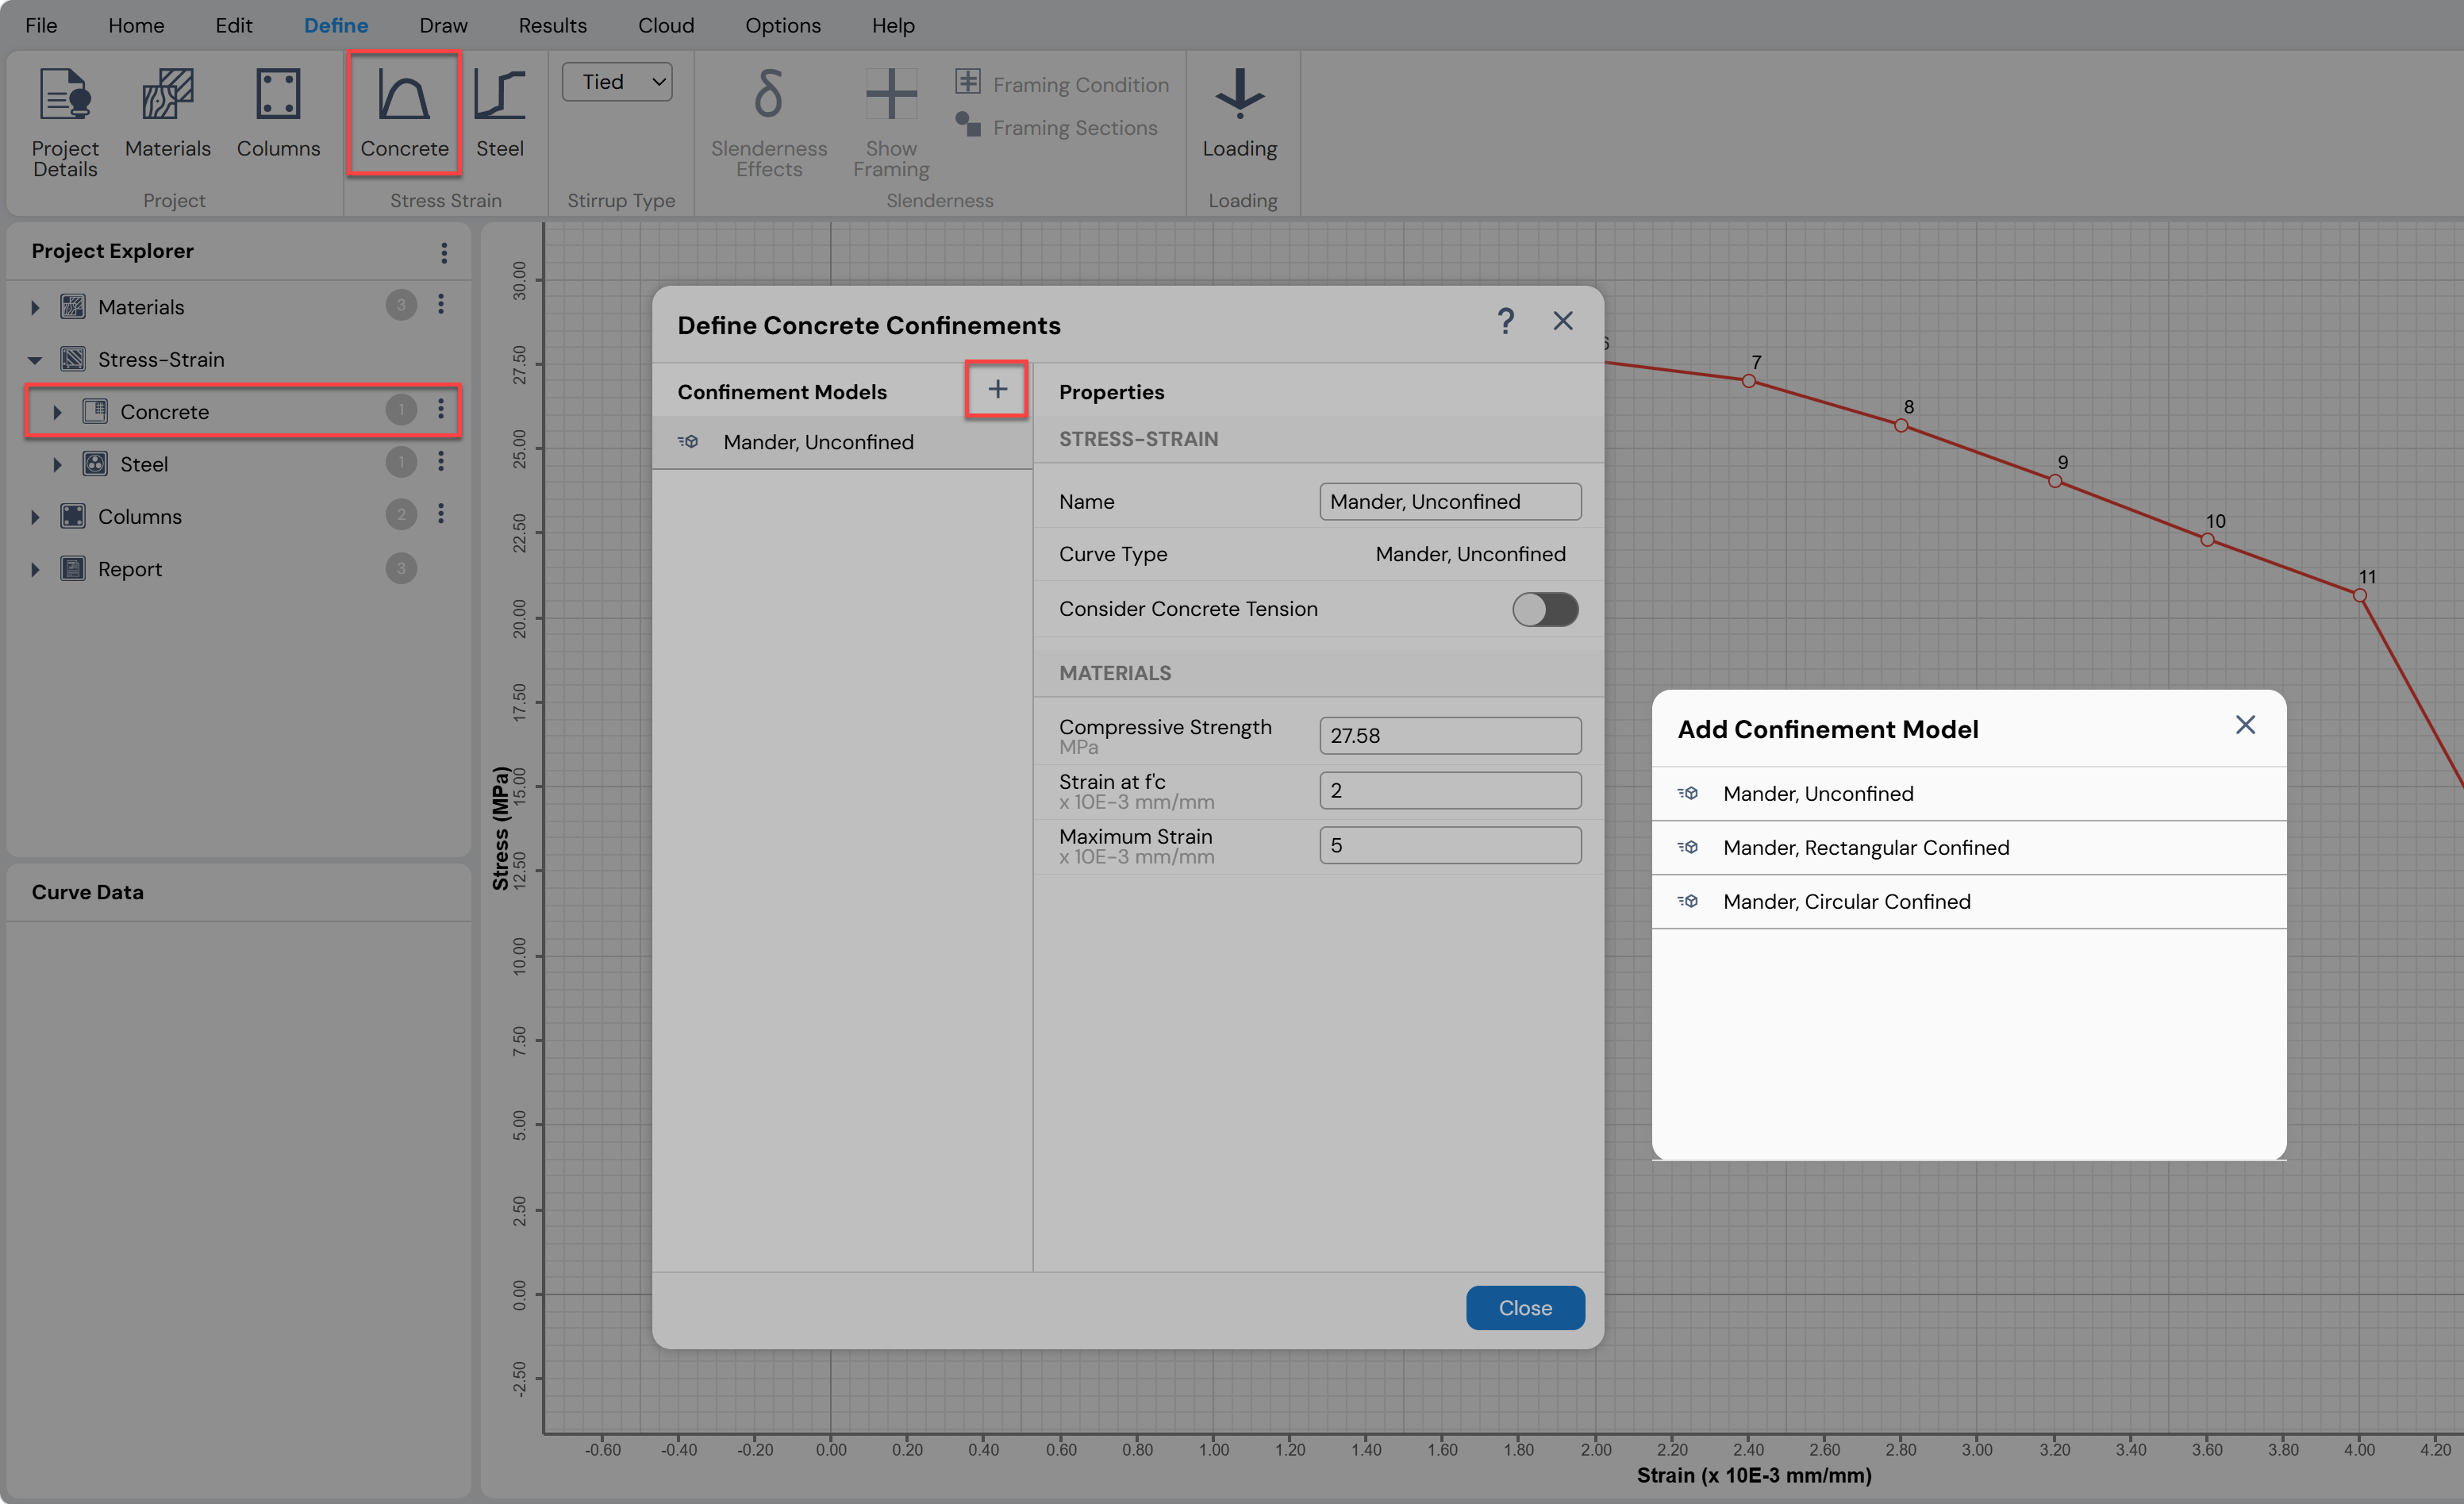
Figure: Concrete Stress-Strain and Confinement Models
Steel Stress–Strain Models
Click the Steel button under Define Menu → Stress Strain to access the Define Steel Stress–Strain form.
This form allows the user to:
View existing steel stress–strain models
Modify properties of existing models
Add new stress–strain models
The form contains:
Stress–Strain Models section listing all available models
Properties section displaying the properties of the selected model
Model properties can be modified by directly typing values into the edit boxes.
New stress–strain models can be added using the Add Stress–Strain Model form, which is accessed by clicking the button.
The Add Stress–Strain Model form provides a selection of several predefined stress–strain models.
The Define Steel Stress–Strain form can also be accessed by clicking the button next to
Project Explorer → Stress–Strain → Steel.
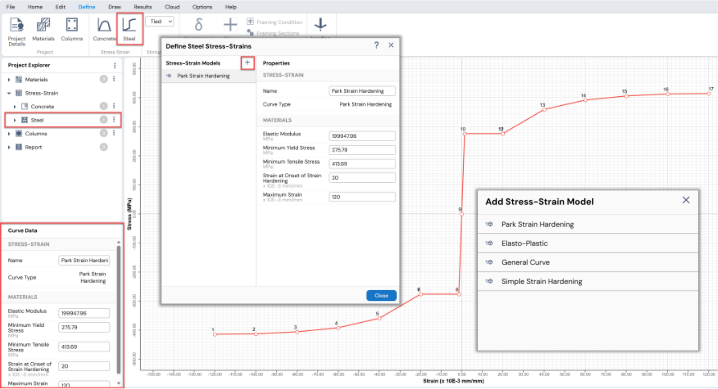
Figure: Steel Stress-Strain and Confinement Models
Modifying Stress–Strain Models
Properties of existing concrete confinement models or steel stress–strain models can also be modified by selecting them directly from Project Explorer → Stress–Strain.
By default:
Mander’s Unconfined Model is assigned for concrete
Park Strain Hardening Model is assigned for reinforcement
The stress–strain model assigned to a shape can be changed by:
Selecting the shape in the working area or from Project Explorer → Columns
Choosing the desired model from the Stress–Strain Curve drop-down list in the Property Grid
The stress–strain model assigned to rebar can be changed from:
Define Menu → Materials, or
Project Explorer → Materials
Important Note
Stress–strain and confinement models are used only for moment–curvature analysis.
They do not affect P–M capacity calculations.
Define the Base Shape / Rebar Pattern
Defining the Base Concrete Shape, Base Rebar Pattern, and Base Steel Shape is required for the calculation of Magnified Moments.
According to ACI 318, the equations used to calculate effective stiffness assume:
A single concrete material
A single rebar material
A single steel material
These assumptions are reflected in Equations (1) and (2). However, when a column section contains multiple concrete, rebar, or steel materials, equivalent transformed section properties must be determined.
To achieve this, Column Designer requires the definition of base components for concrete, rebar, and steel so that equivalent values of:
Ig (concrete)
Ise (reinforcement)
Isx (steel)
can be computed separately.
Effective Stiffness Equations (ACI 318)
| (1) | |
|---|---|
| (2) |
Where:
Ec = modulus of elasticity of concrete
Es = modulus of elasticity of steel
Ig = gross moment of inertia of concrete
Ise = transformed moment of inertia of reinforcement
Isx = transformed moment of inertia of steel
βdns = factor accounting for sustained axial load
Base Concrete Shape
By default, the first concrete shape drawn is assigned as the Base Concrete Shape under the General tab in the Property Grid.
This field can be toggled only when two or more concrete shapes exist in the section.
Assigning a new Base Concrete Shape automatically removes the assignment from the previously assigned shape.
If the current Base Concrete Shape is deleted, the first concrete shape in the drawing order is automatically reassigned as the Base Concrete Shape.
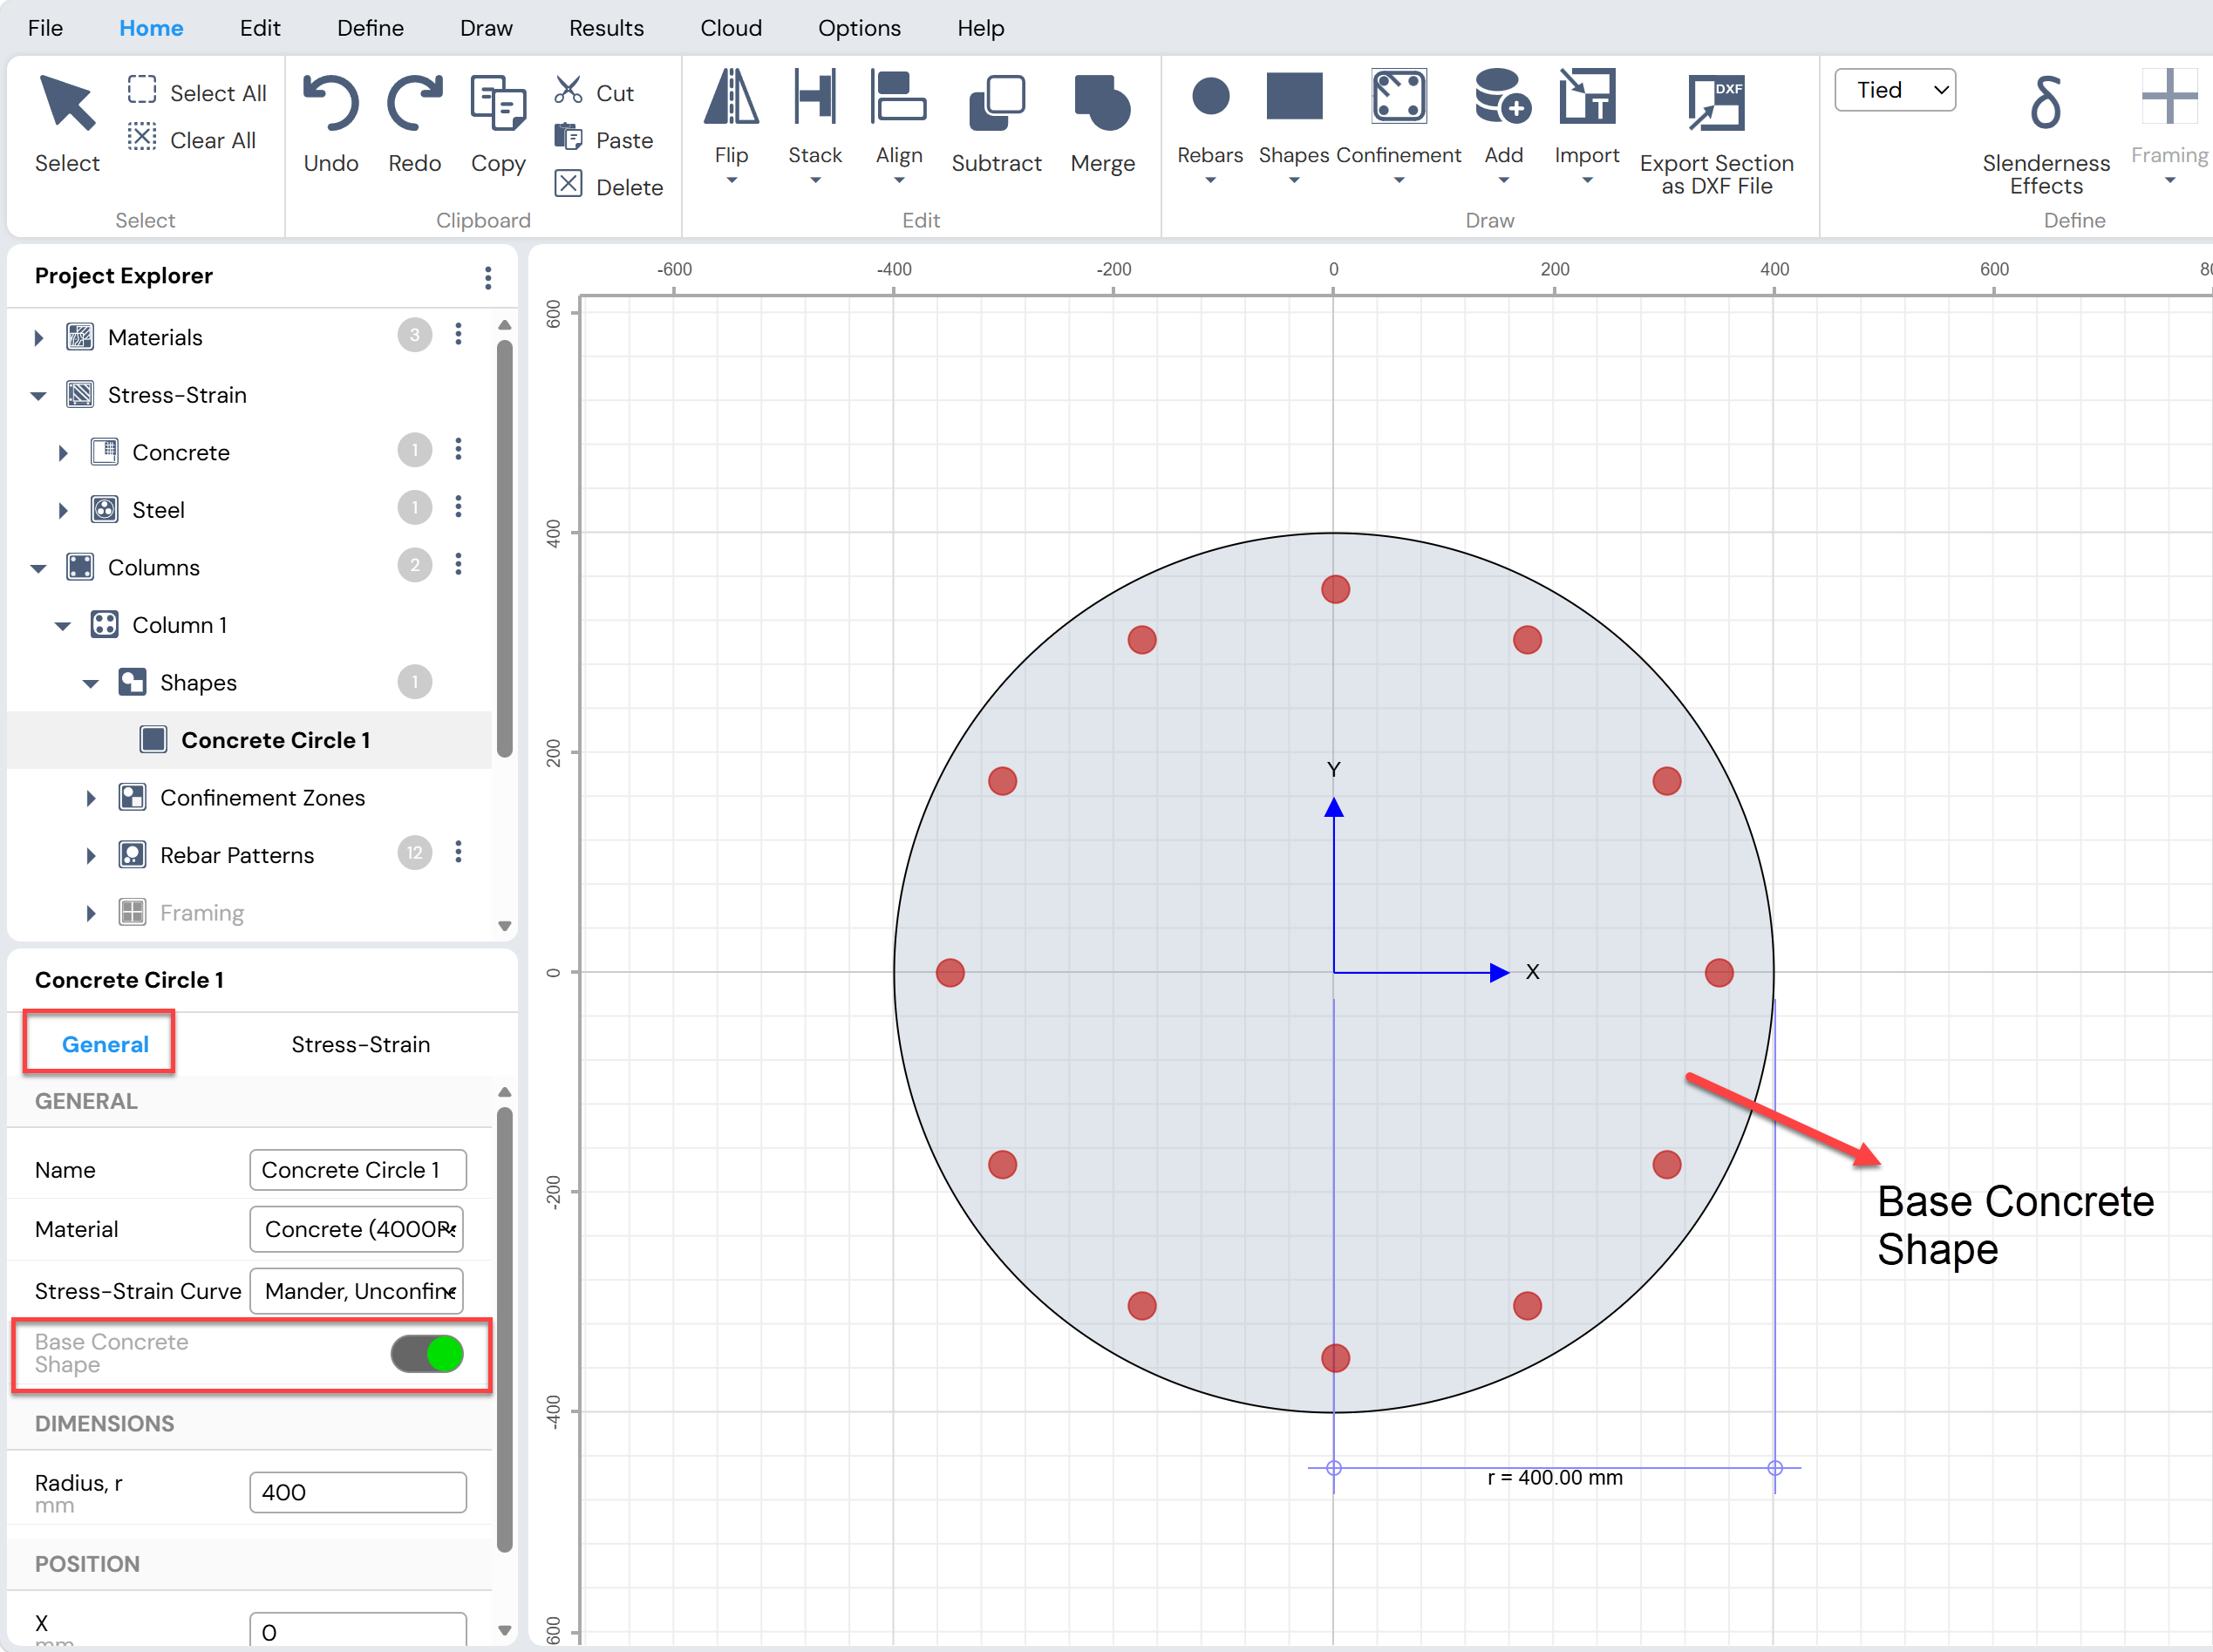
Figure: Base Concrete Shape in Column Designer
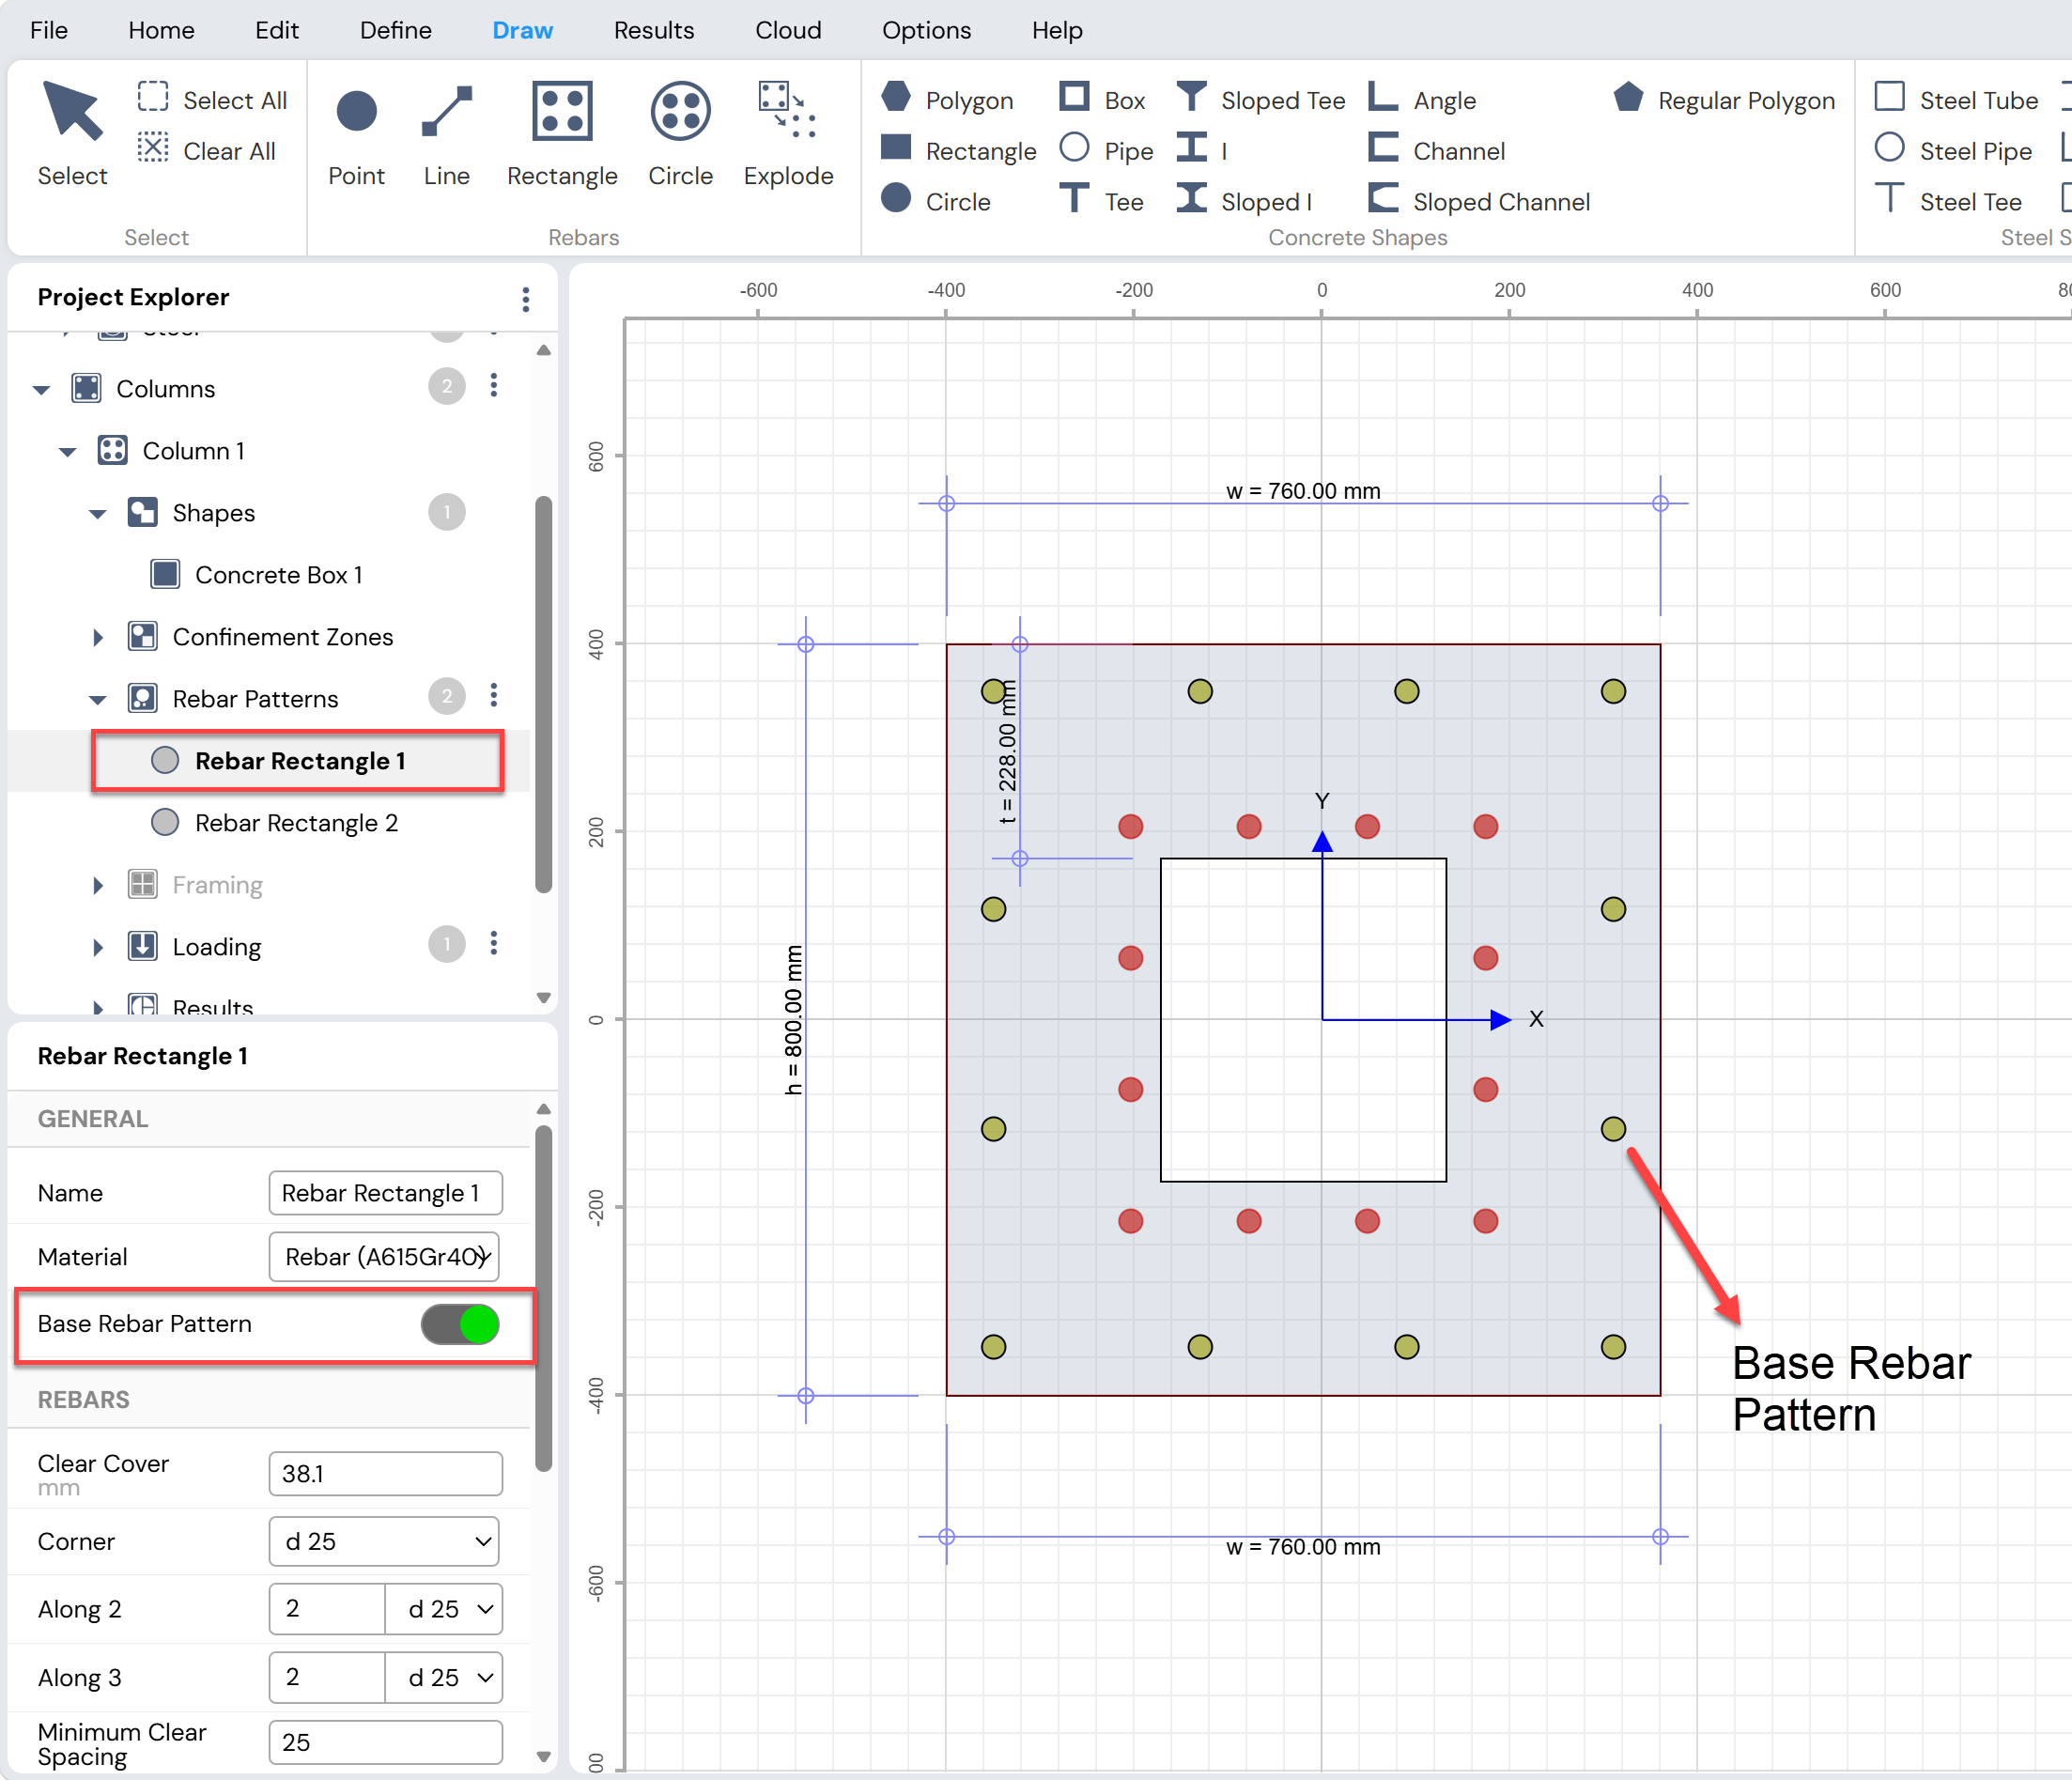
Base Rebar Pattern
By default, the first rebar or rebar layout drawn is assigned as the Base Rebar Pattern under the General tab in the Property Grid.
This field can be toggled only when two or more rebar layouts exist in the section.
Assigning a rebar layout as the Base Rebar Pattern automatically removes the assignment from the previously assigned layout.
If the current Base Rebar Pattern is deleted, the first rebar layout in the drawing order is automatically assigned as the new Base Rebar Pattern.
Base Steel Shape
By default, the first steel shape drawn is assigned as the Base Steel Shape under the General tab in the Property Grid.
This field can be toggled only when two or more steel shapes exist in the section.
Assigning a steel shape as the Base Steel Shape automatically removes the assignment from the previously assigned steel shape.
If the current Base Steel Shape is deleted, the first steel shape in the drawing order is automatically assigned as the Base Steel Shape.
Important Note
The Base Shape and Base Rebar Pattern assignments are critical for correct magnified moment calculations in sections containing multiple materials. Incorrect or missing base assignments may lead to inaccurate stiffness evaluation.
Assign Materials
Materials can be assigned to shapes and reinforcement bars by selecting the desired material from the Materials drop-down list in the Property Grid, as shown in Figure.
The Property Grid is activated by:
Clicking on a shape or rebar in the working area, or
Selecting a shape or rebar from Project Explorer → Columns
Once activated, the assigned material can be changed by choosing the appropriate material from the Materials drop-down list.
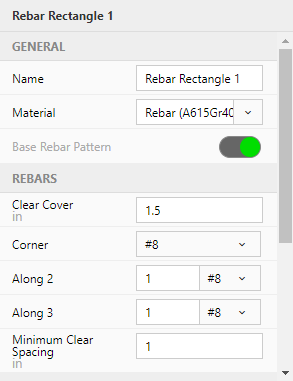
Figure: Property Grid for material assignment
Assign Confinement Models and Stress–Strain Model
Stress–strain and confinement models can be assigned to concrete shapes, steel shapes, and reinforcement as described below.
Assigning Stress–Strain Models to Shapes
For concrete and steel shapes, the stress–strain model is assigned using the Property Grid.
To assign or change the stress–strain model:
Select the desired shape by:
Clicking on it in the working area, or
Selecting it from Project Explorer → Columns
Once selected, the Property Grid is activated
Choose the desired model from the Stress–Strain Curve drop-down list
This process is illustrated in Figure.
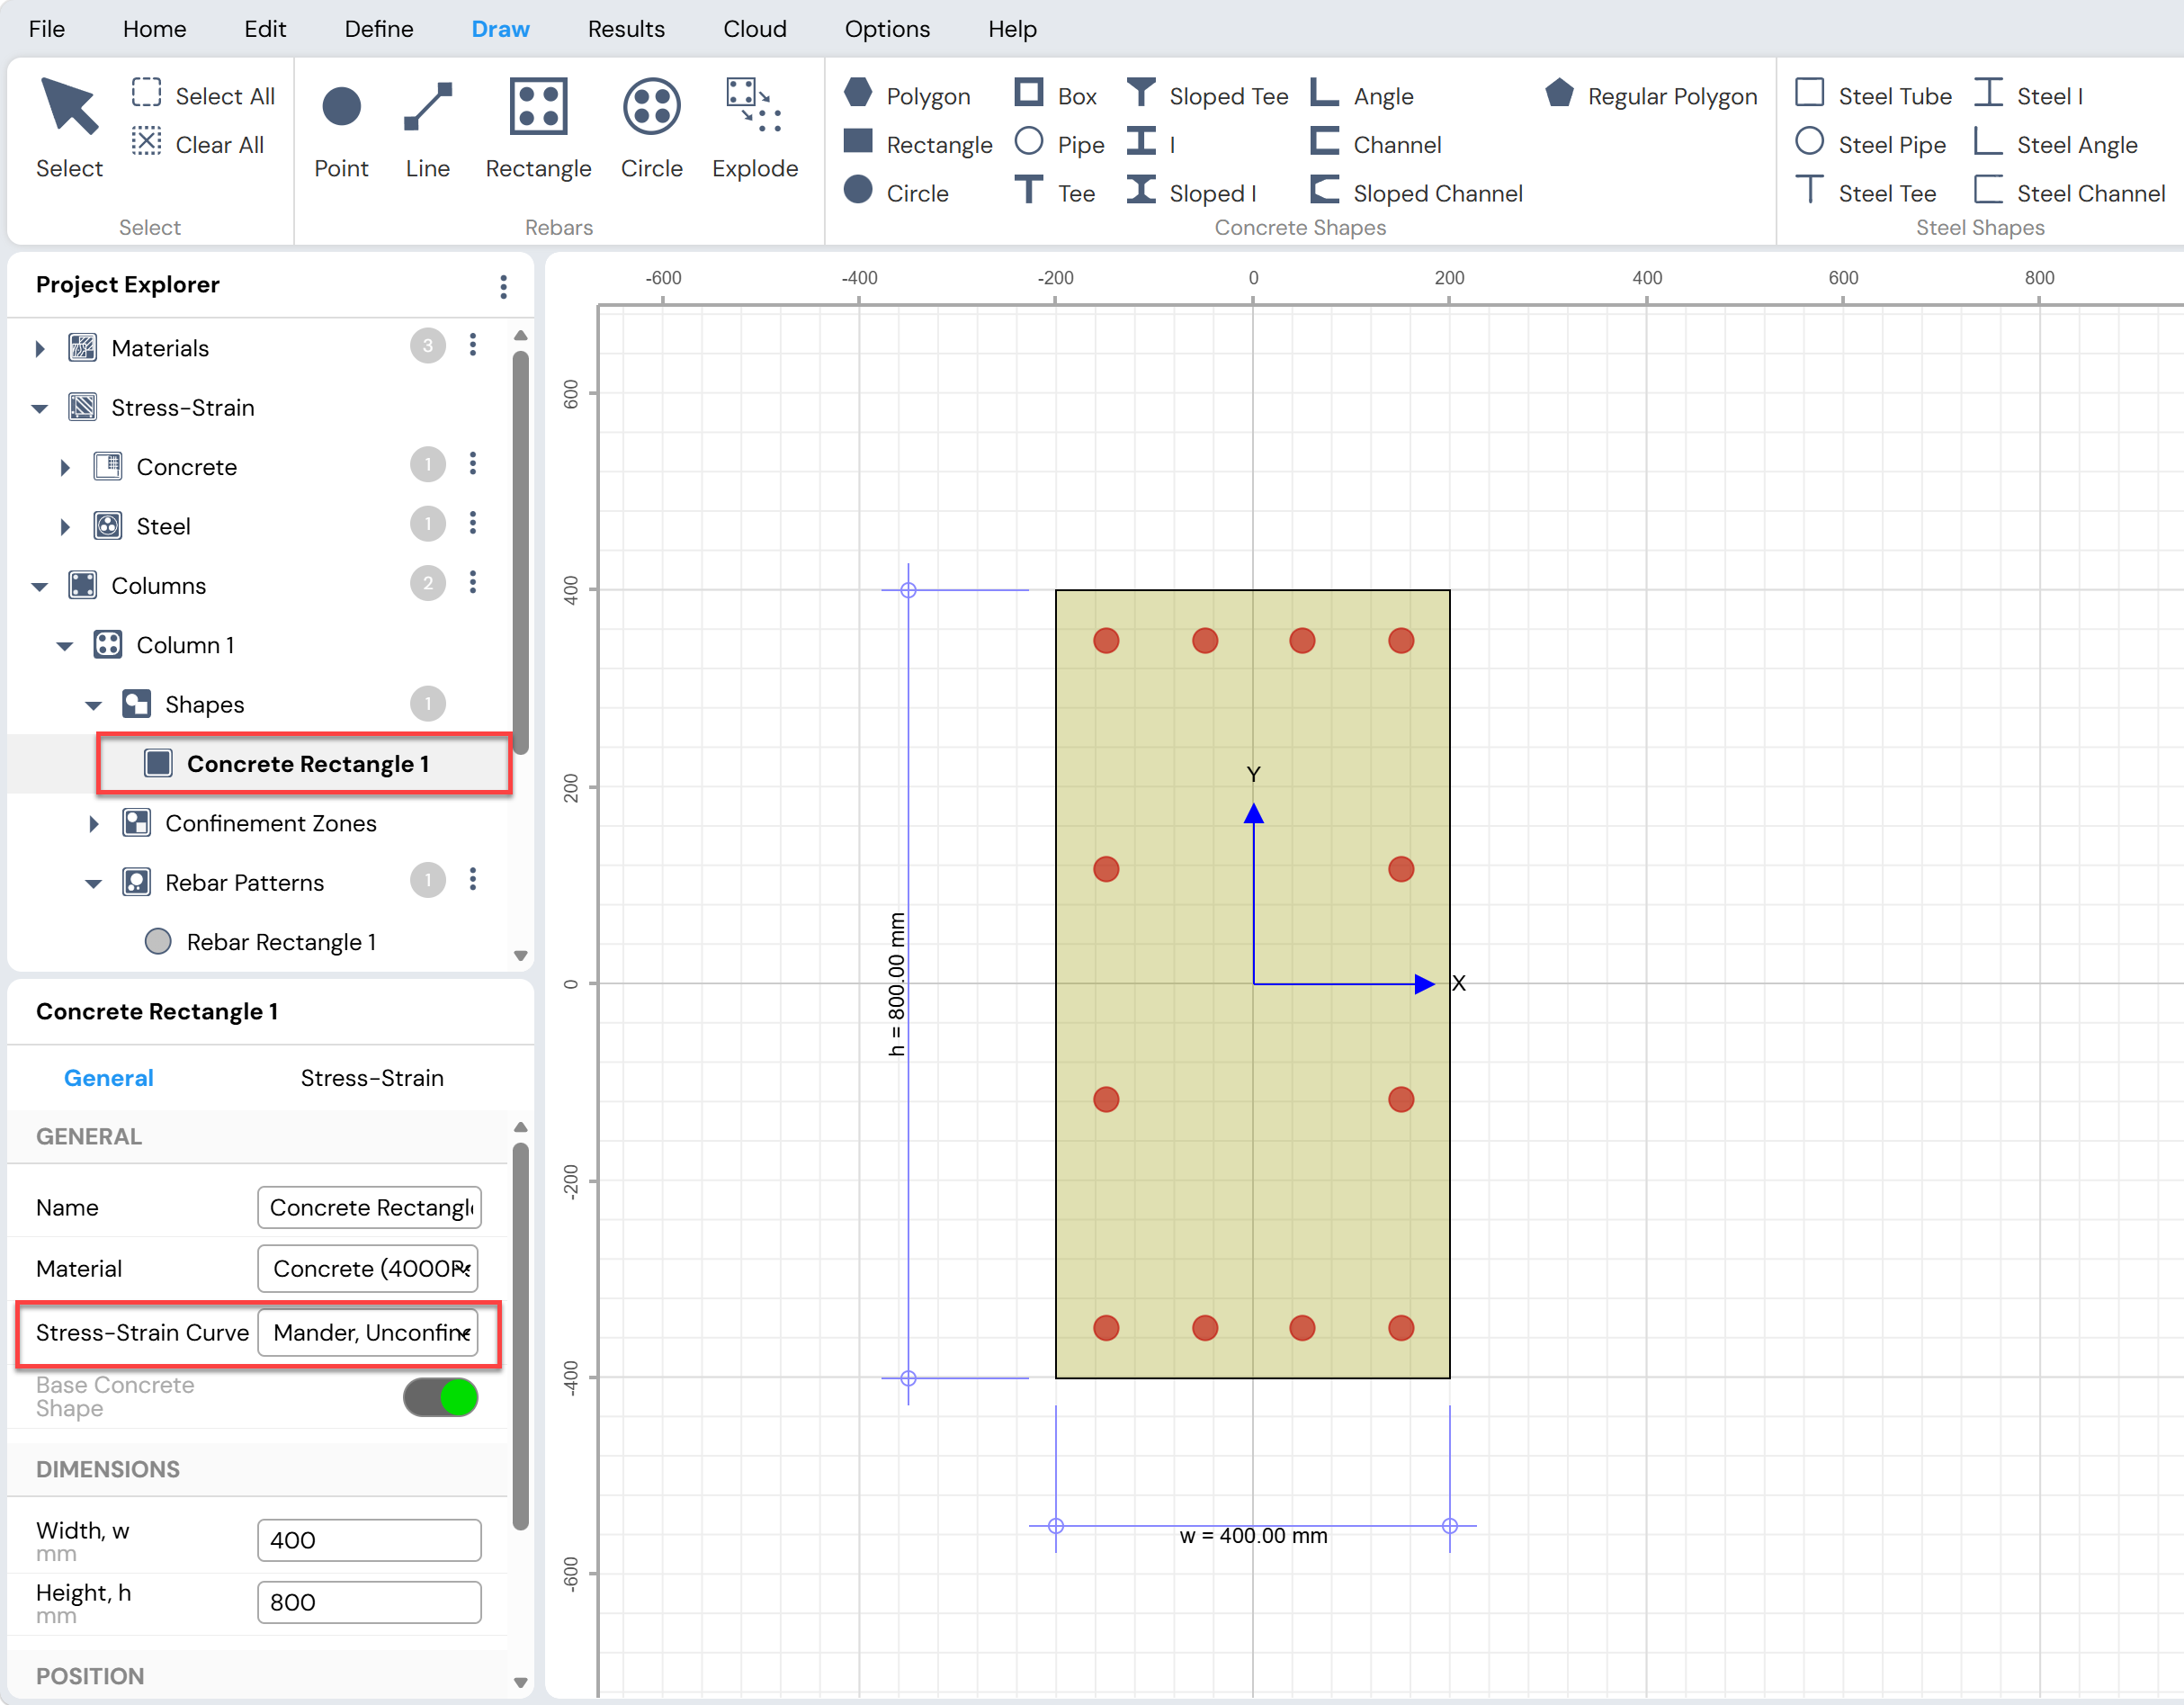
Figure: Assigning Confinement and Stress-Strain Models
Assigning Stress–Strain Models to Rebars
For rebars, the stress–strain model is assigned at the material level, not directly to individual rebar objects.
To assign or modify the stress–strain model for rebars:
Click Define Menu → Project → Materials to open the Define Materials form, or
Select the rebar material from Project Explorer → Materials to activate the Property Grid in the context-sensitive area
Once the Property Grid is active:
- Select the desired stress–strain model from the Stress–Strain Curve drop-down list
This process is illustrated in Figure.
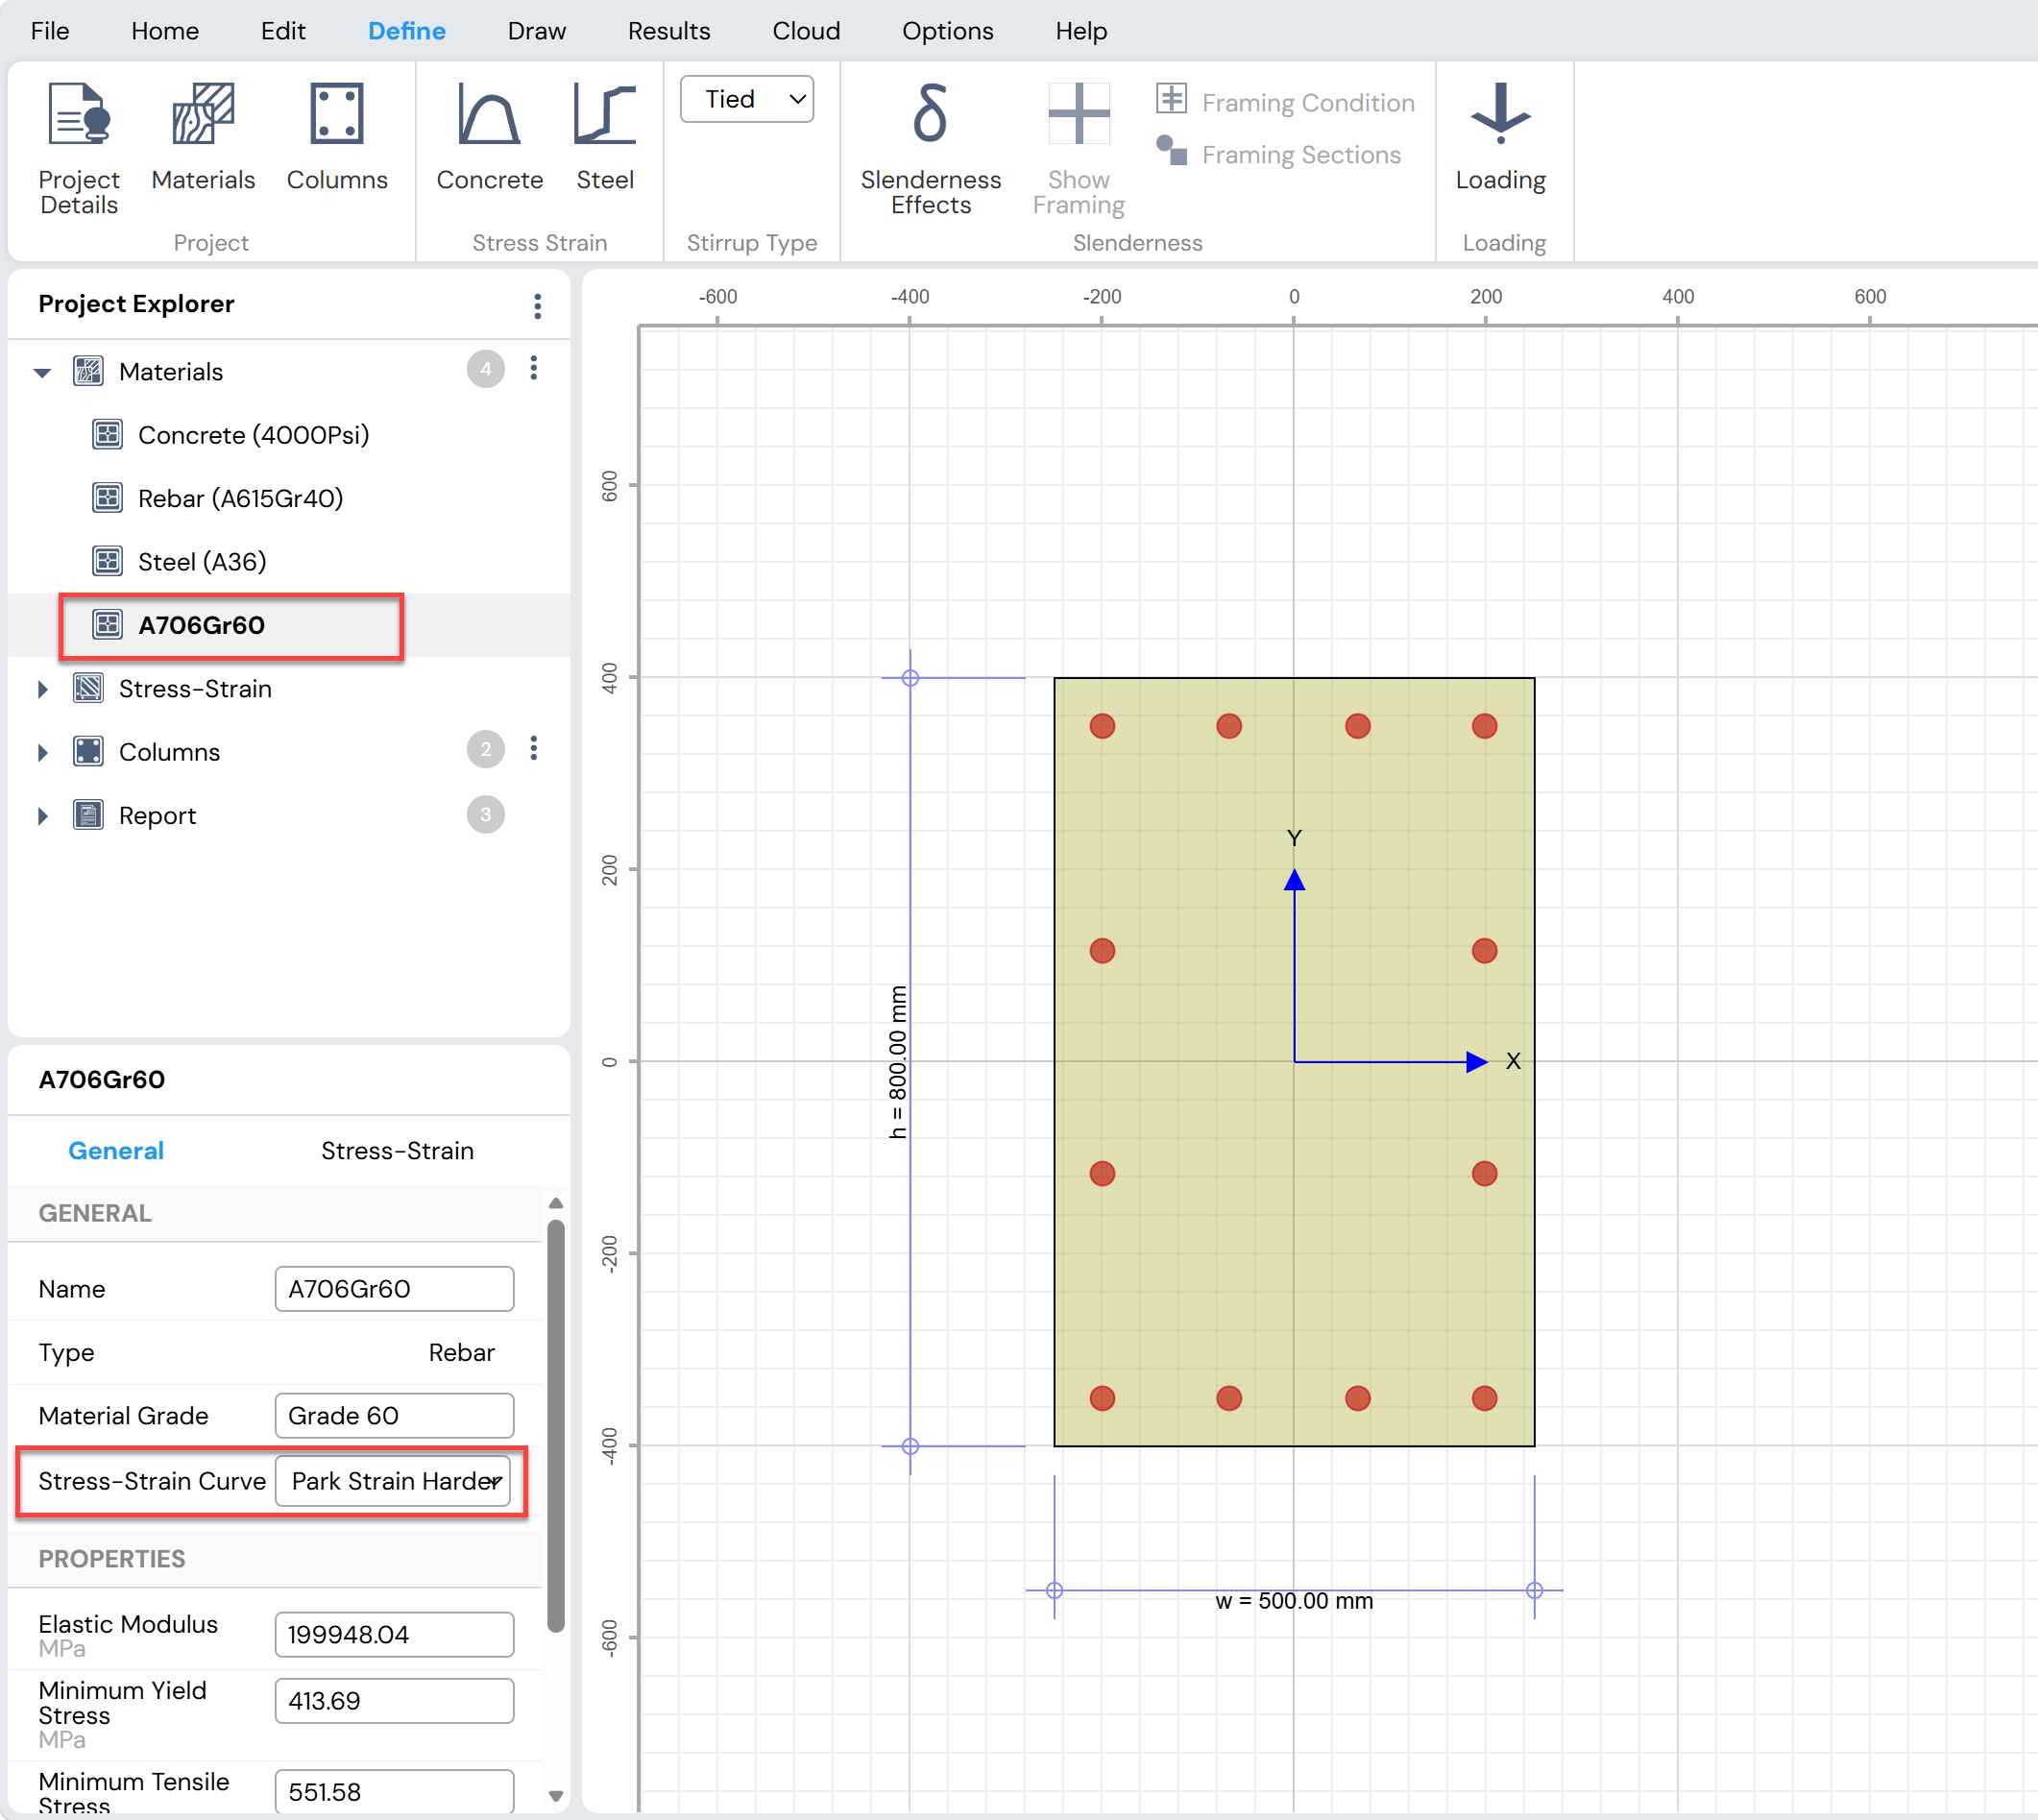
Figure: Property Grid for Rebar Material
Important Clarification
Stress–strain models assigned to shapes affect the behavior of the section geometry
Stress–strain models assigned to rebar materials apply to all rebars using that material
Individual rebars do not have separate stress–strain assignments
Create Confinement Zones
Confinement zones can be created in Column Designer using two methods:
Auto Create Confinement
Draw Confinement
Auto Create Confinement
In this method, the confinement zone is created automatically by the software.
The basic procedure for auto-creating confinement is described below.
Procedure for Auto Creating Confinement Zones
- Select Column Section
Select the desired column section from Project Explorer.
Note:
This feature is available only for sections with a single rebar pattern, and supports:
Rectangular rebar patterns
Circular rebar patterns
Create Auto Confinement Zone
Click Home Menu → Design → Auto Confinement to create a confinement zone in the selected section.Review and Modify Confinement Geometry
By default, the confinement zone encloses the outer perimeter of the rebars.Accept the default confinement dimensions, or
Modify the dimensions by entering values in the edit boxes under the General tab of the Property Grid
The Property Grid is activated by:
Selecting the confinement zone in the working area, or
Selecting it from Project Explorer → Confinement Zones
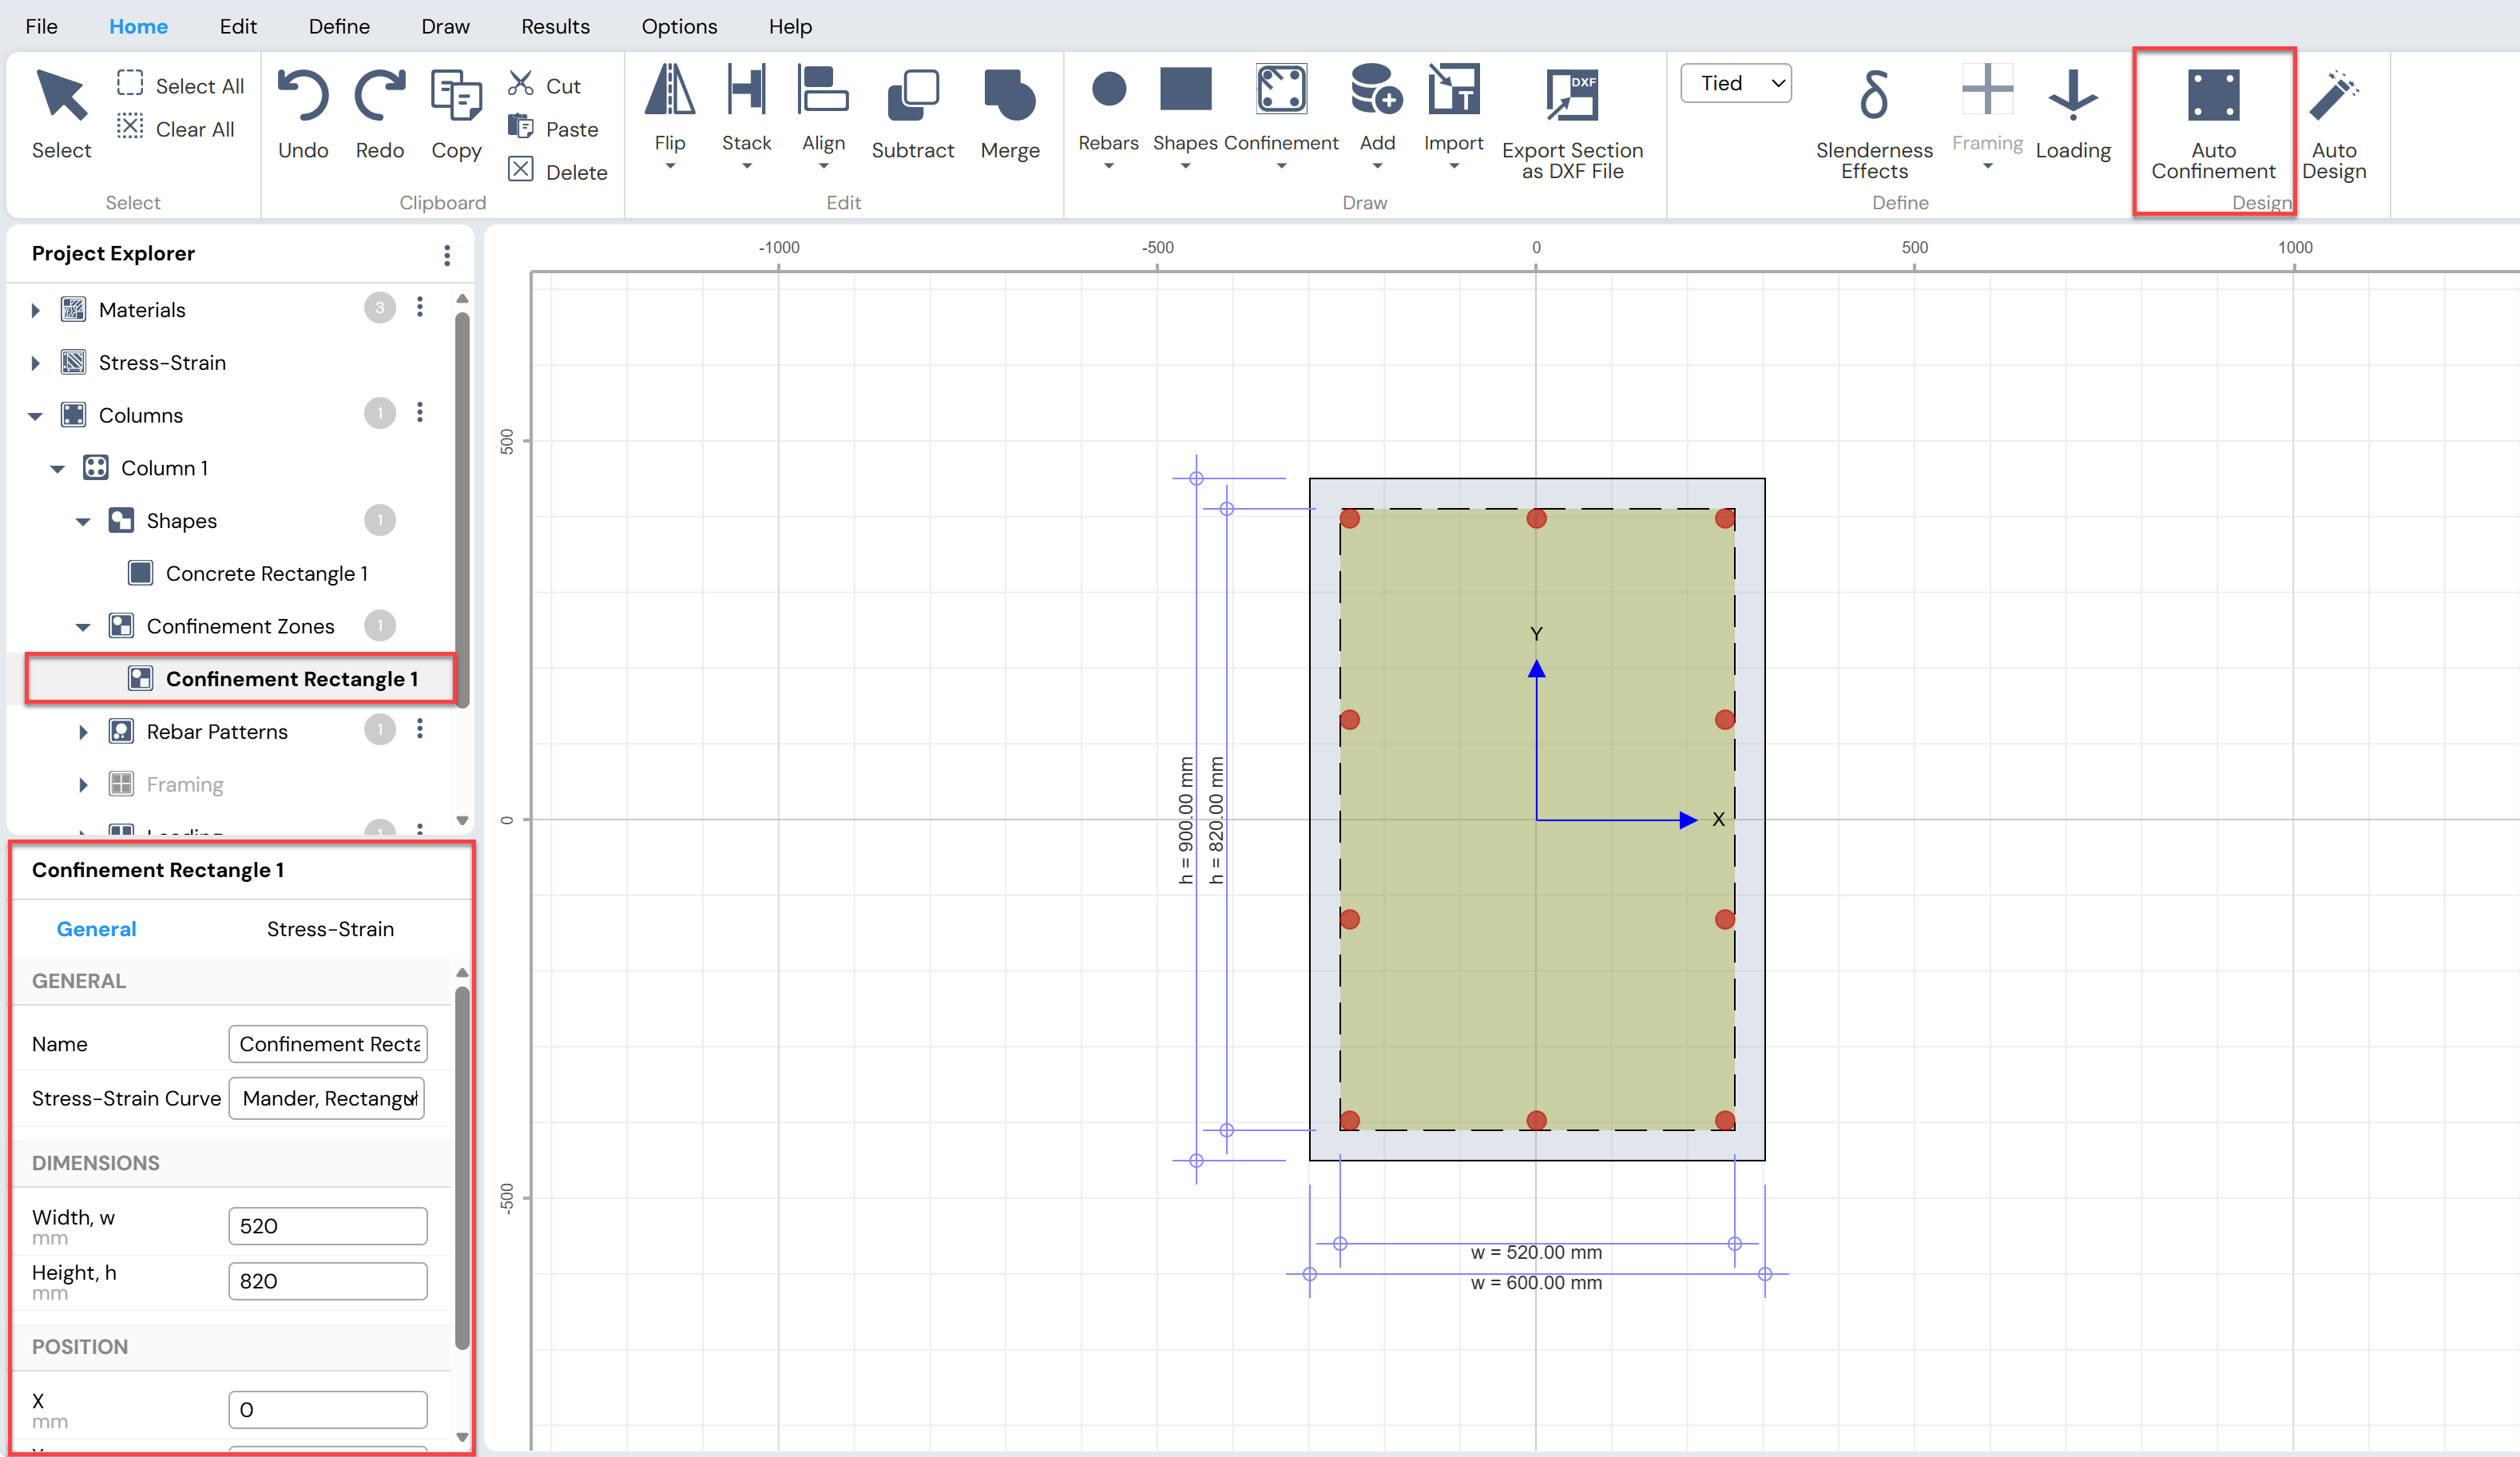
Figure: Creating Confinement Zones – Auto Confinement
- Assign Confinement Model
By default, Mander’s Confined Model is assigned to the confinement zone.
To change the confinement model:
- Select the desired model from the Stress–Strain Curve drop-down list under the General tab of the Property Grid
New confinement models must first be defined using:
Define Menu → Stress Strain → Concrete, or
The button next to Project Explorer → Stress-Strain → Concrete
Define Tie and Confinement Parameters
After assigning the confinement model:Select the Stress–Strain tab of the Property Grid
Review and modify confinement parameters under the Ties heading, such as:
Tie diameter
Tie spacing
The total main steel area is computed automatically based on the defined reinforcement.
This value may be modified manually if required.
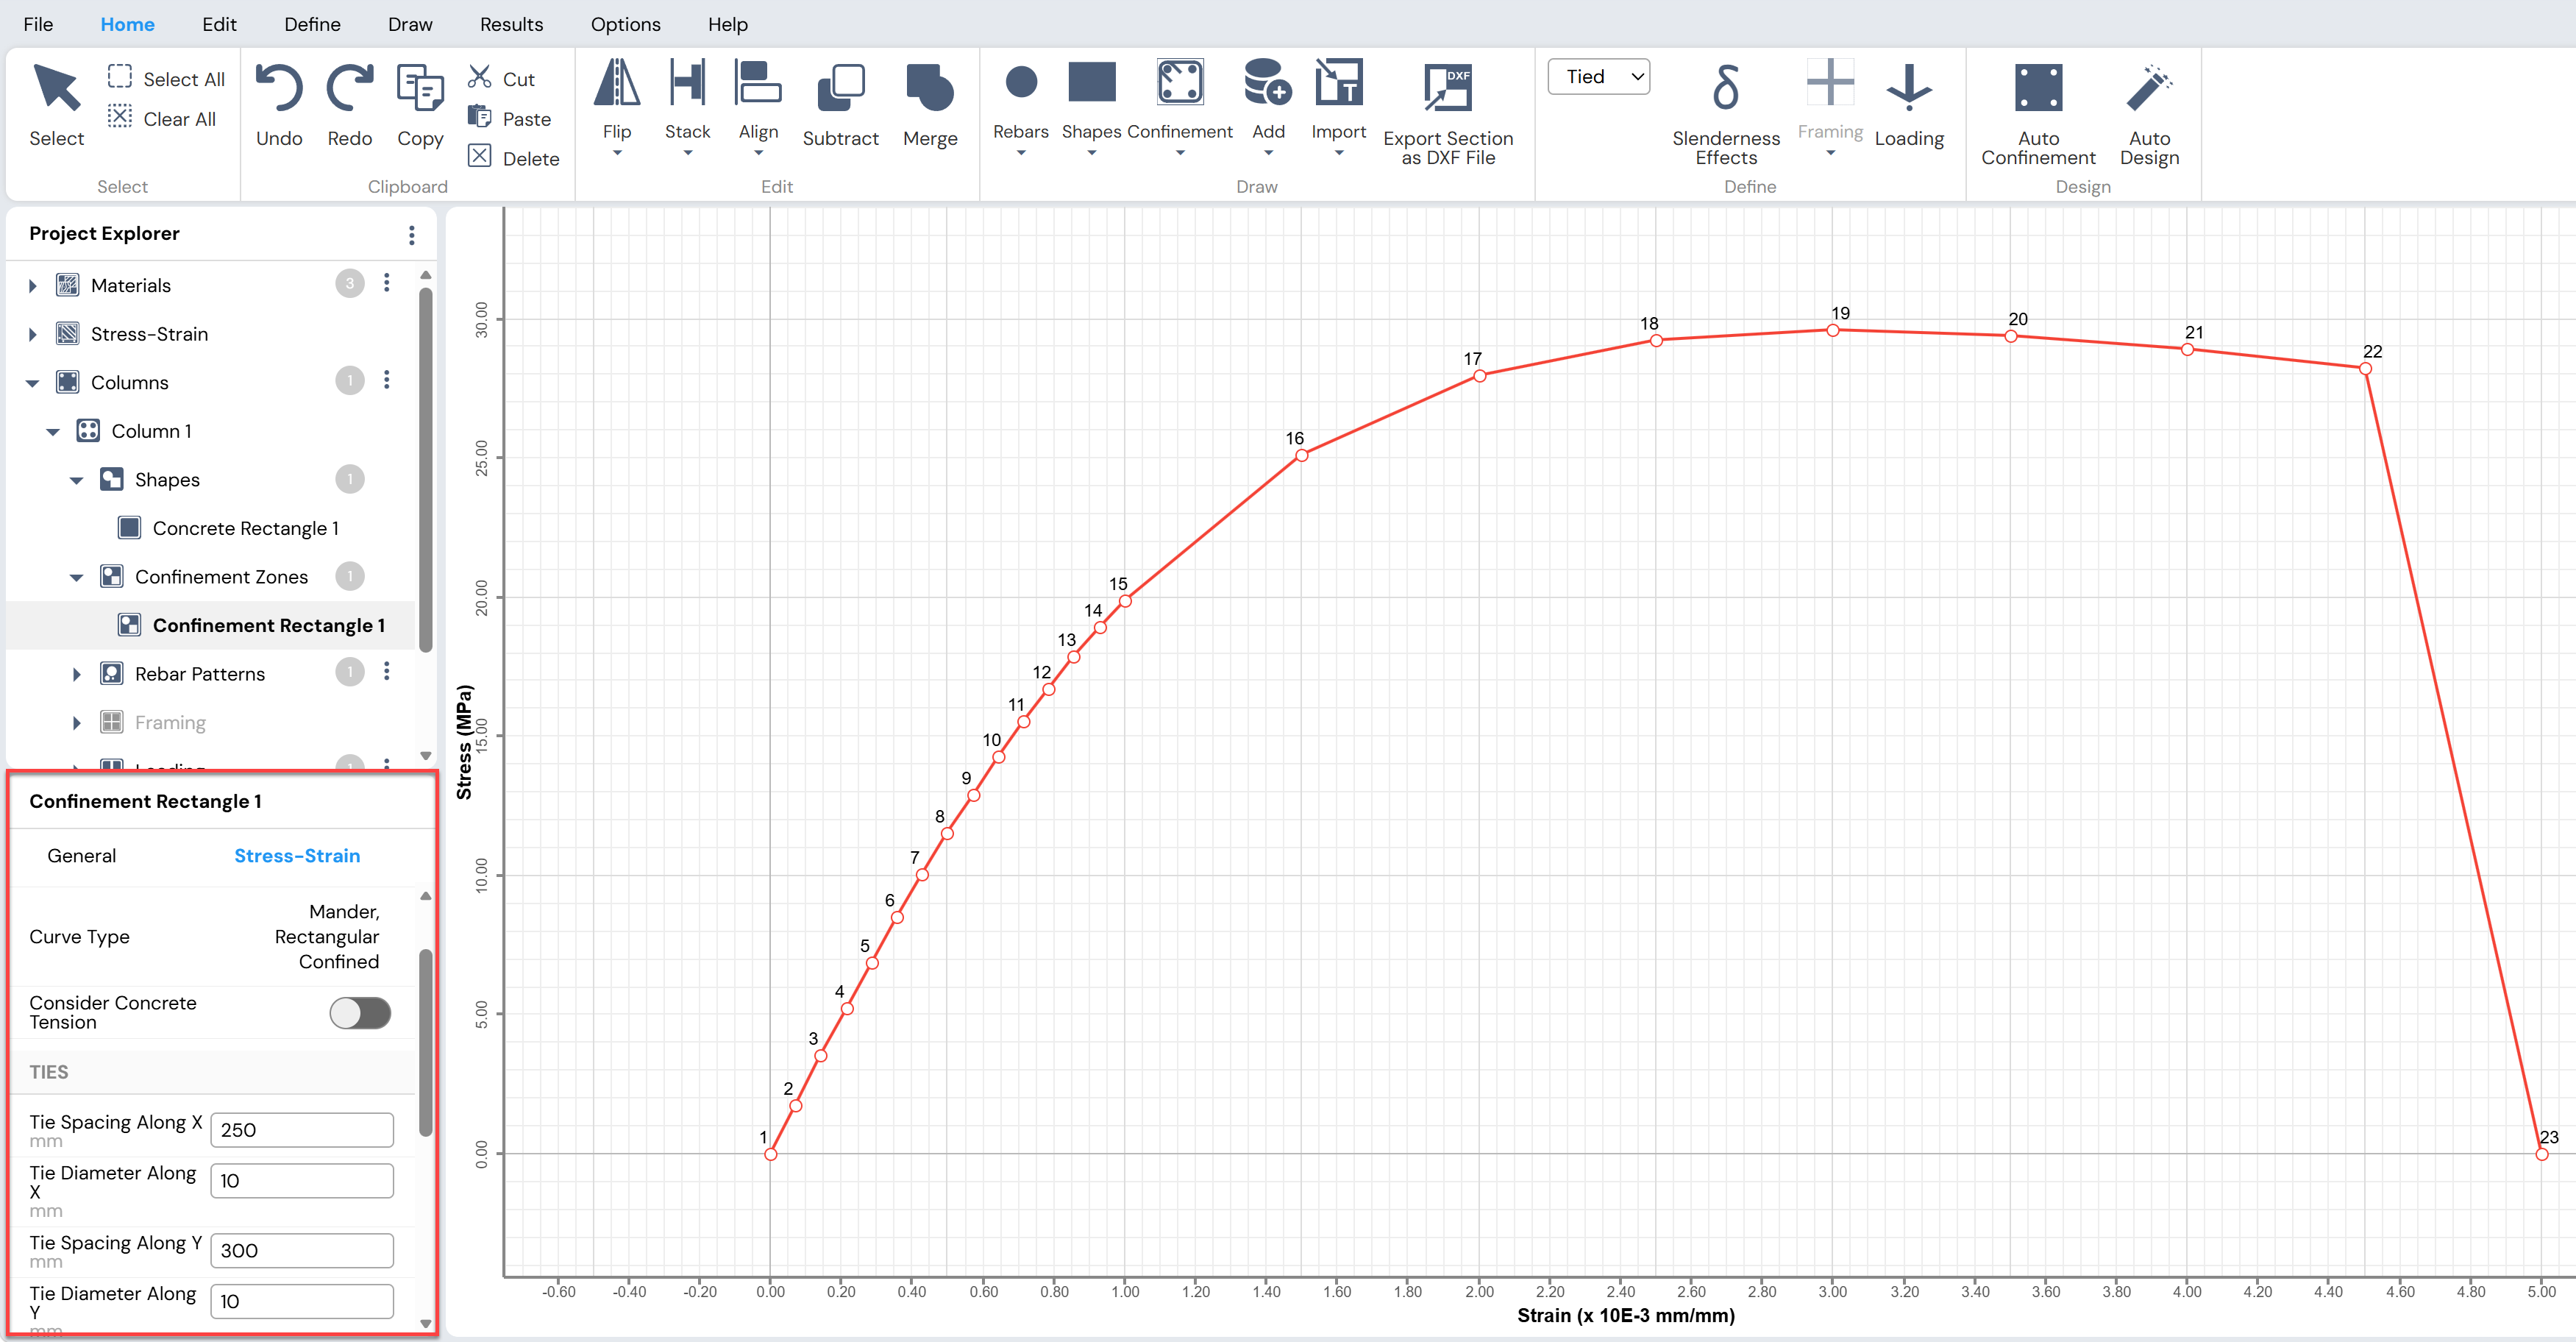
Figure: Confinement Model and Parameters
Review Material Properties
Under the Materials heading in the Stress–Strain tab:Review the material properties assigned to the confinement zone
By default, these properties match those assigned to the main section
Modify the values manually if required
Important Notes on Materials and Stress–Strain Models
Material properties are used for capacity calculations
Stress–strain and confinement model properties are used for moment–curvature analysis
By default:
Every concrete or steel shape has a corresponding stress–strain model
Every rebar material has a corresponding stress–strain model
Material properties and stress–strain properties are initially identical
However, the user may:
Assign different material properties to the stress–strain or confinement models
This does not affect capacity calculations
This flexibility allows moment–curvature analysis using material strengths higher than design values
Notes Specific to Auto Confinement Zones
For auto confinement zones:
Material properties are initially linked to those of the main section
Total main steel area is computed automatically by the program
Both material properties and steel area may be manually modified if required
If the section material is changed after creating an auto confinement zone:
- The user will be prompted to choose whether to update the material properties assigned to the stress–strain model
Draw Confinement
In this method, Column Designer allows the user to manually draw confinement zones directly on the column section. This approach provides greater flexibility when defining confinement regions.
The basic procedure for drawing confinement zones is described below.
Procedure for Drawing Confinement Zones
Select Column Section
Select the desired column section from Project Explorer.Draw Confinement Zone
Click:Draw Menu → Confinement → Rectangle, or
Draw Menu → Confinement → Circle
Then draw the confinement zone directly on the section using the mouse.
Note:
Only rectangular and circular confinement zones are available.
- Modify Confinement Geometry
The dimensions of the confinement zone can be modified by entering values in the edit boxes under the General tab of the Property Grid.
The Property Grid is activated by:
Selecting the confinement zone in the working area, or
Selecting it from Project Explorer → Confinement Zones
Move Confinement Zone
The confinement zone can be moved to the desired location using the same methods available for other shapes.Assign Confinement Model
By default, Mander’s Confined Model is assigned to the confinement zone.
To change the confinement model:
- Select the desired model from the Stress–Strain Curve drop-down list under the General tab of the Property Grid
New confinement models must be defined in advance using:
Define Menu → Stress Strain → Concrete, or
The button next to Project Explorer → Stress–Strain → Concrete
Define Tie and Confinement Parameters
After assigning the confinement model:Select the Stress–Strain tab of the Property Grid
Review and modify confinement parameters under the Ties heading, including:
Tie diameter
Tie spacing
Total main steel area
All parameters must be entered manually as required.
- Review Material Properties
Review the material properties under the Materials heading in the Stress–Strain tab of the Property Grid.
Important Notes for Drawn Confinement Zones
For manually drawn confinement zones:
Material properties are not linked to the material properties of the main section
The total main steel area must be calculated and entered manually by the user
Operations such as:
Merging
Subtracting
Aligning
Stacking
can be performed on confinement zones in the same way as for other shapes.
Merging confinement zones is permitted only when:
The zones have the same material properties, and
The zones use the same confinement model (rectangular or circular)
After merging confinement zones:
The user must verify all dimensions and parameters in the Stress–Strain tab
Modify values as necessary to ensure correctness
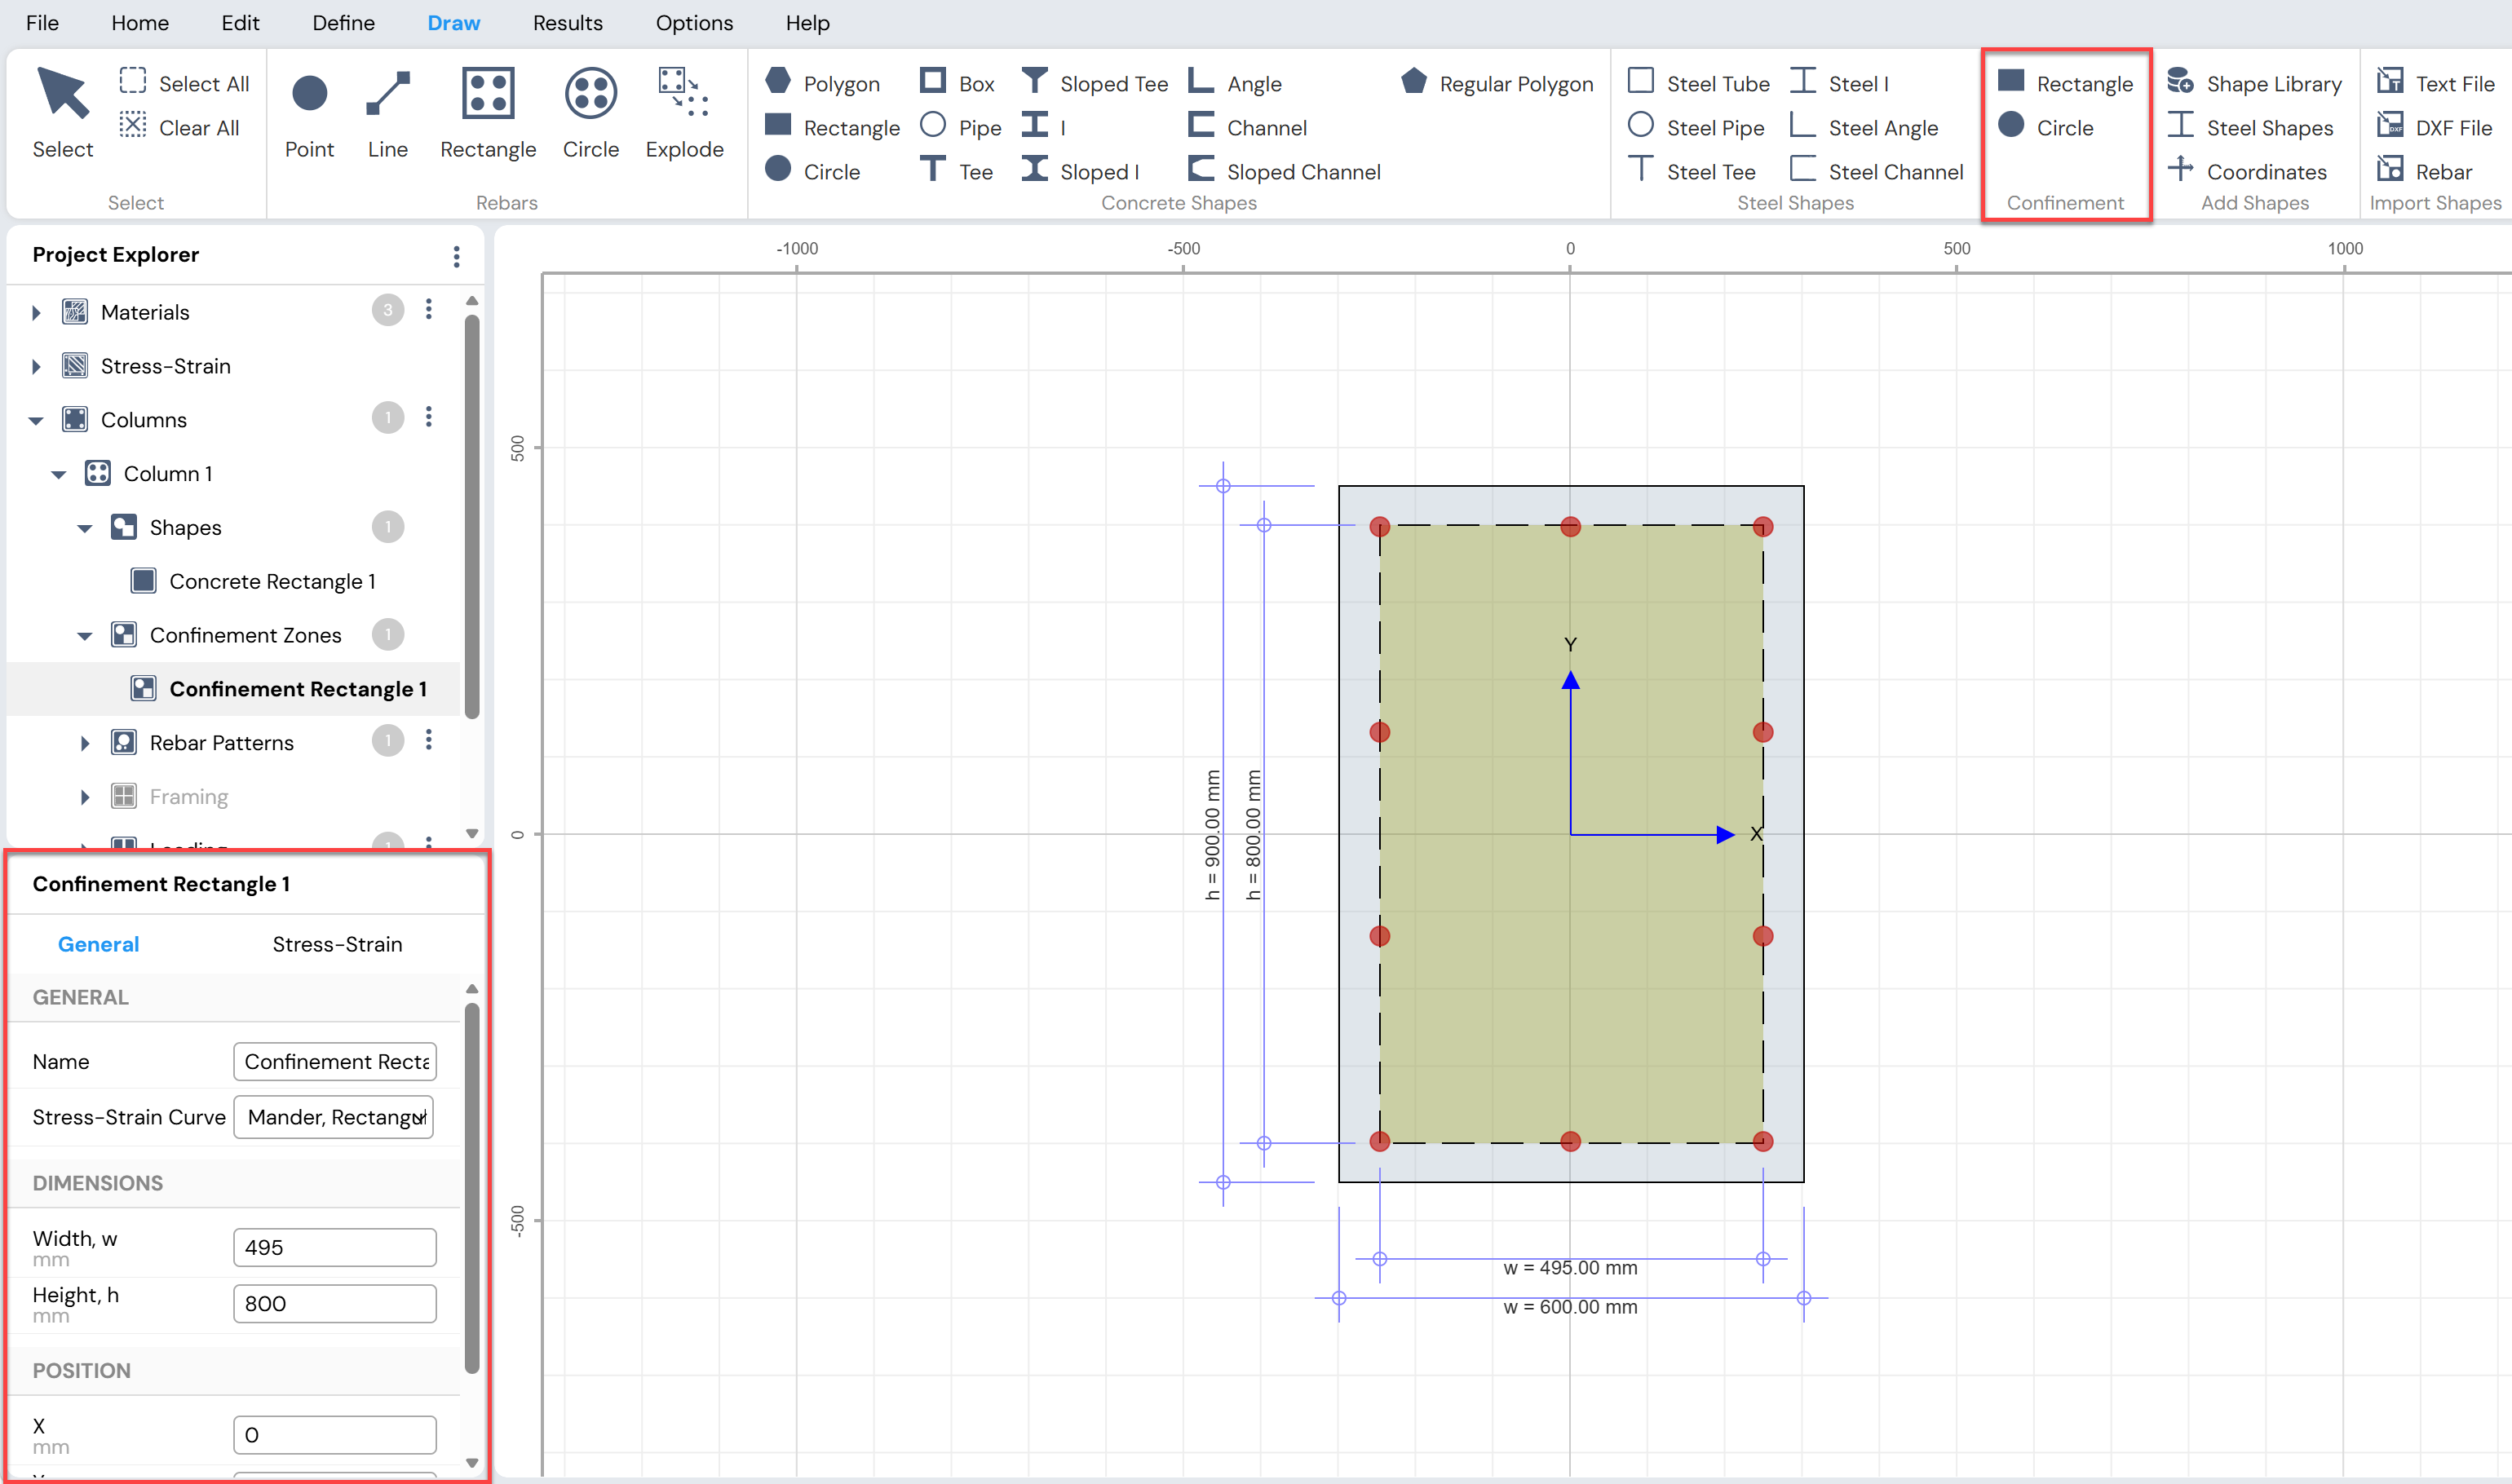
Figure: Drawing Confinement Zone Manually
Consider Slenderness Effects
Use the Define Menu → Slenderness → Slenderness Effects toggle to specify whether slenderness effects are to be considered for the current column.
When slenderness effects are enabled:
Framing Conditions must be defined
Framing information is used to compute:
Effective Length Factors (k)
Other parameters required for moment magnification, depending on the selected design code
Supported Design Codes for Slender Columns
Column Designer supports slenderness checks and magnified moment calculations for the following design codes:
ACI 318-11
ACI 318-14
ACI 318-19
IS 456:2000
CSA A23-3-14
BS 8110-97
Eurocode 2:2004
AS 3600-2018
Specify Column Framing Conditions
When the Slenderness Effects toggle is turned on, use:
Define Menu → Slenderness → Framing Conditions
to access the Column Framing Conditions form.
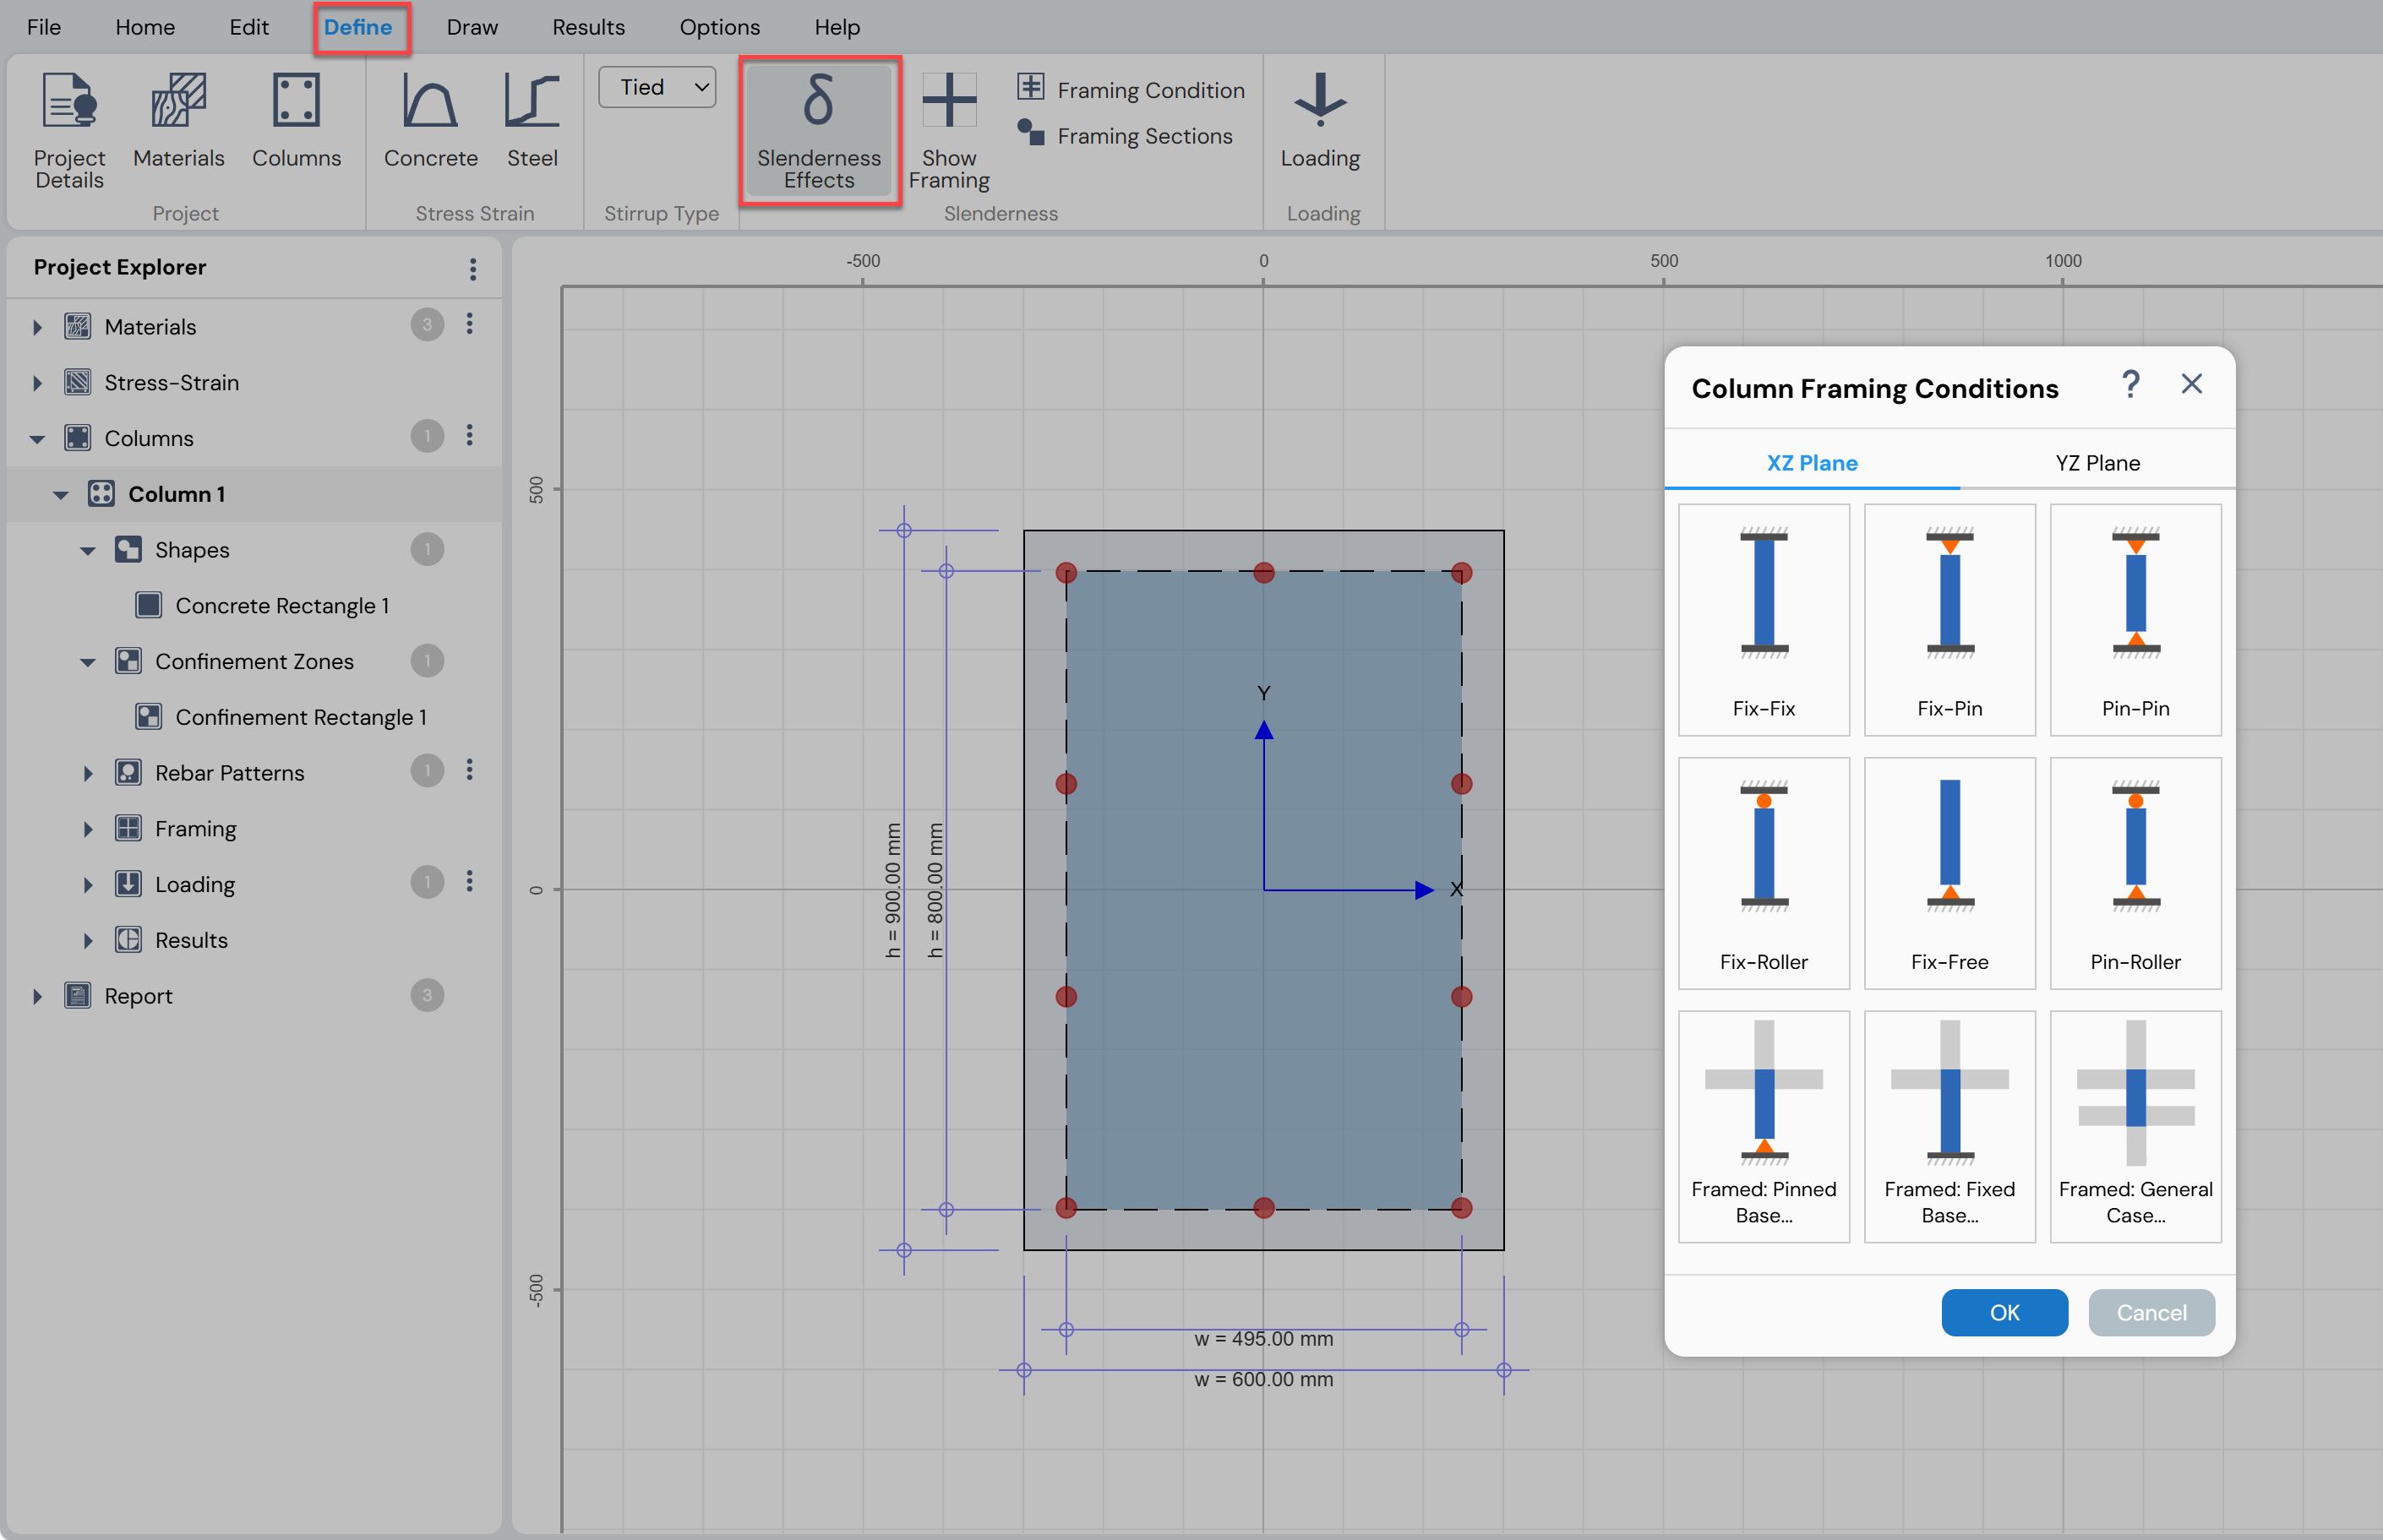
In this form, select the framing condition that best represents the column end and support conditions, such as:
Fixed–Fixed
Fixed–Pinned
Fixed–Roller
Fixed–Free
Pinned–Roller
Lowest-story framed columns with:
Pinned base
Fixed base
Intermediate-story columns connected to frame elements at both ends
Figure illustrates typical column framing conditions relative to the XZ and YZ planes for framed columns.
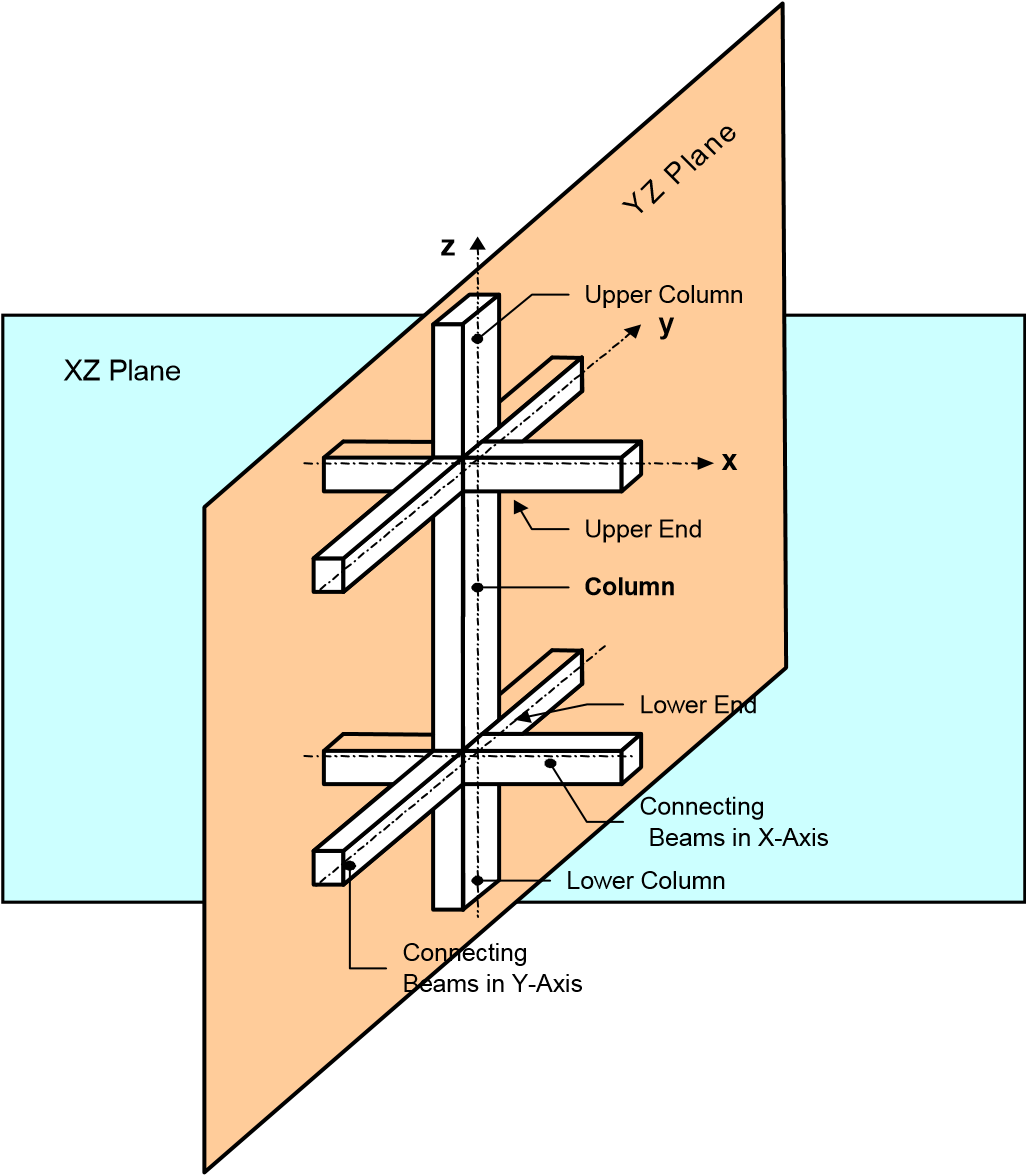
Figure: Column Framing Conditions
Viewing Framing Conditions
After selecting the framing condition, the framing configuration in the XZ plane is displayed in the working area, as shown in Figure.
The framing view can be displayed in:
XZ plane
YZ plane
3D view
Use the following tools available in the context-sensitive toolbar:
XZ / YZ / 3D buttons
Select XZ or YZ to view and edit framing parameters in the respective plane.
Select 3D to view the framing condition in three dimensions.Zoom In button
Zoom in to enlarge the framing view.
Zooming can also be performed using the mouse scroll wheel.Zoom Out button
Zoom out to reduce the framing view size.
Zooming can also be performed using the mouse scroll wheel.Reset and Refresh View button
Restore the framing display to its default view.
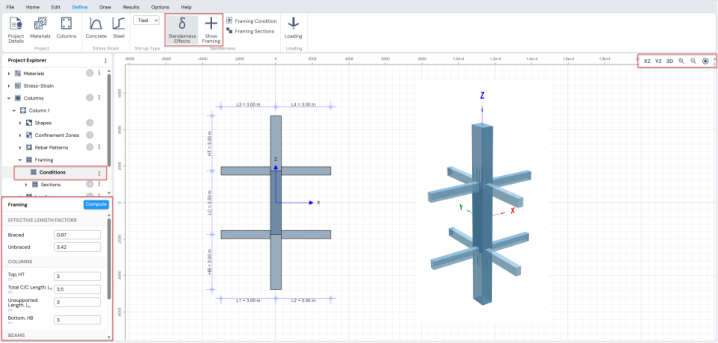
Figure: Framing Conditions View (2D &3D)
Effective Length Factor
The following procedure is used to compute the Effective Length Factors (k).
Procedure for Calculating Effective Length Factors
Show Framing Configuration
Click Define Menu → Slenderness → Show Framing to display the framing conditions.Enter Framing Parameters
For each plane (XZ and YZ), the Framing Grid (Figure) is activated in the context-sensitive area.
Enter framing parameters such as:Unsupported length of the column
Center-to-center length of columns
Length of connecting beams
Notes:
For Eurocode 2:2004, the stiffness contribution of top and bottom columns is ignored by default.
A Consider Non-failing Columns toggle is provided to allow inclusion of these columns if desired.For BS 8110-97, additional options are available:
Simply Supported, Top
Simply Supported, Bottom
These toggles allow beams framing into the column to be treated as simply supported.
- Select Connected Members
Select each connected beam or column to activate the Frame Member Grid, where the assigned section properties can be viewed.
By default:
Program-defined beam framing sections are assigned to beams
Program-defined column framing sections are assigned to columns
If no changes are required, skip to Step 7.
- Define Framing Sections
Click Define Menu → Slenderness → Framing Sections to open the Framing Sections form.
This form allows users to:
Add new framing sections
Rename existing sections
Remove unused sections
- Edit Framing Section Properties
Select the desired framing section from
Project Explorer → Columns → Framing → Sections.
The selected section is displayed in the working area, and the Property Grid is activated.
Modify dimensions and properties as required.
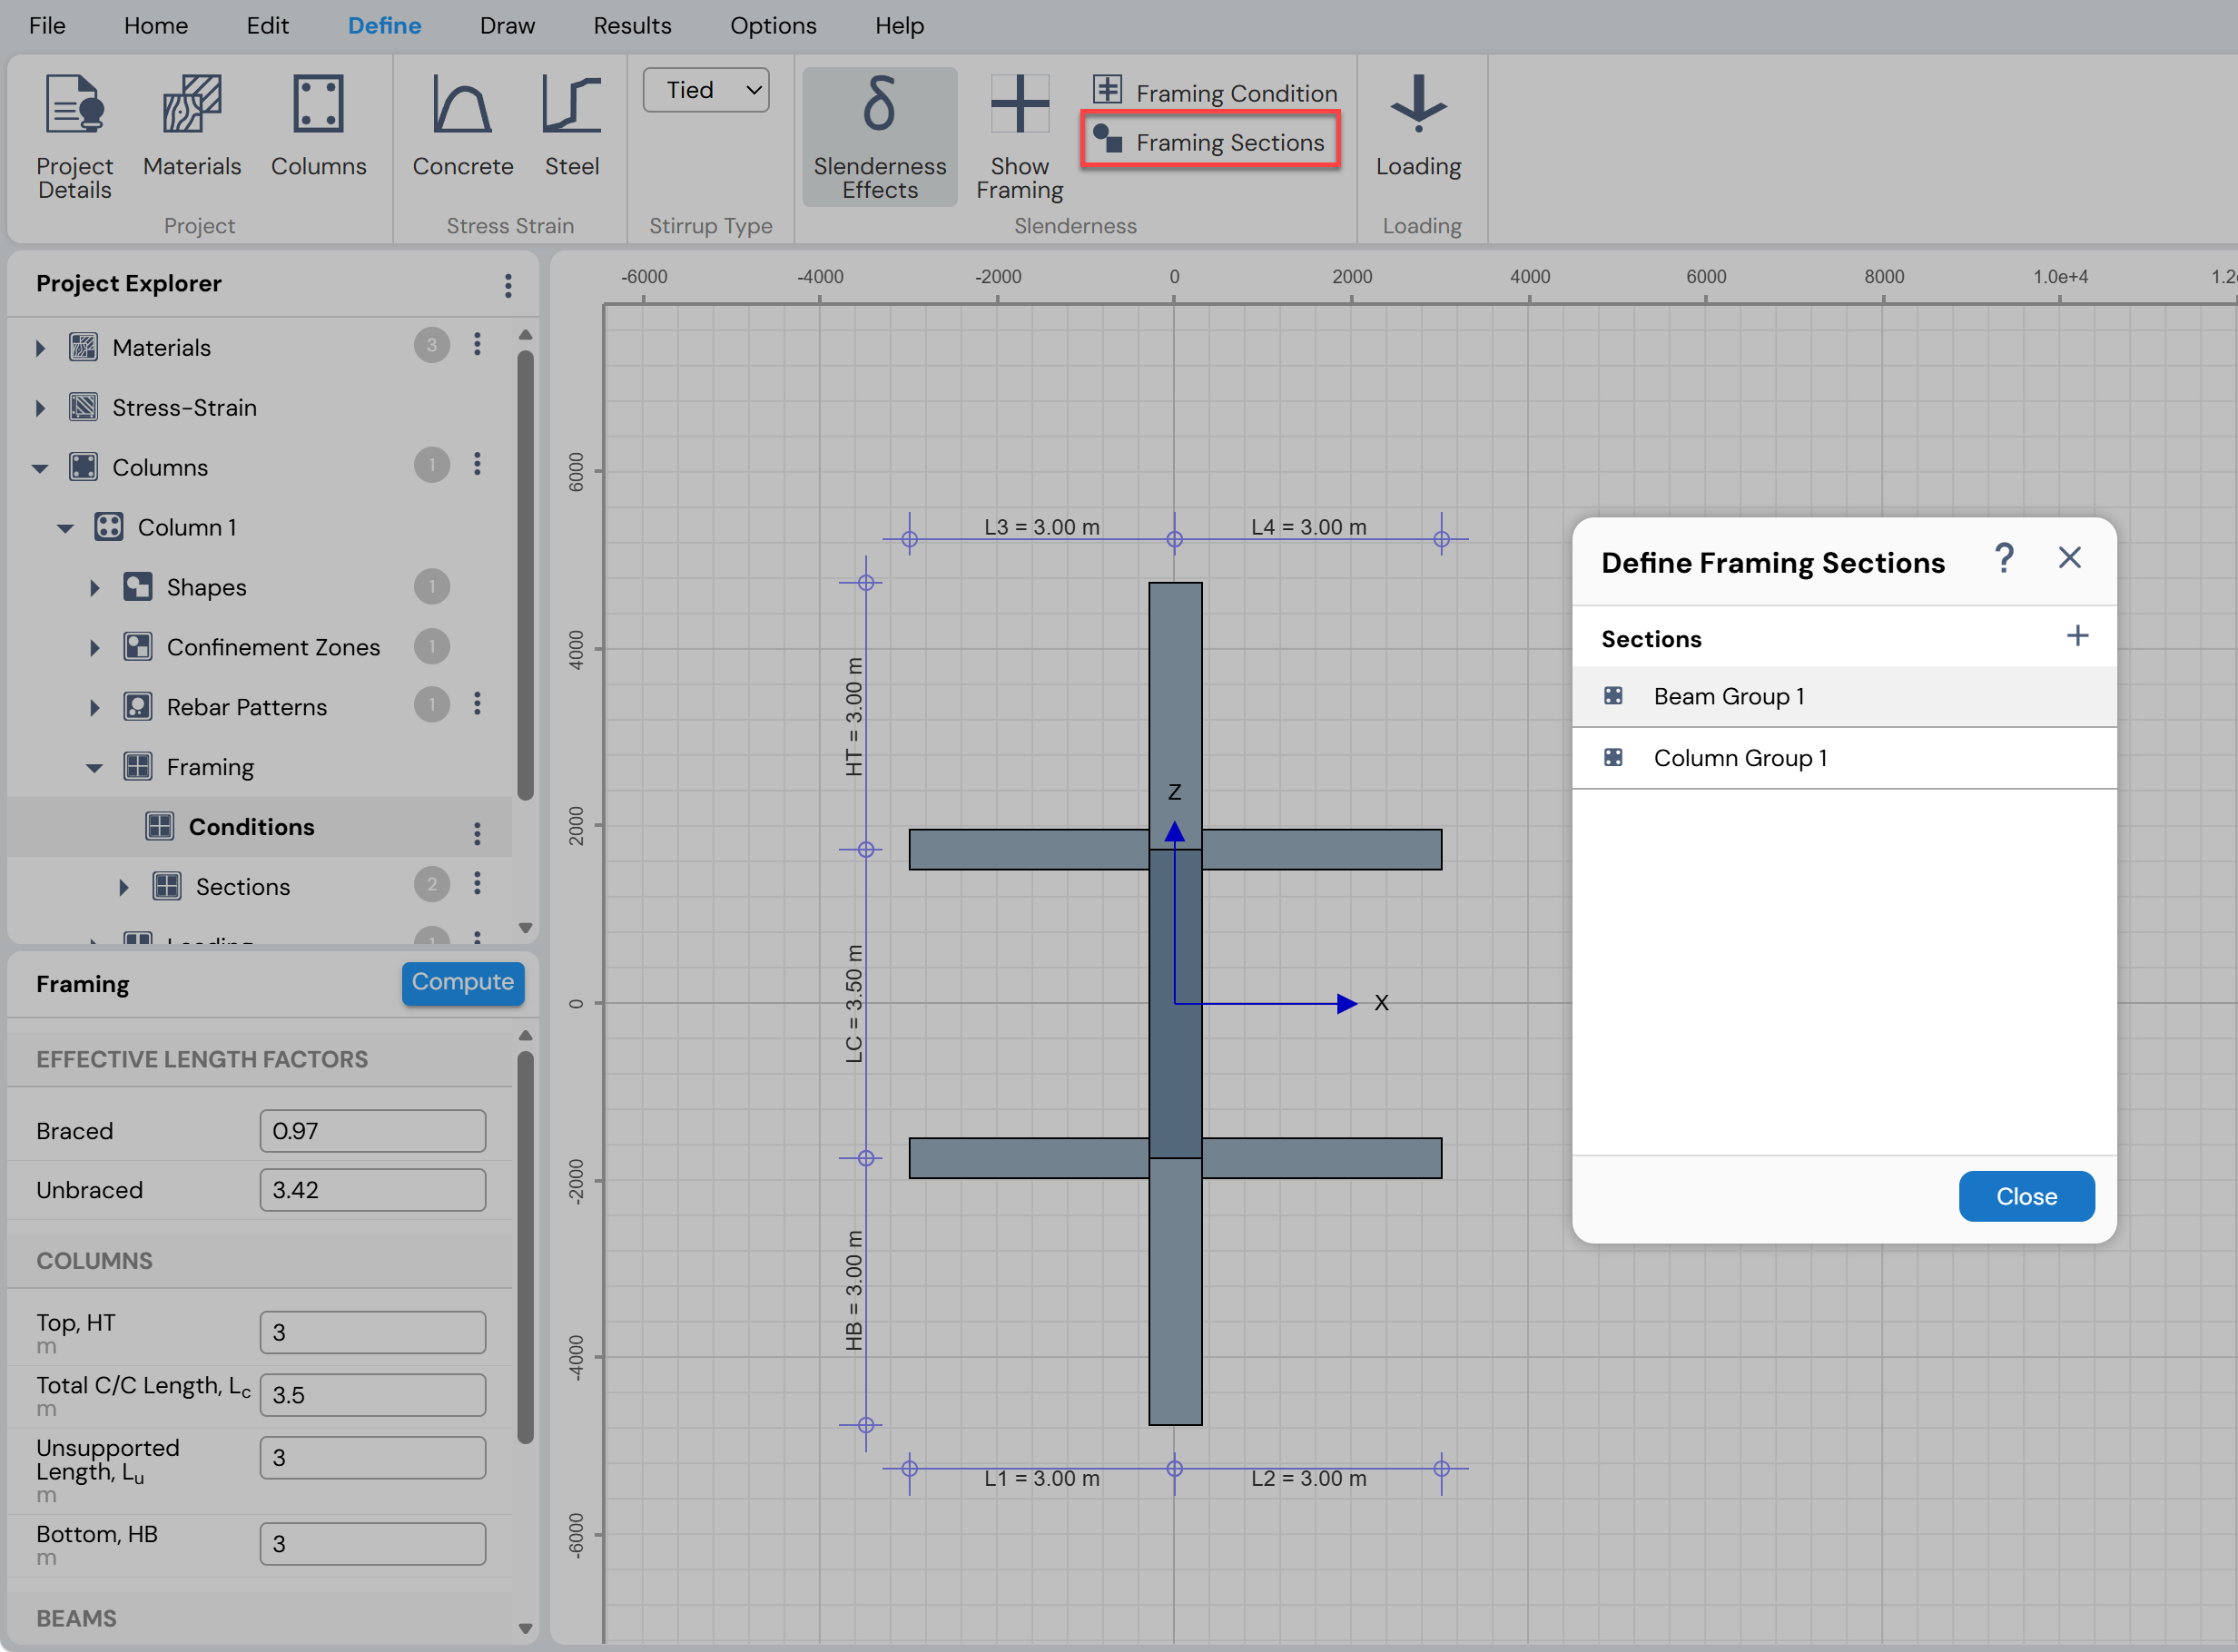
Figure: Defining Framing Sections
Review Framing Configuration
After defining or modifying framing sections, click
Define Menu → Slenderness → Show Framing to review the updated framing condition.Assign Framing Sections to Members
Select the connected beam or column whose section is to be changed.
In the Frame Member Grid, select the desired section from the Section drop-down list.Compute Effective Length Factors
Once all framing parameters and sections have been assigned correctly, click the Compute button in the Framing Grid to calculate the k-factors.Repeat for Both Planes
Perform the above steps for both the XZ and YZ planes.
Alternatively, effective length factors may be entered directly by the user.
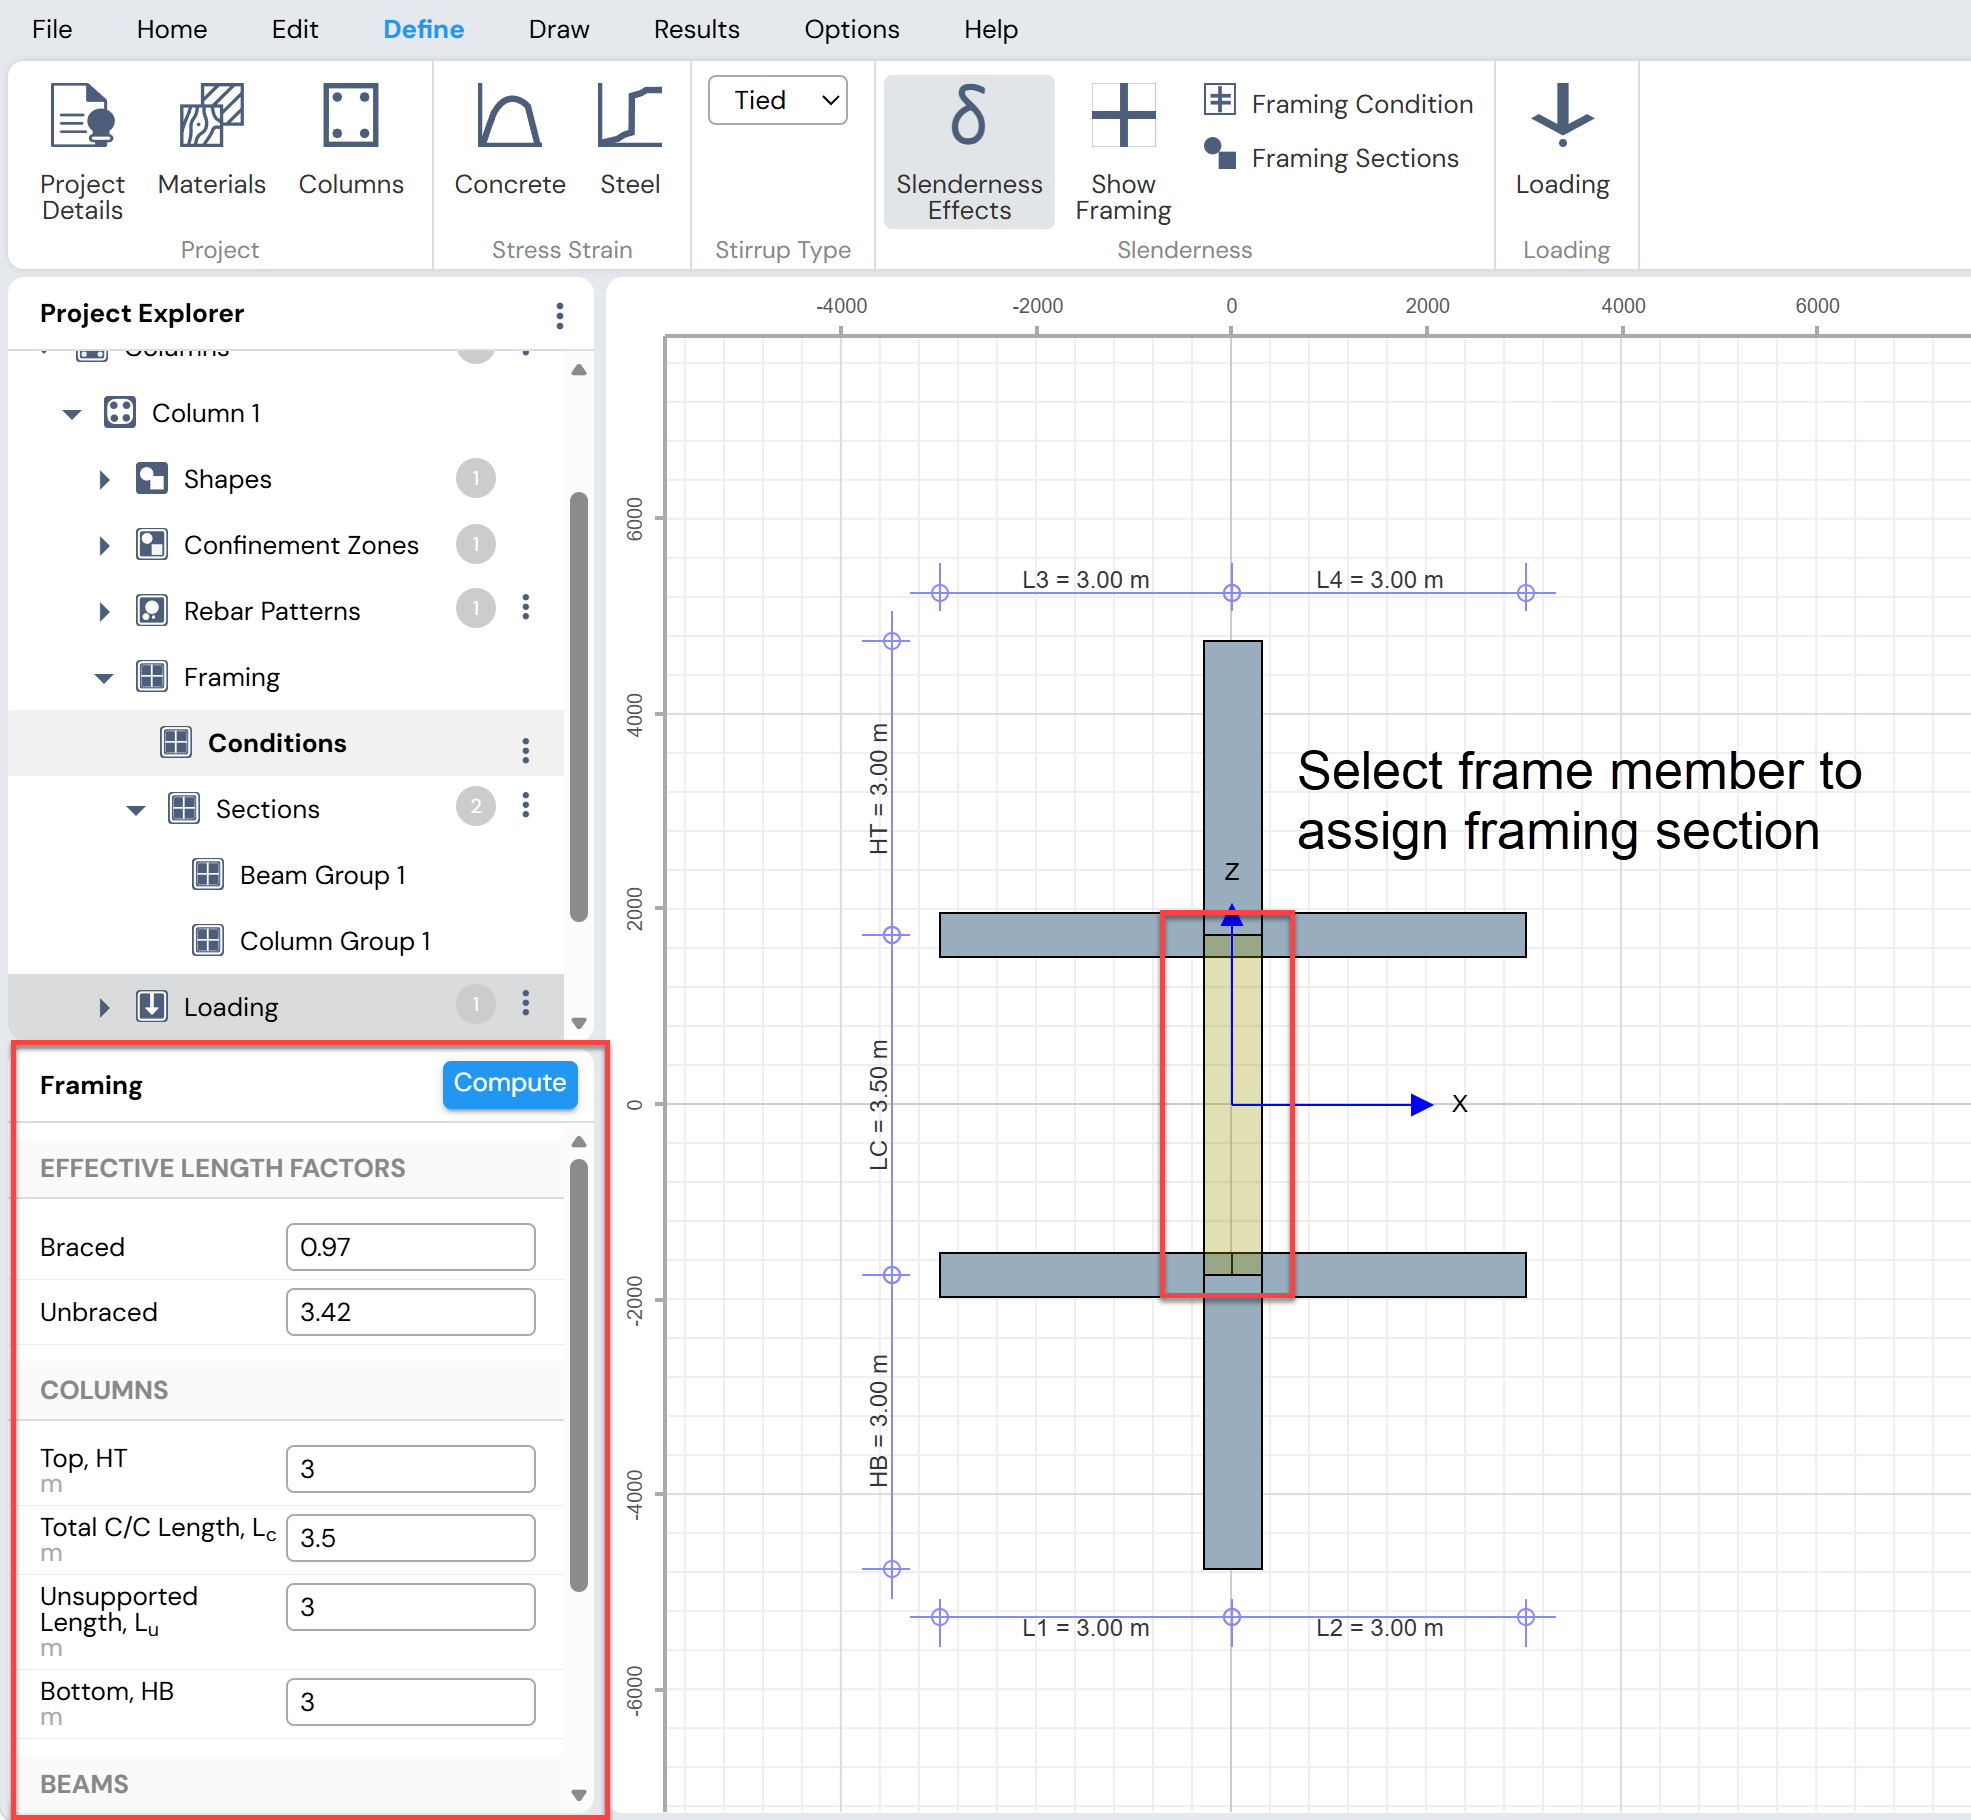
Figure: Assigning Framing Section to Members
Additional Notes
The Framing Conditions, Framing Sections, and Show Framing buttons are active only when Slenderness Effects are enabled.
The framing view and Framing Grid can also be accessed from:
Project Explorer → Columns → Framing → Conditions
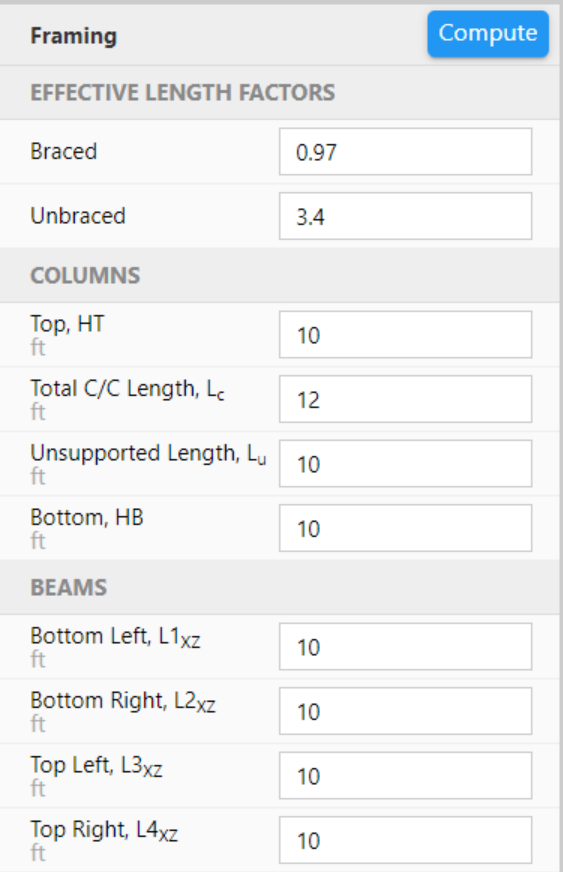
Figure: Framing Grid
Specify Column Loads
Column Designer provides two modes for defining column loads:
Simple Loading Mode
Detailed Loading Mode
Simple loading is intended for short columns where slenderness effects are not considered.
Detailed loading is required for slender columns where moment magnification must be evaluated.
Column Designer automatically opens the Loading form in either Simple Mode or Detailed Mode depending on whether the Slenderness Effects toggle is turned off or on, respectively.
Figure illustrates the loading applied to a column and its cross-section.
Unlimited load combinations can be defined for a column section using:
Define Menu → Loading
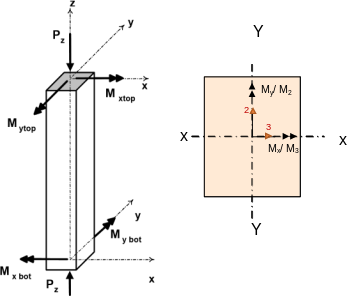
Figure: Column Loading on Column and Cross-Section
Sign Convention Used in Column Designer
Axial Load
Compression is considered positive
Tension is considered negative
Bending Moment
For double curvature, top and bottom end moments have opposite signs
For single curvature, top and bottom end moments have the same sign
This convention is consistent with ETABS.
Simple Loading Mode
Simple loading is applicable when:
The column is designed as a short column
Slenderness effects are ignored
Loads and moments have already been magnified by separate analysis (e.g., P-Delta analysis in ETABS)
Detailed framing or loading information is not available
Defining Simple Load Combinations
For each simple load combination, specify:
Load combination name
Axial load (Pu)
Top and bottom bending moments about:
X-axis (Mux)
Y-axis (Muy)
Multiple load combinations may be defined as required.
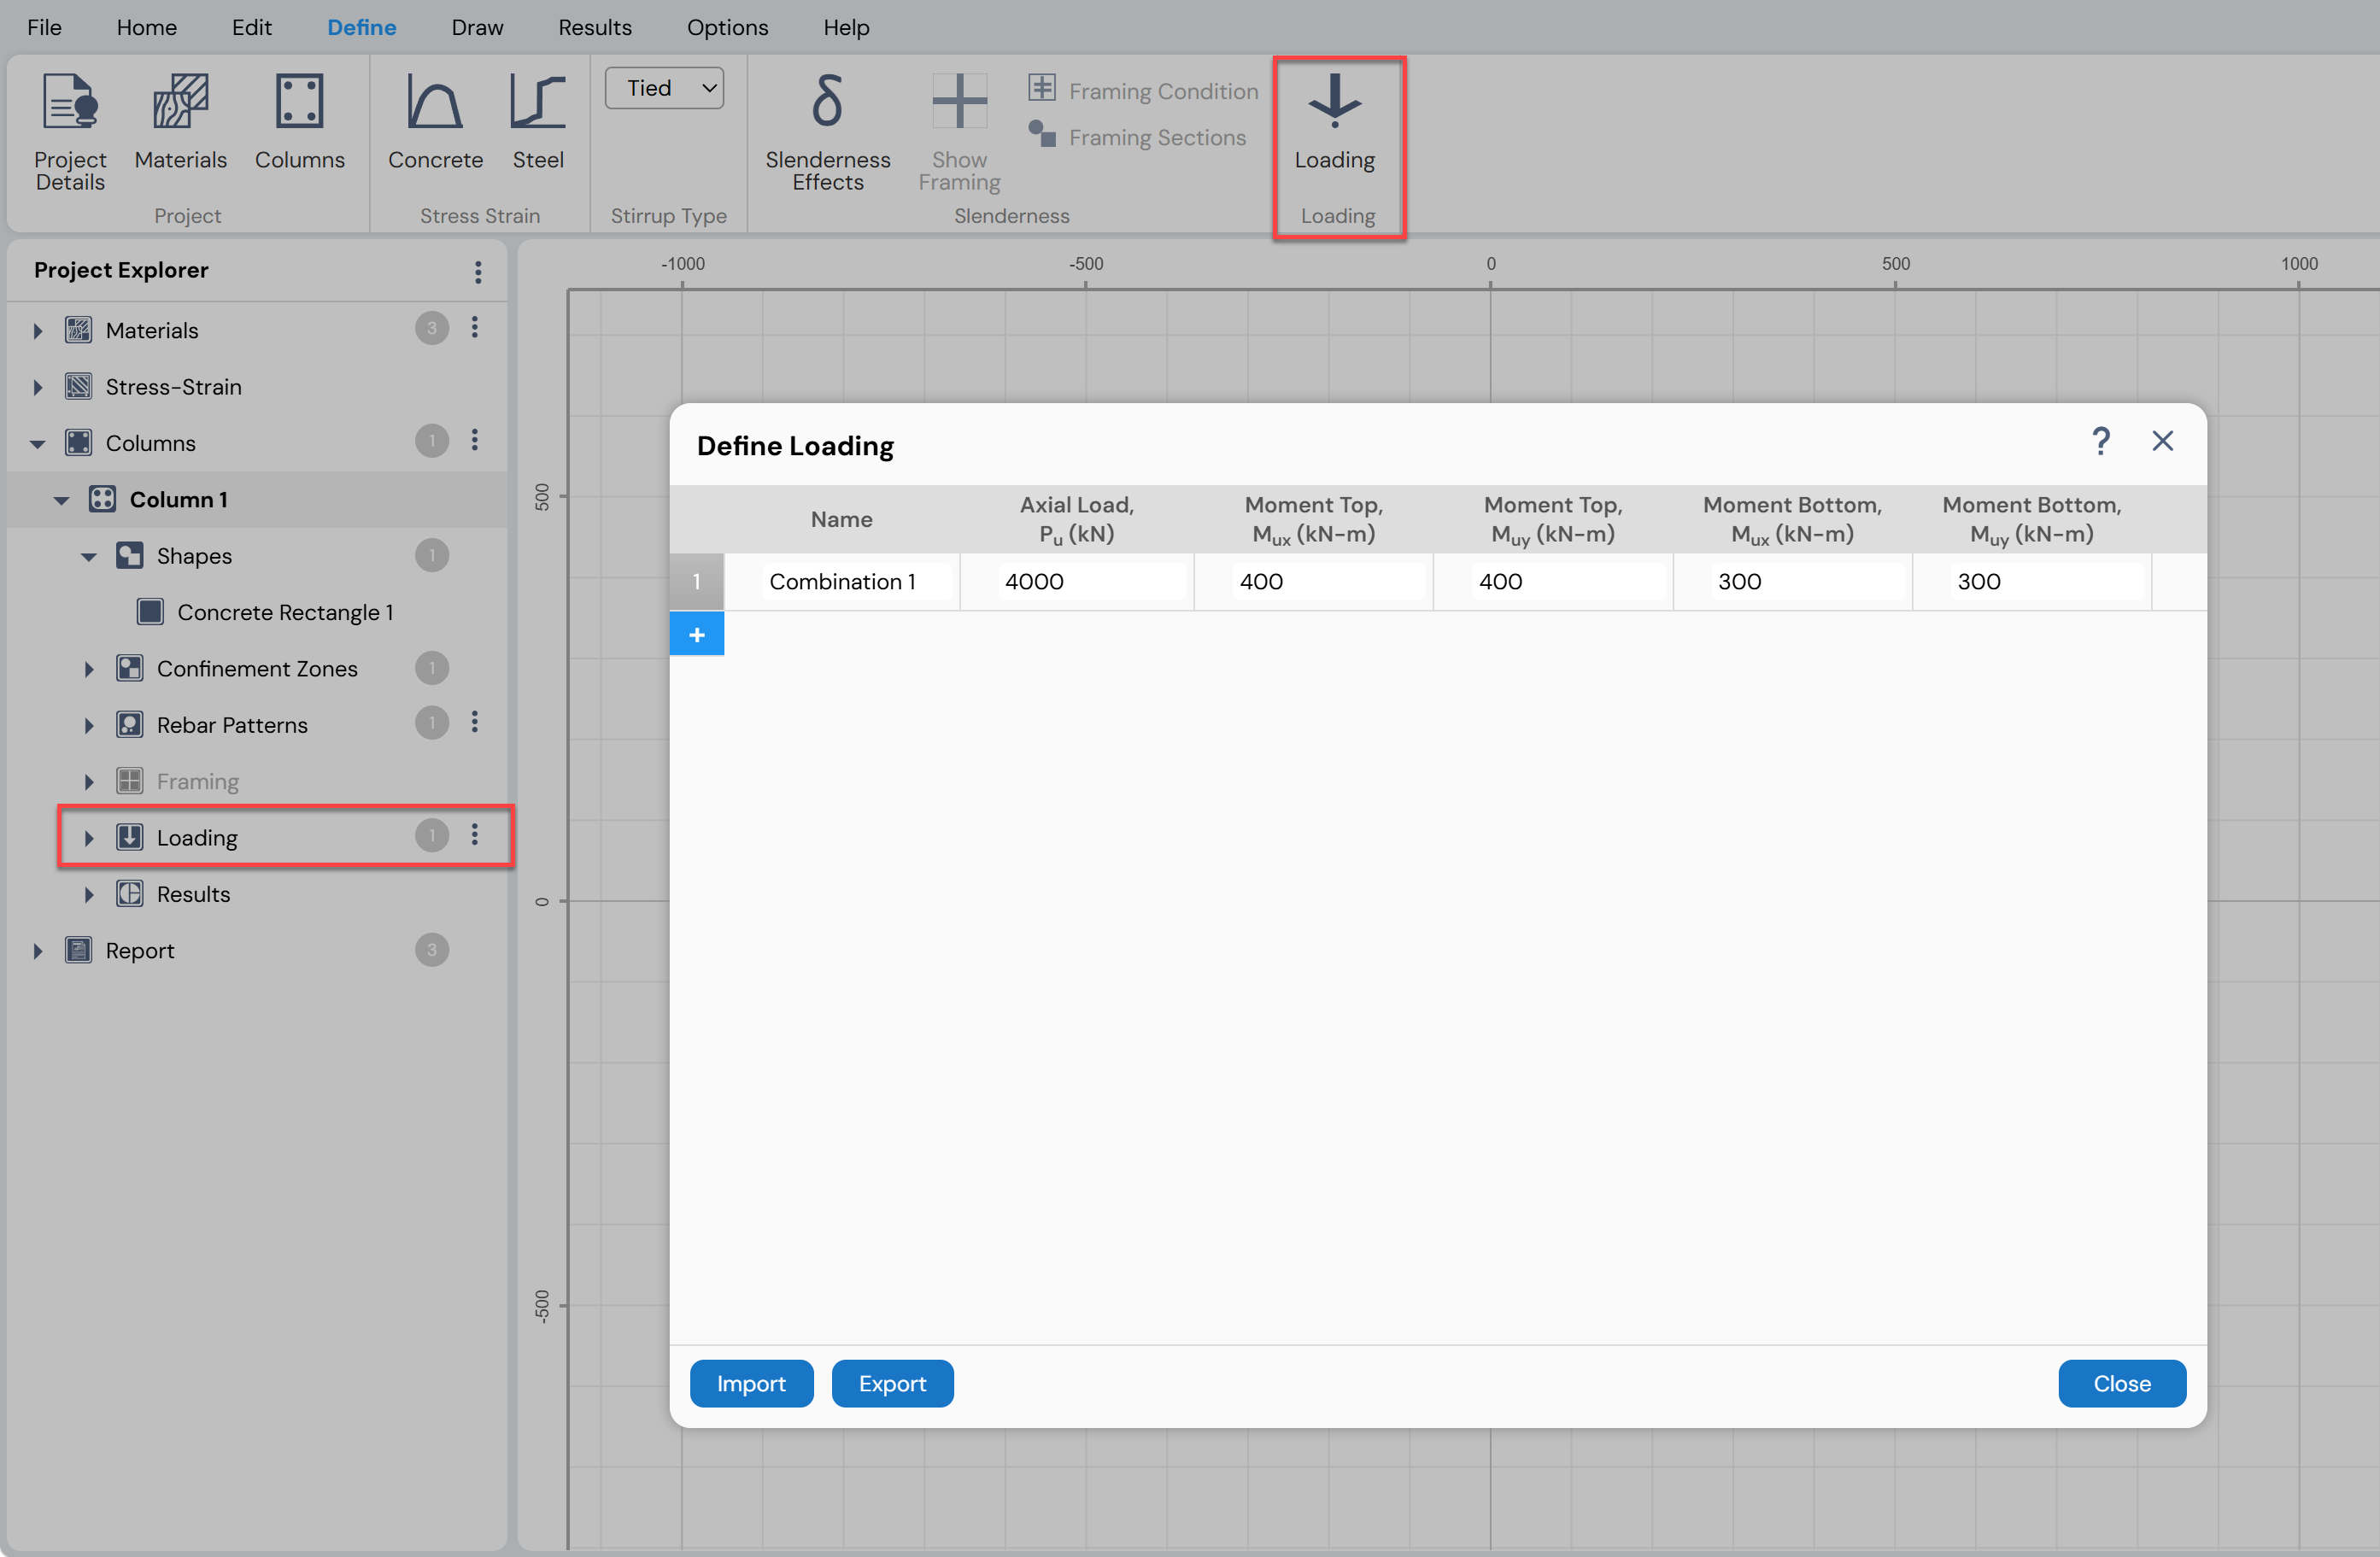
Figure: Defining Simple Load Combinations for Columns
Importing Simple Loads from Text Files
The Import button allows load combinations to be imported from text files.
Required parameter order:
Name
Axial Load
Moment Top (X-axis)
Moment Top (Y-axis)
Moment Bottom (X-axis)
Moment Bottom (Y-axis)
Parameters must be comma-separated or tab-separated
Single-space separation is not supported
Imported values are assumed to use the project unit system
Importing Simple Loads from Excel Spreadsheets
Required column headers (uppercase):
NAME
PU
MUXT
MUYT
MUXB
MUYB
Notes:
Empty cells are assumed to be zero
Imported values use the project unit system
Exporting Simple Loads
Load combinations can be exported using the Export button.
Text File Format
Parameters separated by commas
Same parameter order as import
Excel Spreadsheet Format
Same column headers as import
Same parameter order below the header row
Detailed Loading Mode (For Slender Columns)
Detailed loading is required when slenderness effects are considered.
Load combinations are defined separately for:
Along X (moments about X-axis)
Along Y (moments about Y-axis)
General Procedure
Select the loading direction (Along X or Along Y)
Specify the load combination name
Enter code-dependent parameters
Click the Add button to create additional combinations
Edit combinations directly in the table as needed
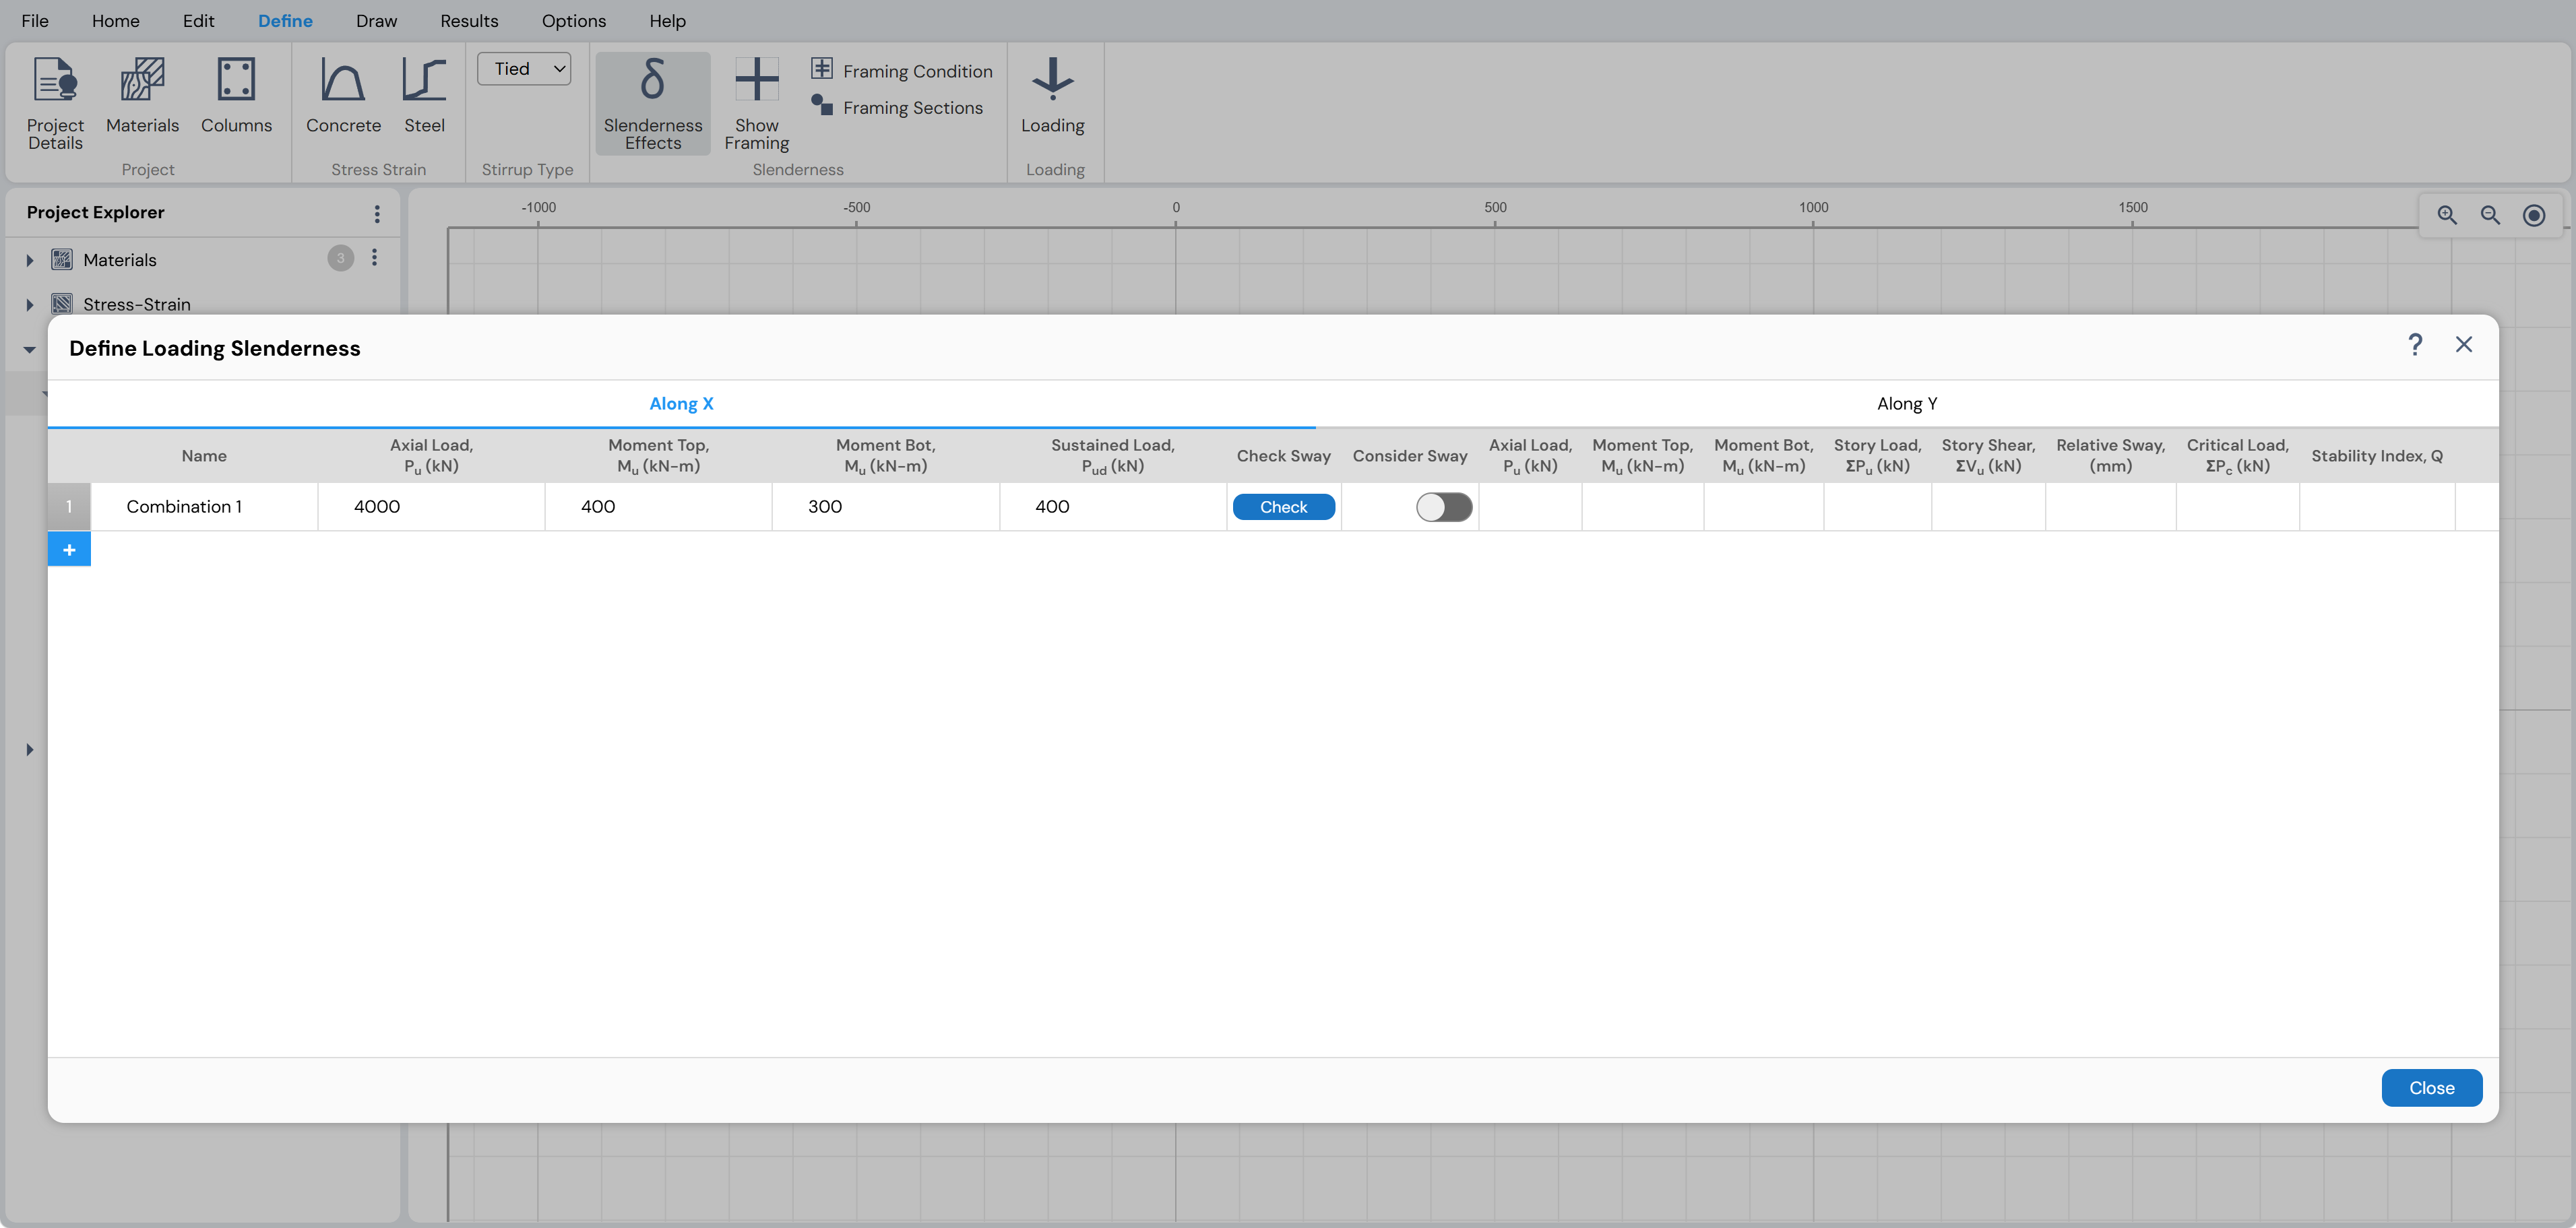
Figure: Defining Loading for Slender Columns
Code-Specific Detailed Loading Requirements
ACI 318-11 / 14 / 19
Specify axial load and non-sway top and bottom moments
Click Check under the Check Sway column to open the Sway Conditions form
Three sway-check methods are available:
Stability Index
Second-Order Analysis
Relative Stiffness of Bracing to Columns
If the column is identified as sway:
The Consider Sway toggle is activated automatically
Sway-related input fields become available
Users may manually force a column to be treated as sway by turning on the Consider Sway toggle.
IS 456:2000
Specify axial load, top moment, and bottom moment
Perform sway check using the same three methods
Manual override of sway behavior is permitted
CSA A23-3-04
- Procedure is identical to that used for ACI design codes
Eurocode 2:2004
Specify axial load, top moment, and bottom moment
Column is considered braced by default
Use Consider Unbraced toggle to change this assumption
Important Notes for Eurocode 2
Moment magnification is not considered for composite sections
Only rebar area is considered (steel shape area is ignored)
Parameters for magnification may be specified under:
Options Menu → Partial Safety Factors
Options Menu → Slenderness Parameters
BS 8110-97
Specify axial load, top moment, and bottom moment
Column is considered braced by default
Use Consider Unbraced toggle to change this assumption
AS 3600-2018
Specify:
Axial load
Top and bottom moments
Loading factor
Column is considered braced by default
Use Consider Unbraced toggle to activate sway-related inputs
Note:
The loading factor is the ratio of axial load due to:
Permanent actions (dead load)
Imposed actions (live load)
as defined in AS 3600-2018 Clause 10.4.3(2).
Viewing Final Design Loads
Final design loads after moment magnification can be viewed from:
Results Menu → Capacity → Design Loads, or
Project Explorer → Results → Capacity → Design Loads
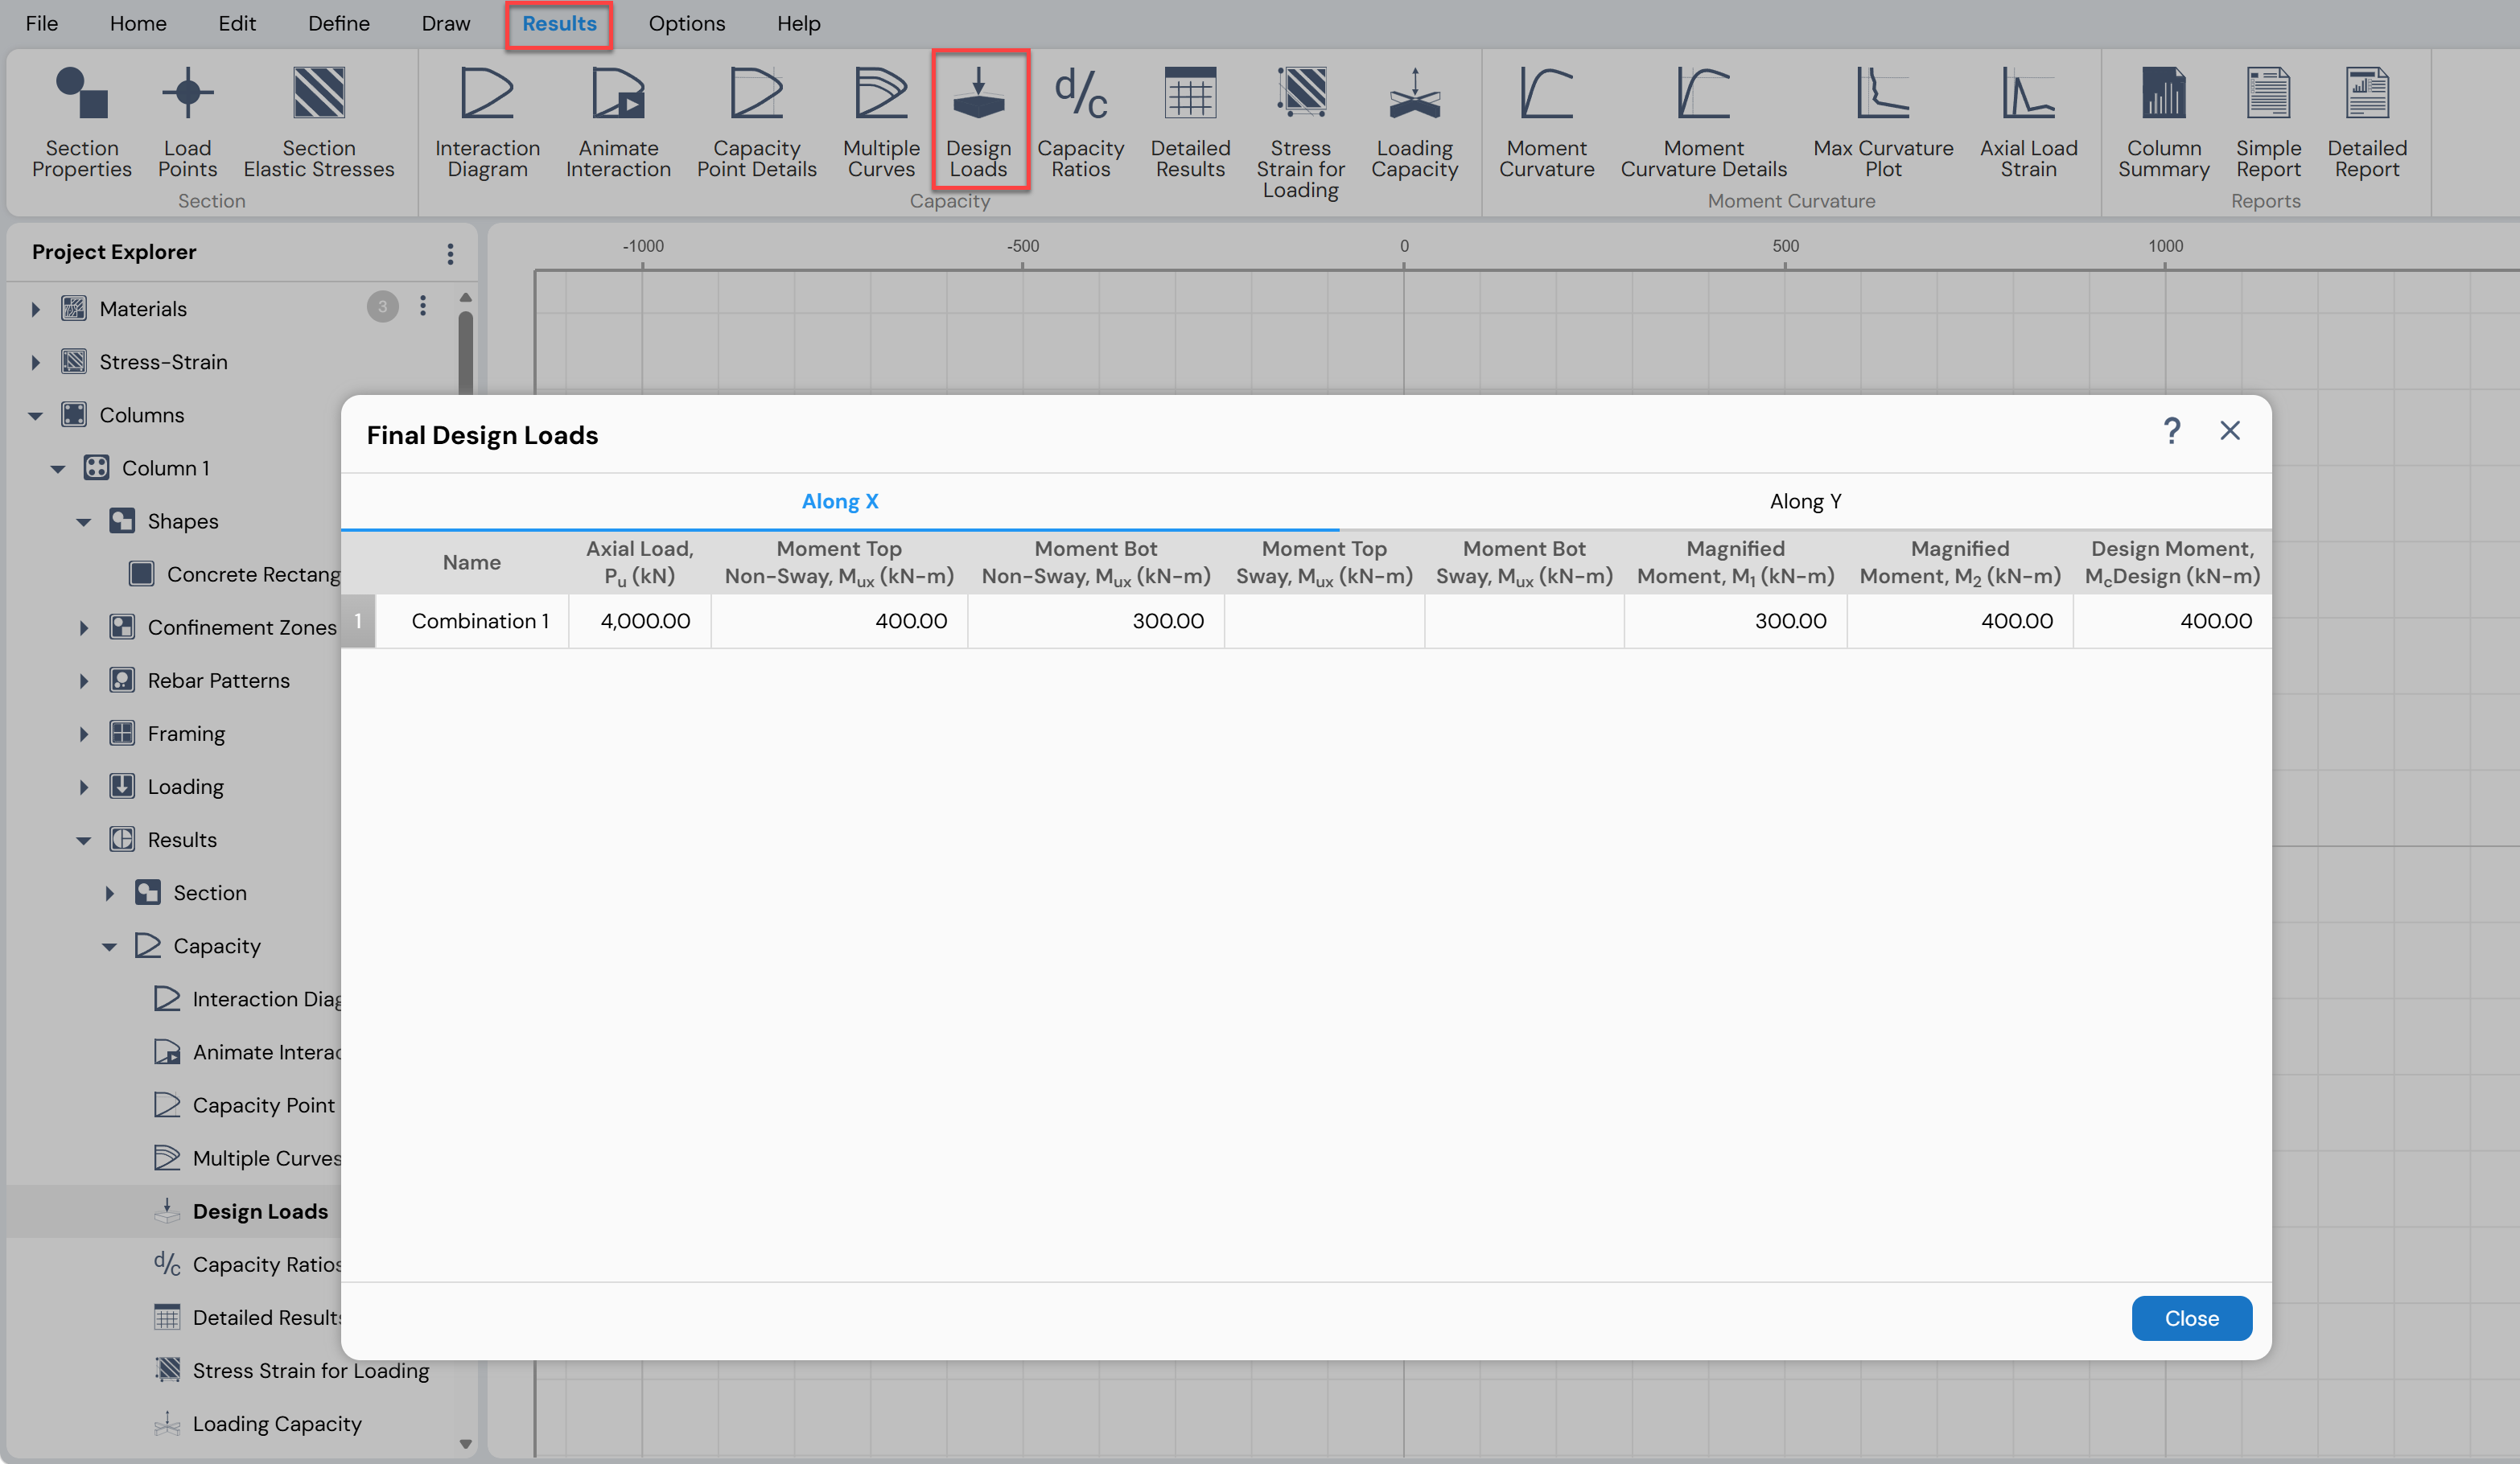
Figure: Viewing Final Design Loads
Sway Check (Based on ACI 318-14)
Click the Check button under the Check Sway column to access the Sway Conditions form shown in Figure.
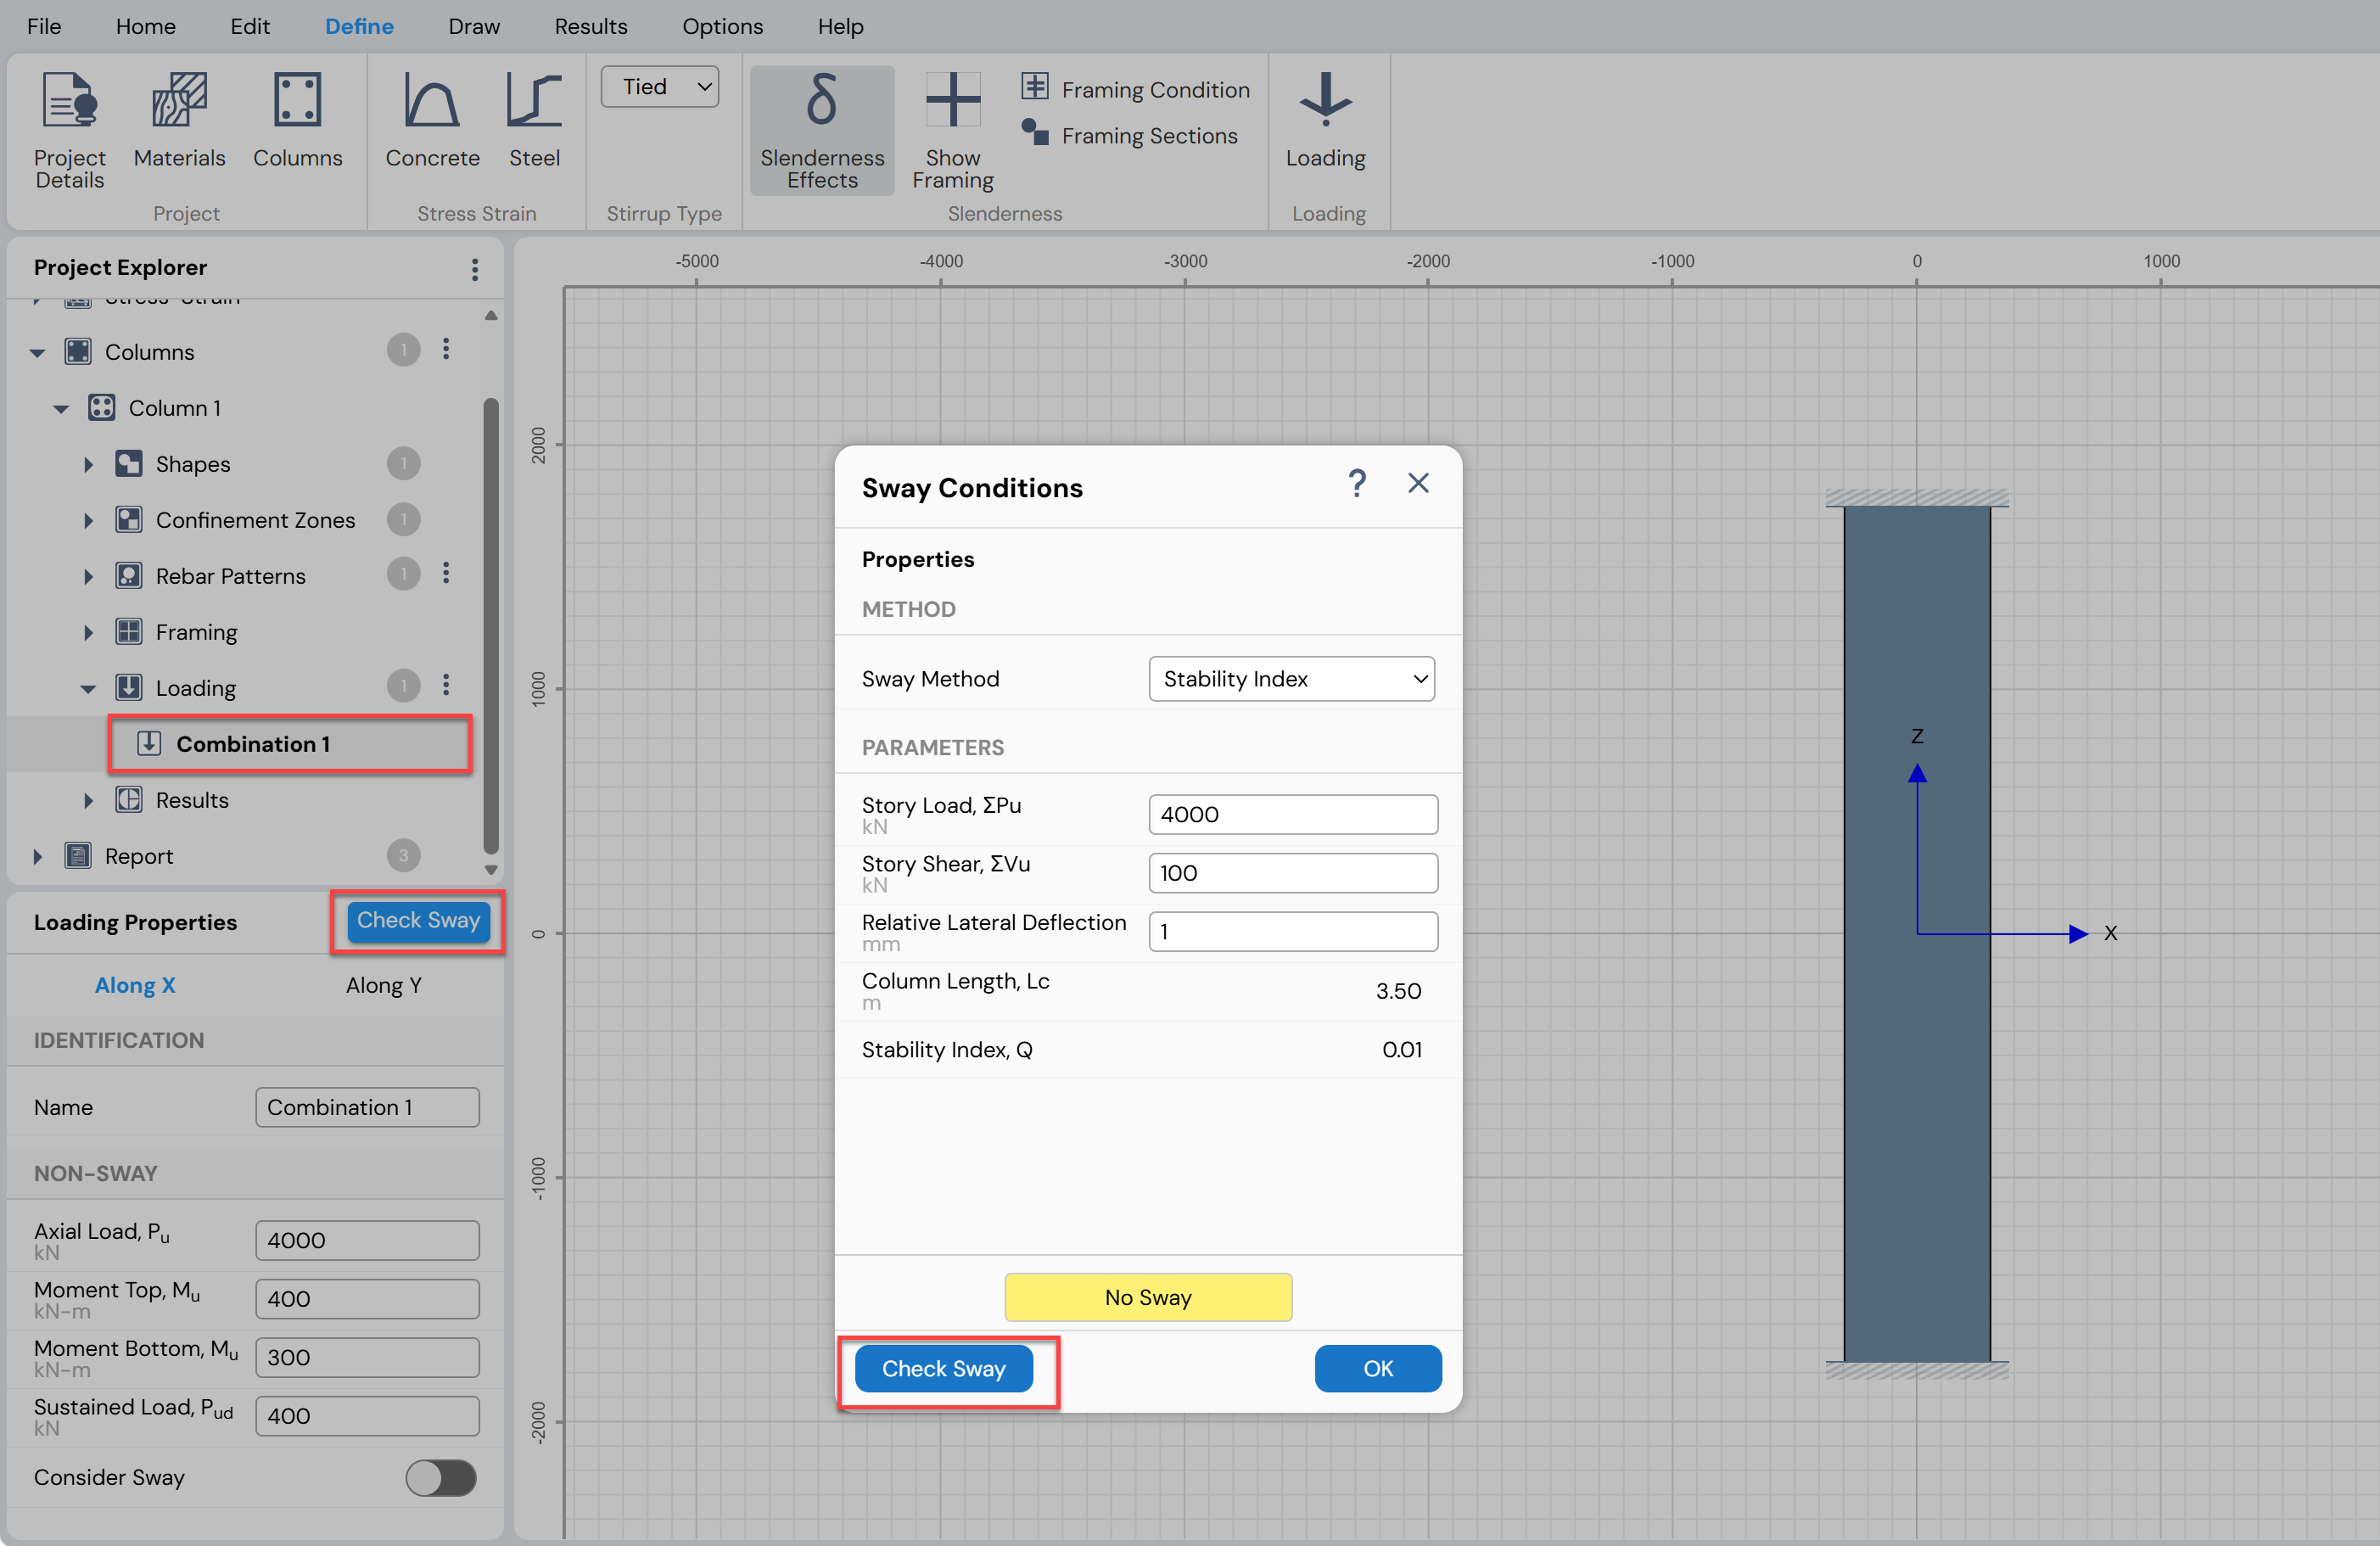
Figure: Sway Conditions Form
Available Sway Check Methods
Stability Index
Evaluated at the story level
If Q ≤ 0.05, the story is classified as non-sway
Requires:
Story load
Story shear
Relative lateral deflection
Column center-to-center length
Second-Order Analysis
Column is considered non-sway if second-order moments do not exceed first-order moments by more than 5%
Requires first- and second-order end moments
Relative Stiffness of Bracing to Columns
Column is non-sway if:
- Stiffness ratio ≥ 12
Requires:
Sum of stiffness of bracing elements
Lateral stiffness of the column
When a column is classified as sway:
Parameters are transferred automatically to the sway part of the Loading form
Values may be edited if required
Column Auto Design
The Column Auto Design feature, available under Home Menu → Auto Design, is a powerful and efficient tool for designing column reinforcement with or without considering slenderness effects.
This feature automatically designs the column reinforcement in accordance with the design parameters specified by the user and the selected design code.
The Auto Design tool uses an iterative optimization process to identify the minimum reinforcement and reinforcement layout that satisfies the user-defined maximum capacity (D/C) ratio for the governing load combination (i.e., the load combination producing the highest D/C ratio).
Applicability and Limitations
Column Auto Design is available only for:
Rectangular reinforced concrete columns
Circular reinforced concrete columns
Columns with only one rectangular or circular rebar pattern
Additional notes:
Auto Design is supported for columns imported from ETABS only if they contain a single rectangular or circular rebar pattern.
Columns imported from CDB files are imported as polygonal sections; therefore, Auto Design is not available for such columns.
Procedure for Column Auto Design
Step 1: Select Column
Select the desired column from the Project Explorer.
Step 2: Open Auto Design
Click the Auto Design button to access the Design Form.
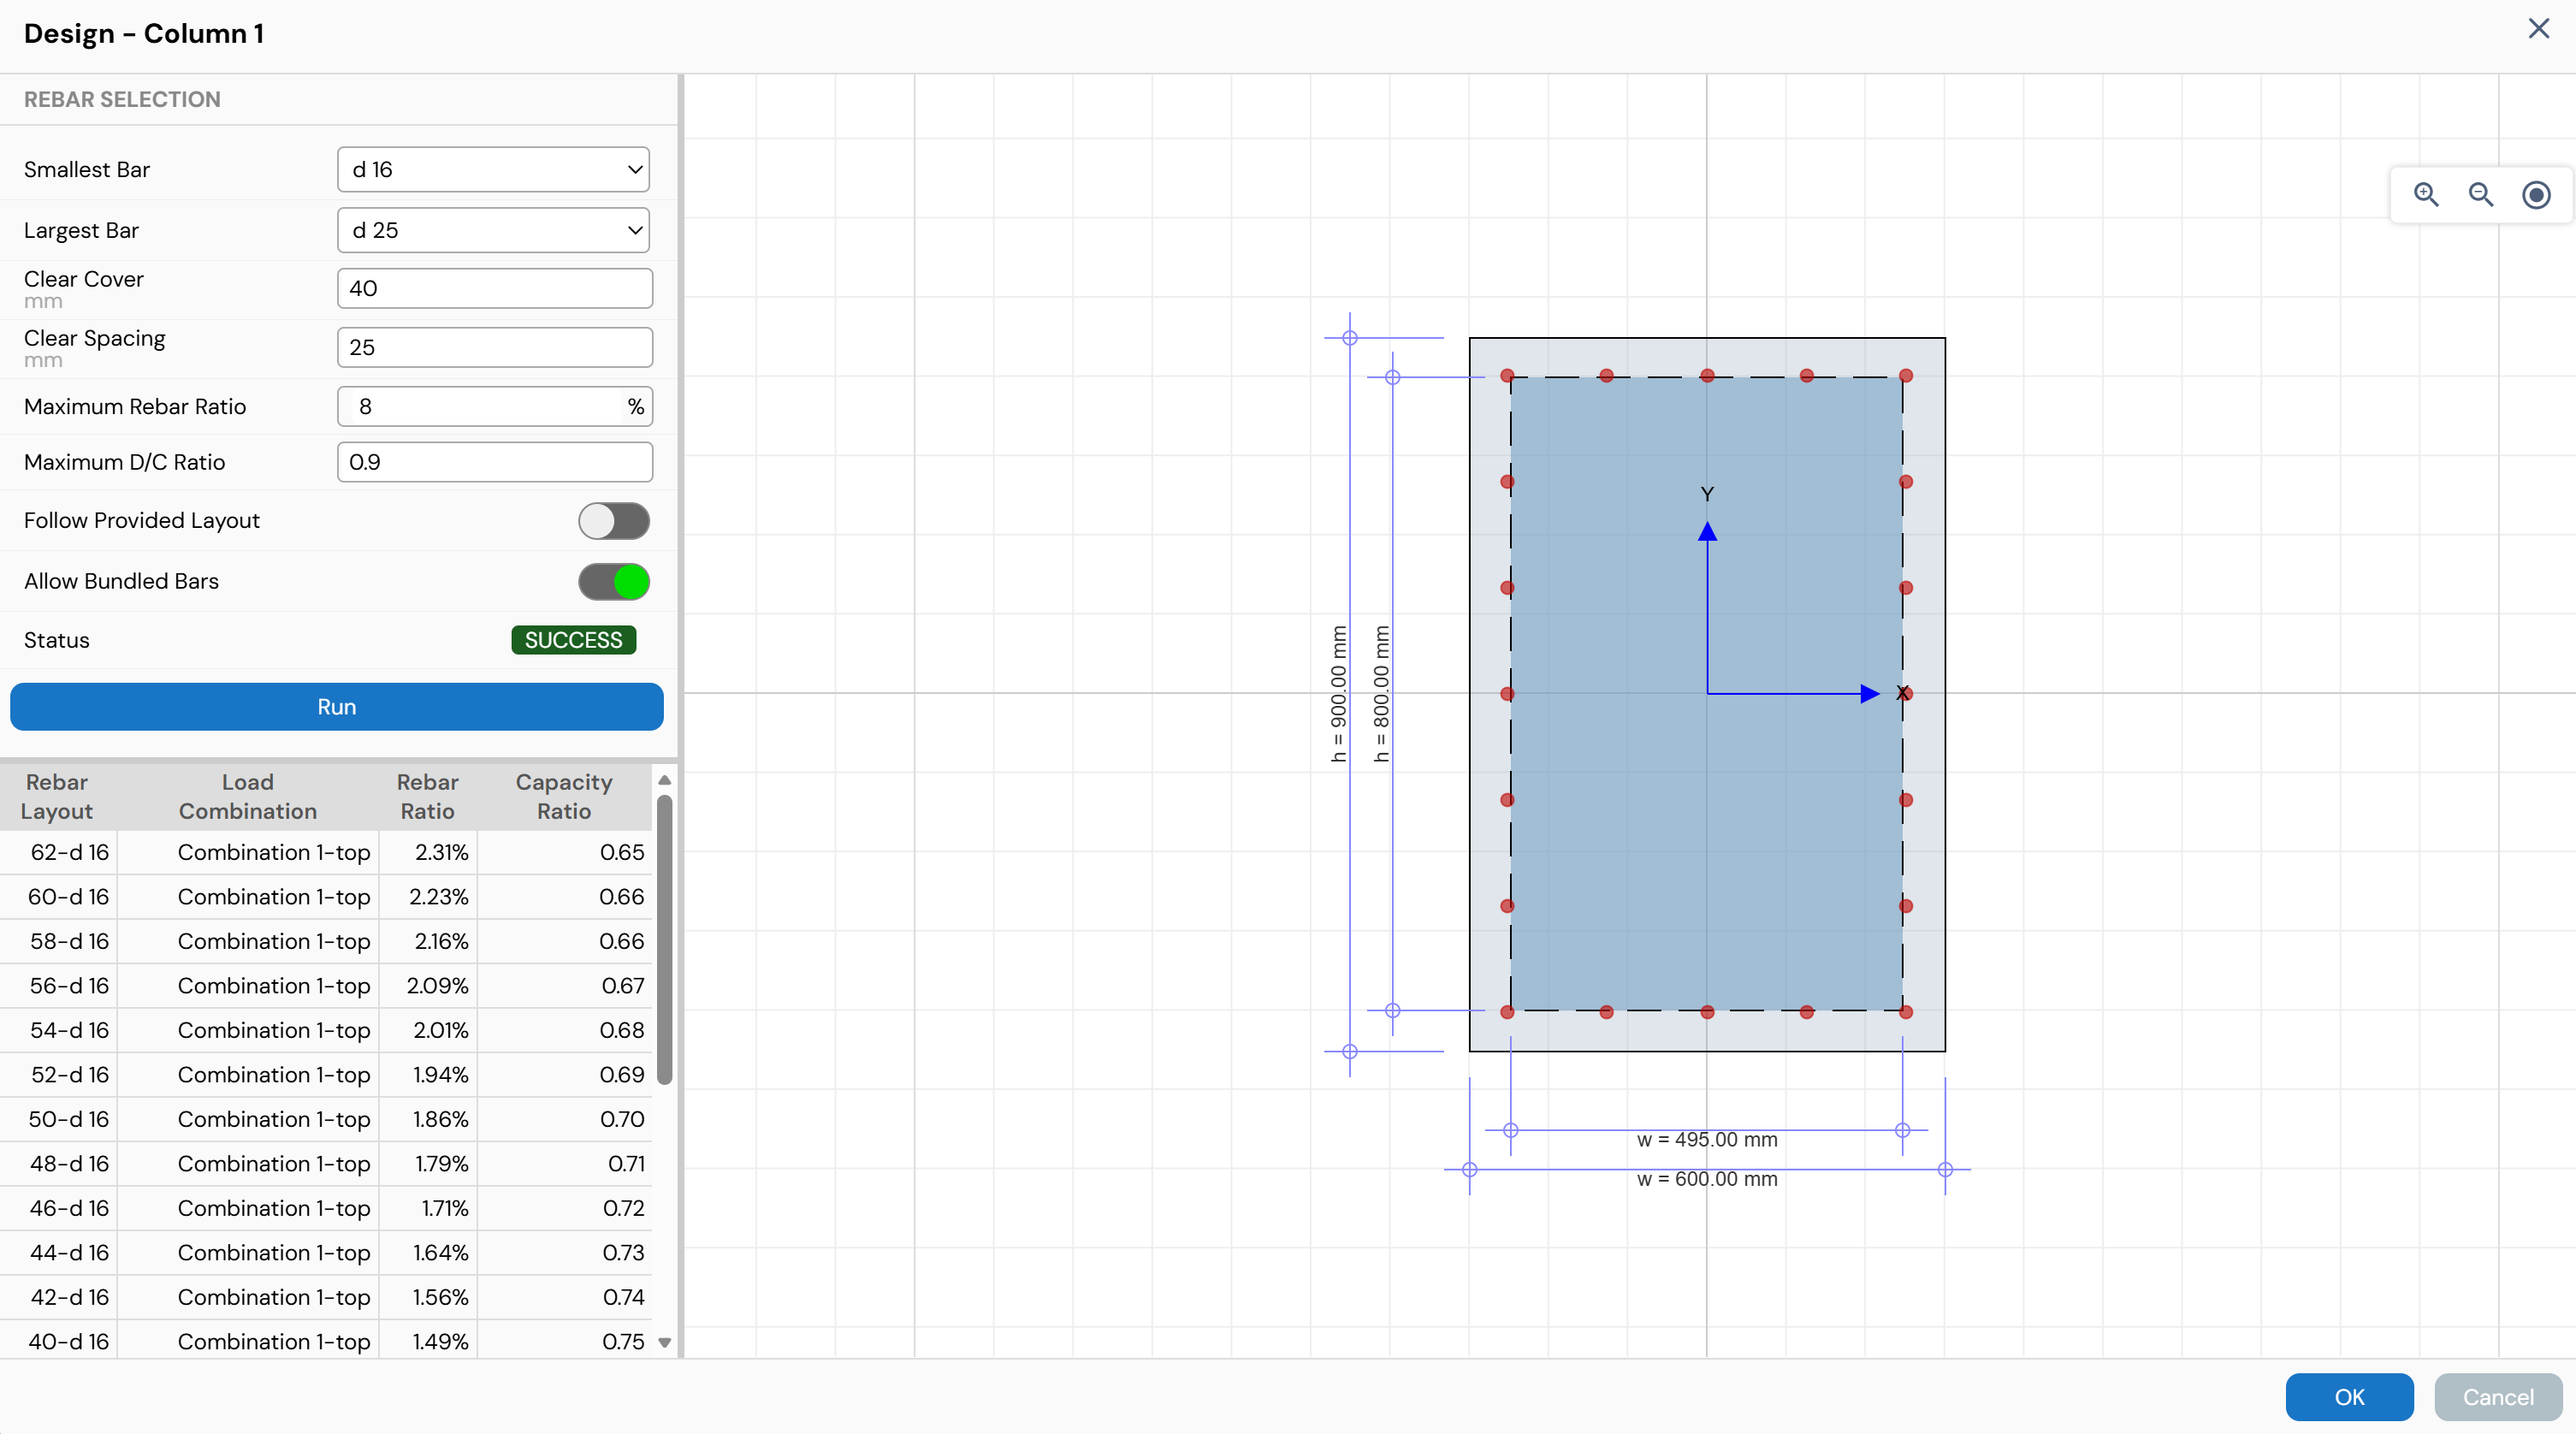
Figure: Column Designer Auto Design Feature
Step 3: Define Rebar Selection Parameters
Accept the default values or modify them as required using the available input fields and toggles:
Smallest Bar
Specifies the minimum rebar size allowed in the design.Largest Bar
Specifies the maximum rebar size allowed in the design.Clear Cover
Specifies the minimum clear cover to be provided in the section.Clear Spacing
Specifies the minimum clear spacing required between rebars.Maximum Rebar Ratio
Specifies the upper limit for the reinforcement ratio.Maximum D/C Ratio
Specifies the maximum allowable capacity ratio that must be satisfied by the design.Follow Provided Layout
When ON, the rebar layout remains fixed and only the bar size is increased.
When OFF, the number of bars may be increased while satisfying spacing requirements.
Allow Bundled Bars
When ON, bundled bars are permitted if single bars cannot satisfy the D/C limit.
When OFF, bundled bars are not allowed.
Status
Displays the current design status:Run Design – Design has not yet been executed
Success – Design completed successfully
Failed – D/C ratio limit cannot be satisfied with current settings
Step 4: Run Auto Design
Click the Run button to start the auto design process.
Step 5: Review Design Iterations
During the iterative process, Column Designer displays:
Current rebar layout
Governing load combination
Rebar ratio
Current capacity (D/C) ratio
The displayed information updates automatically for each iteration based on the rebar selection settings.
A “Success” status indicates that the design requirements have been satisfied.
A “Failed” status indicates that the specified D/C ratio limit cannot be achieved using the current rebar selection settings.
If the design fails:
Adjust the rebar selection parameters
Re-run the Auto Design process until a Success status is achieved
Editing Column Cross-Sections
This section describes how to use the various tools available in Column Designer to edit shapes and to add, edit, and distribute reinforcement within a column section.
Types of Shapes
After a shape has been added to a column section, its dimensions and properties can be modified. The editing procedure depends on the type of shape used. In Column Designer, shapes are broadly classified into the following two categories based on how they are created.
Parametric Shapes
Parametric shapes are shapes whose geometry is defined using a set of parameters (such as width, depth, radius, or flange thickness). These shapes include:
Rebar pattern shapes
Basic steel shapes defined parametrically
Basic concrete shapes defined parametrically
Standard steel shapes obtained from the built-in shape databases
Parametric shapes are typically created using one of the following methods:
Quick Design Wizard
File Menu → Rectangular Model
File Menu → Circular Model
Selecting shapes from one of the available Shape Libraries and adding them to the current section
Note: The Polygon shape is not considered a parametric shape.
Converting Parametric Shapes to Polygon Shapes
Parametric shapes can be converted into non-parametric (polygon) shapes using the following command:
- Edit Menu → Edit → Edit Points
Once converted, the user can:
Add nodal points
Remove nodal points
Modify nodal point coordinates directly
This conversion provides full geometric flexibility when parametric editing is no longer sufficient.
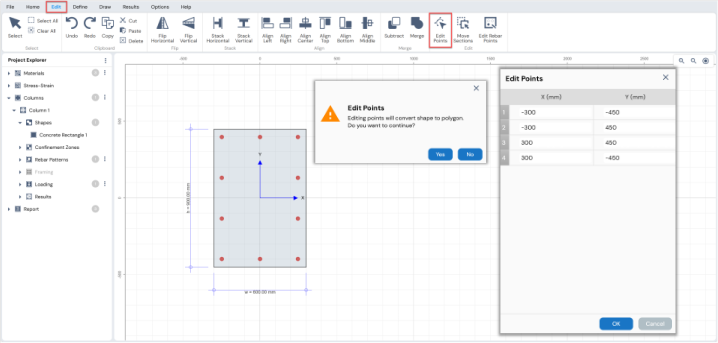
Figure: Converting Parametric Shapes to Polygon Shapes
Non-Parametric Shapes
Non-parametric shapes are shapes whose geometry is defined explicitly by their nodal coordinates rather than by parameters. These shapes are created in the following ways:
Drawing directly in the working area using
Draw Menu → Concrete Shapes → PolygonModifying library-based or parametric shapes by:
Flipping shapes
Merging multiple shapes
Creating holes
Performing other geometric operations to achieve the desired shape
Defining shapes by manually inputting or importing coordinate data
Non-parametric shapes offer complete geometric freedom but do not retain the parametric controls available for standard shapes.
Editing Parametric Shapes
The dimensions and position of parametric shapes can be modified using the Property Grid. The Property Grid is activated in the context-sensitive area when a shape is selected, either by:
Clicking directly on the shape in the working area, or
Selecting the shape from Project Explorer → Columns
Once activated, the Property Grid allows the user to edit geometric parameters such as dimensions, location, and other shape-specific properties.
Figure illustrates the Property Grid associated with parametric shapes.
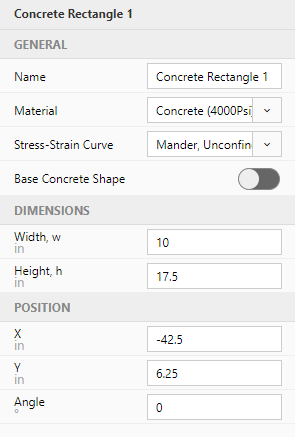
Figure: Property Grid for Parametric Shapes
Editing Parametric Shapes Using Edit Points
Parametric shapes can also be edited using the following command:
Edit Menu → Edit → Edit Points
This option allows the user to:
Add nodal points
Remove nodal points
Modify existing nodal point coordinates
However, editing a parametric shape using Edit Points requires the shape to be converted into a polygon (non-parametric shape). Once converted, the shape will no longer retain its parametric behavior, and further modifications must be performed by directly editing nodal coordinates rather than by adjusting parameters.
Editing Non-Parametric Shapes
The dimensions of non-parametric shapes can be edited by modifying their nodal point coordinates. This is done using the following command:
Edit Menu → Edit → Edit Points
This option allows the user to:
Add nodal points
Remove nodal points
Modify existing nodal point coordinates
In addition, the dimensions of the shape and any internal holes can be edited directly from the Property Grid:
Points tab: Used to edit the coordinates of the shape boundary
Holes tab: Used to edit the coordinates and properties of holes within the shape
The Property Grid is activated in the context-sensitive area when a shape is selected, either by:
Clicking on the shape in the working area, or
Selecting the shape from Project Explorer → Columns
Figure shows the Property Grid for non-parametric shapes.
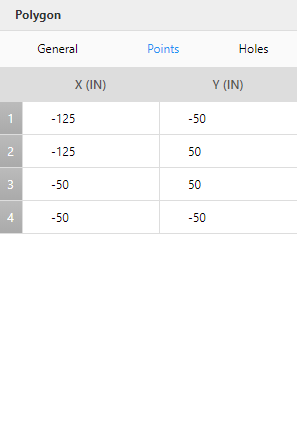
Figure: Property Grid for Non-Parametric Shapes
Align Shapes Graphically
Graphical alignment allows shapes to be aligned without requiring any text or numeric input from the user. Shapes can be aligned graphically using the alignment tools available in the Edit Menu.
To align shapes graphically, follow the steps below:
Select the shapes to be aligned in the working area or from the Project Explorer.
Choose the appropriate alignment button from the available options.
Alignment Options
Align Left
Aligns the selected shapes along their left edge.
Alignment is performed with respect to the lowest x-coordinate among the selected shapes.Align Right
Aligns the selected shapes along their right edge.
Alignment is performed with respect to the highest x-coordinate among the selected shapes.Align Center
Aligns the selected shapes along the vertical centerline.
Alignment is performed with respect to the x-centroid of the selected shapes.Align Top
Aligns the selected shapes along their top edge.
Alignment is performed with respect to the highest y-coordinate among the selected shapes.Align Bottom
Aligns the selected shapes along their bottom edge.
Alignment is performed with respect to the lowest y-coordinate among the selected shapes.Align Middle
Aligns the selected shapes along the horizontal centerline.
Alignment is performed with respect to the y-centroid of the selected shapes.
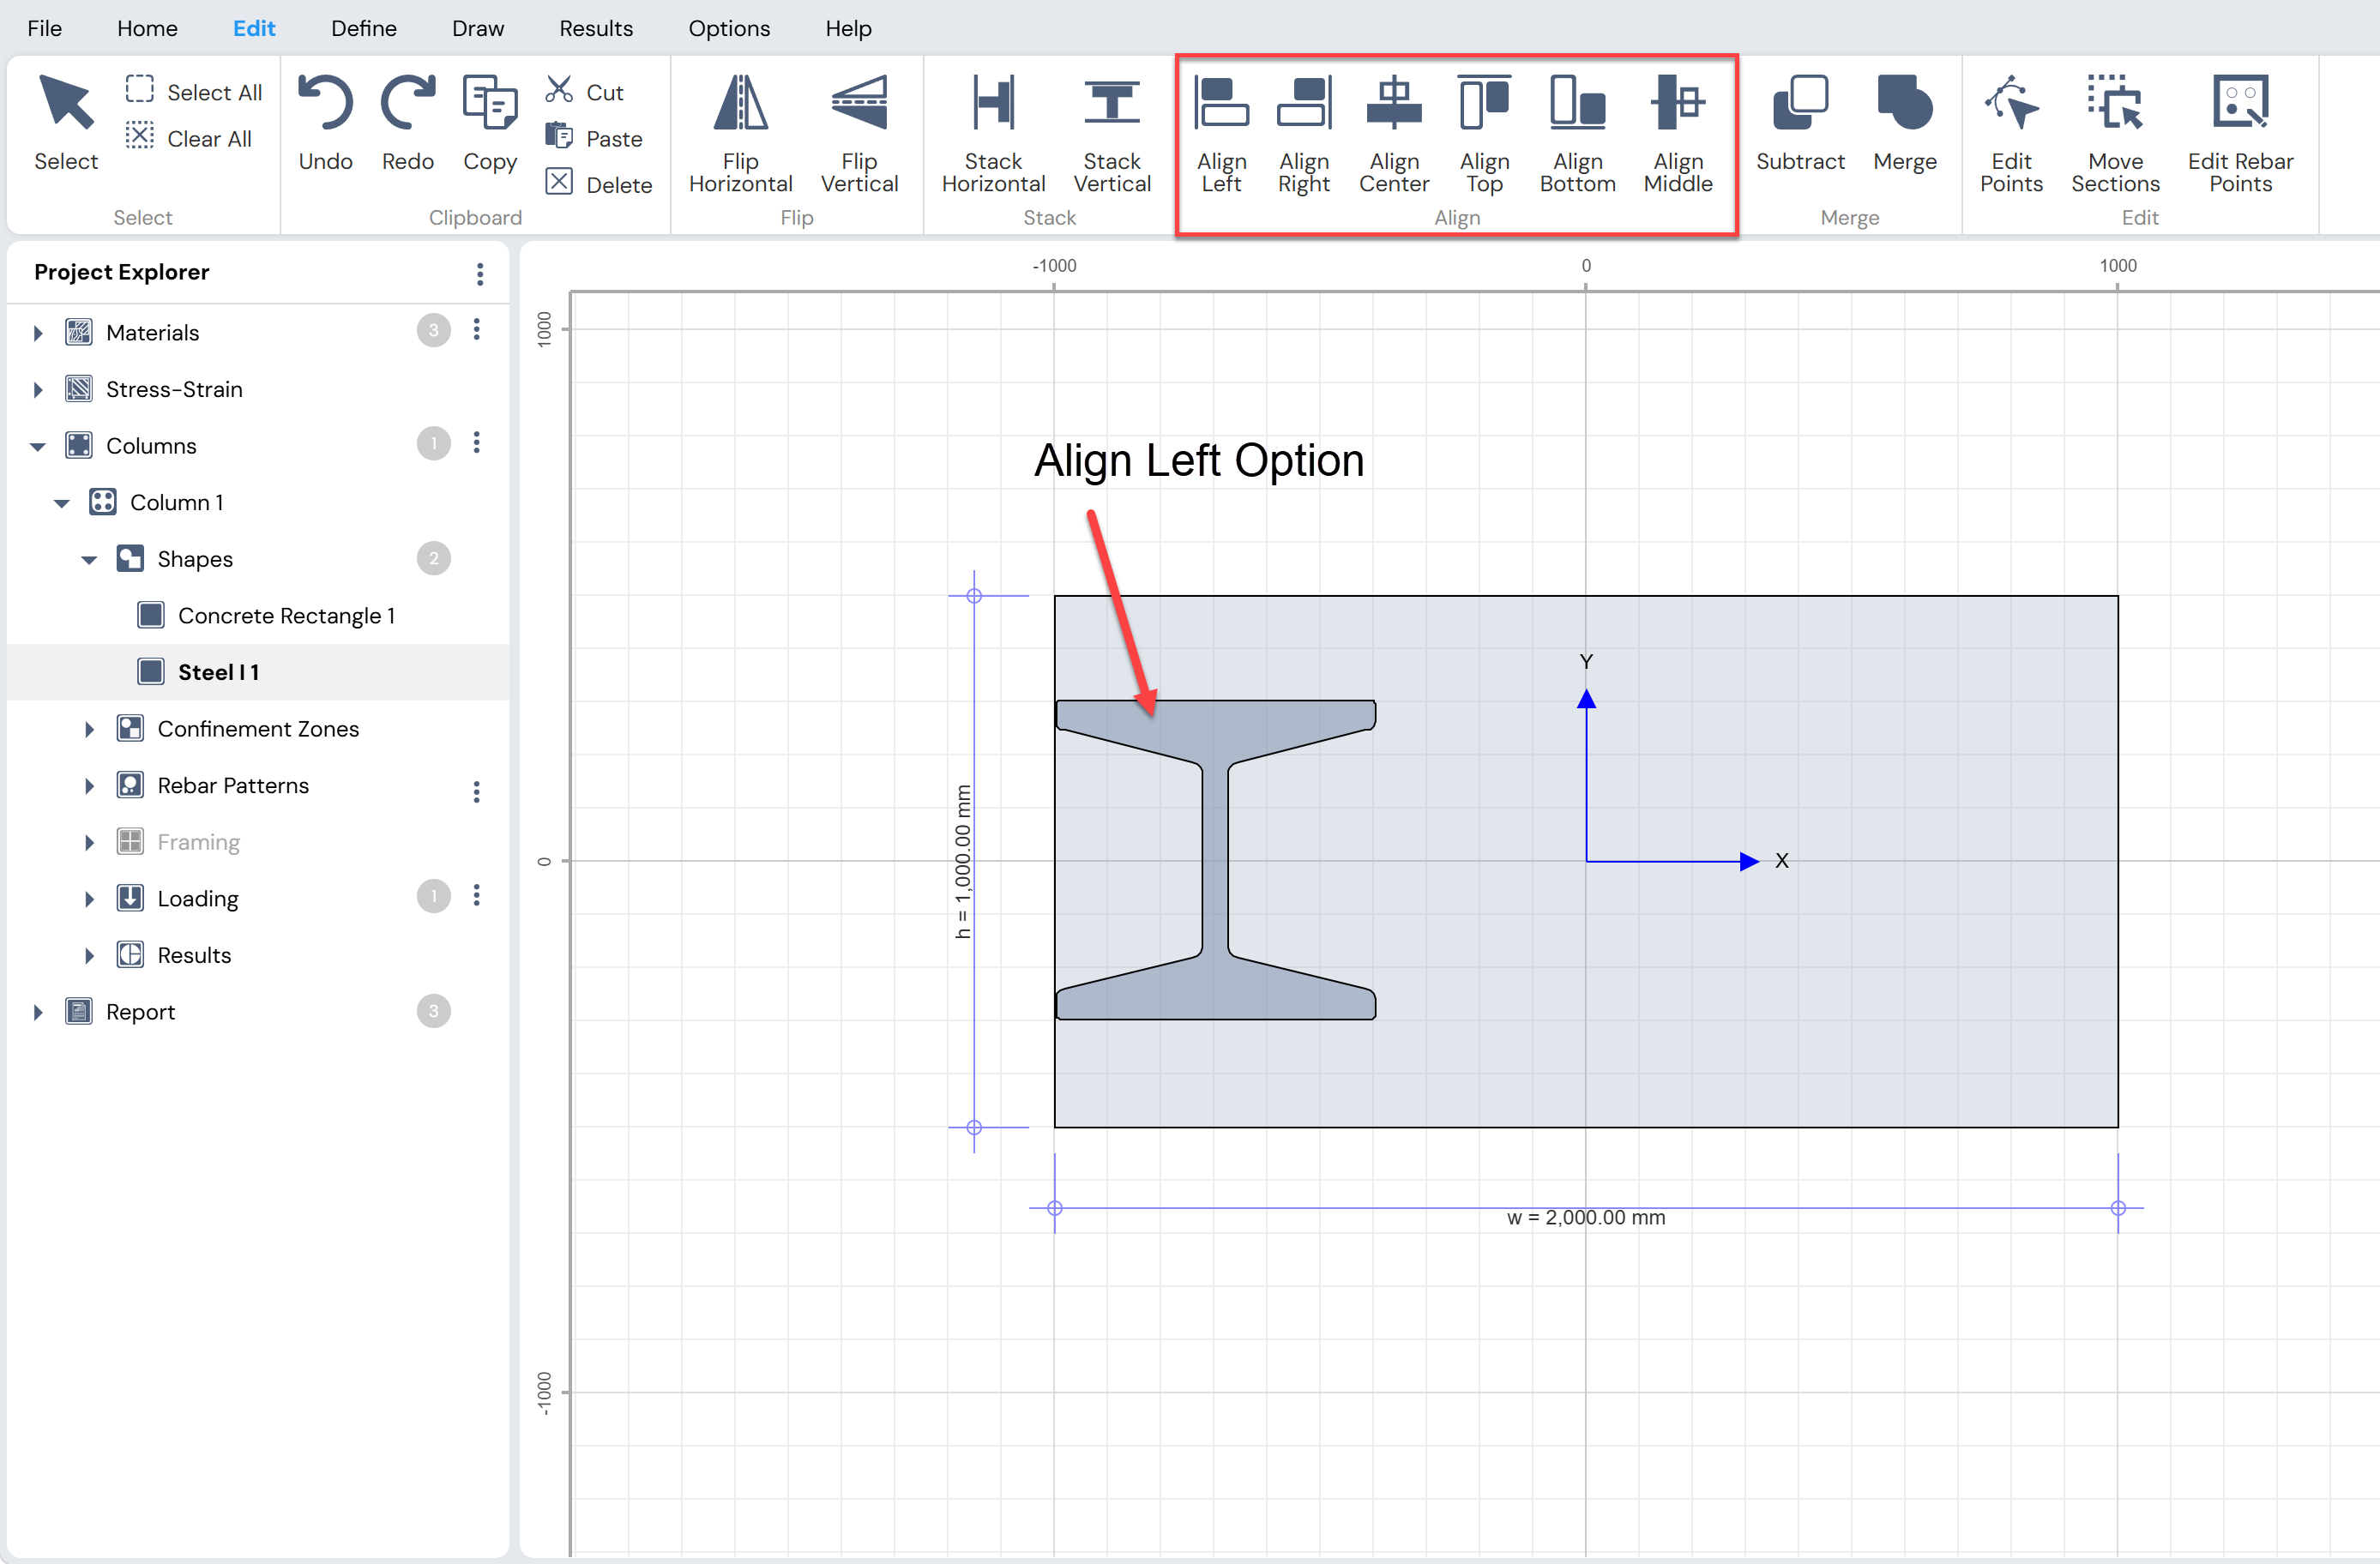
Figure: Alignment Options for Shapes
Flip Shapes
Column Designer provides options to flip shapes about horizontal or vertical axes using the tools available under the Edit Menu → Flip.
To flip a shape:
Select the shape to be flipped in the working area or from the Project Explorer.
Click the appropriate flip button from the Edit Menu.
Flip Options
Flip Horizontal
Flips the selected shape about the vertical axis, creating a mirror image left-to-right.Flip Vertical
Flips the selected shape about the horizontal axis, creating a mirror image top-to-bottom.
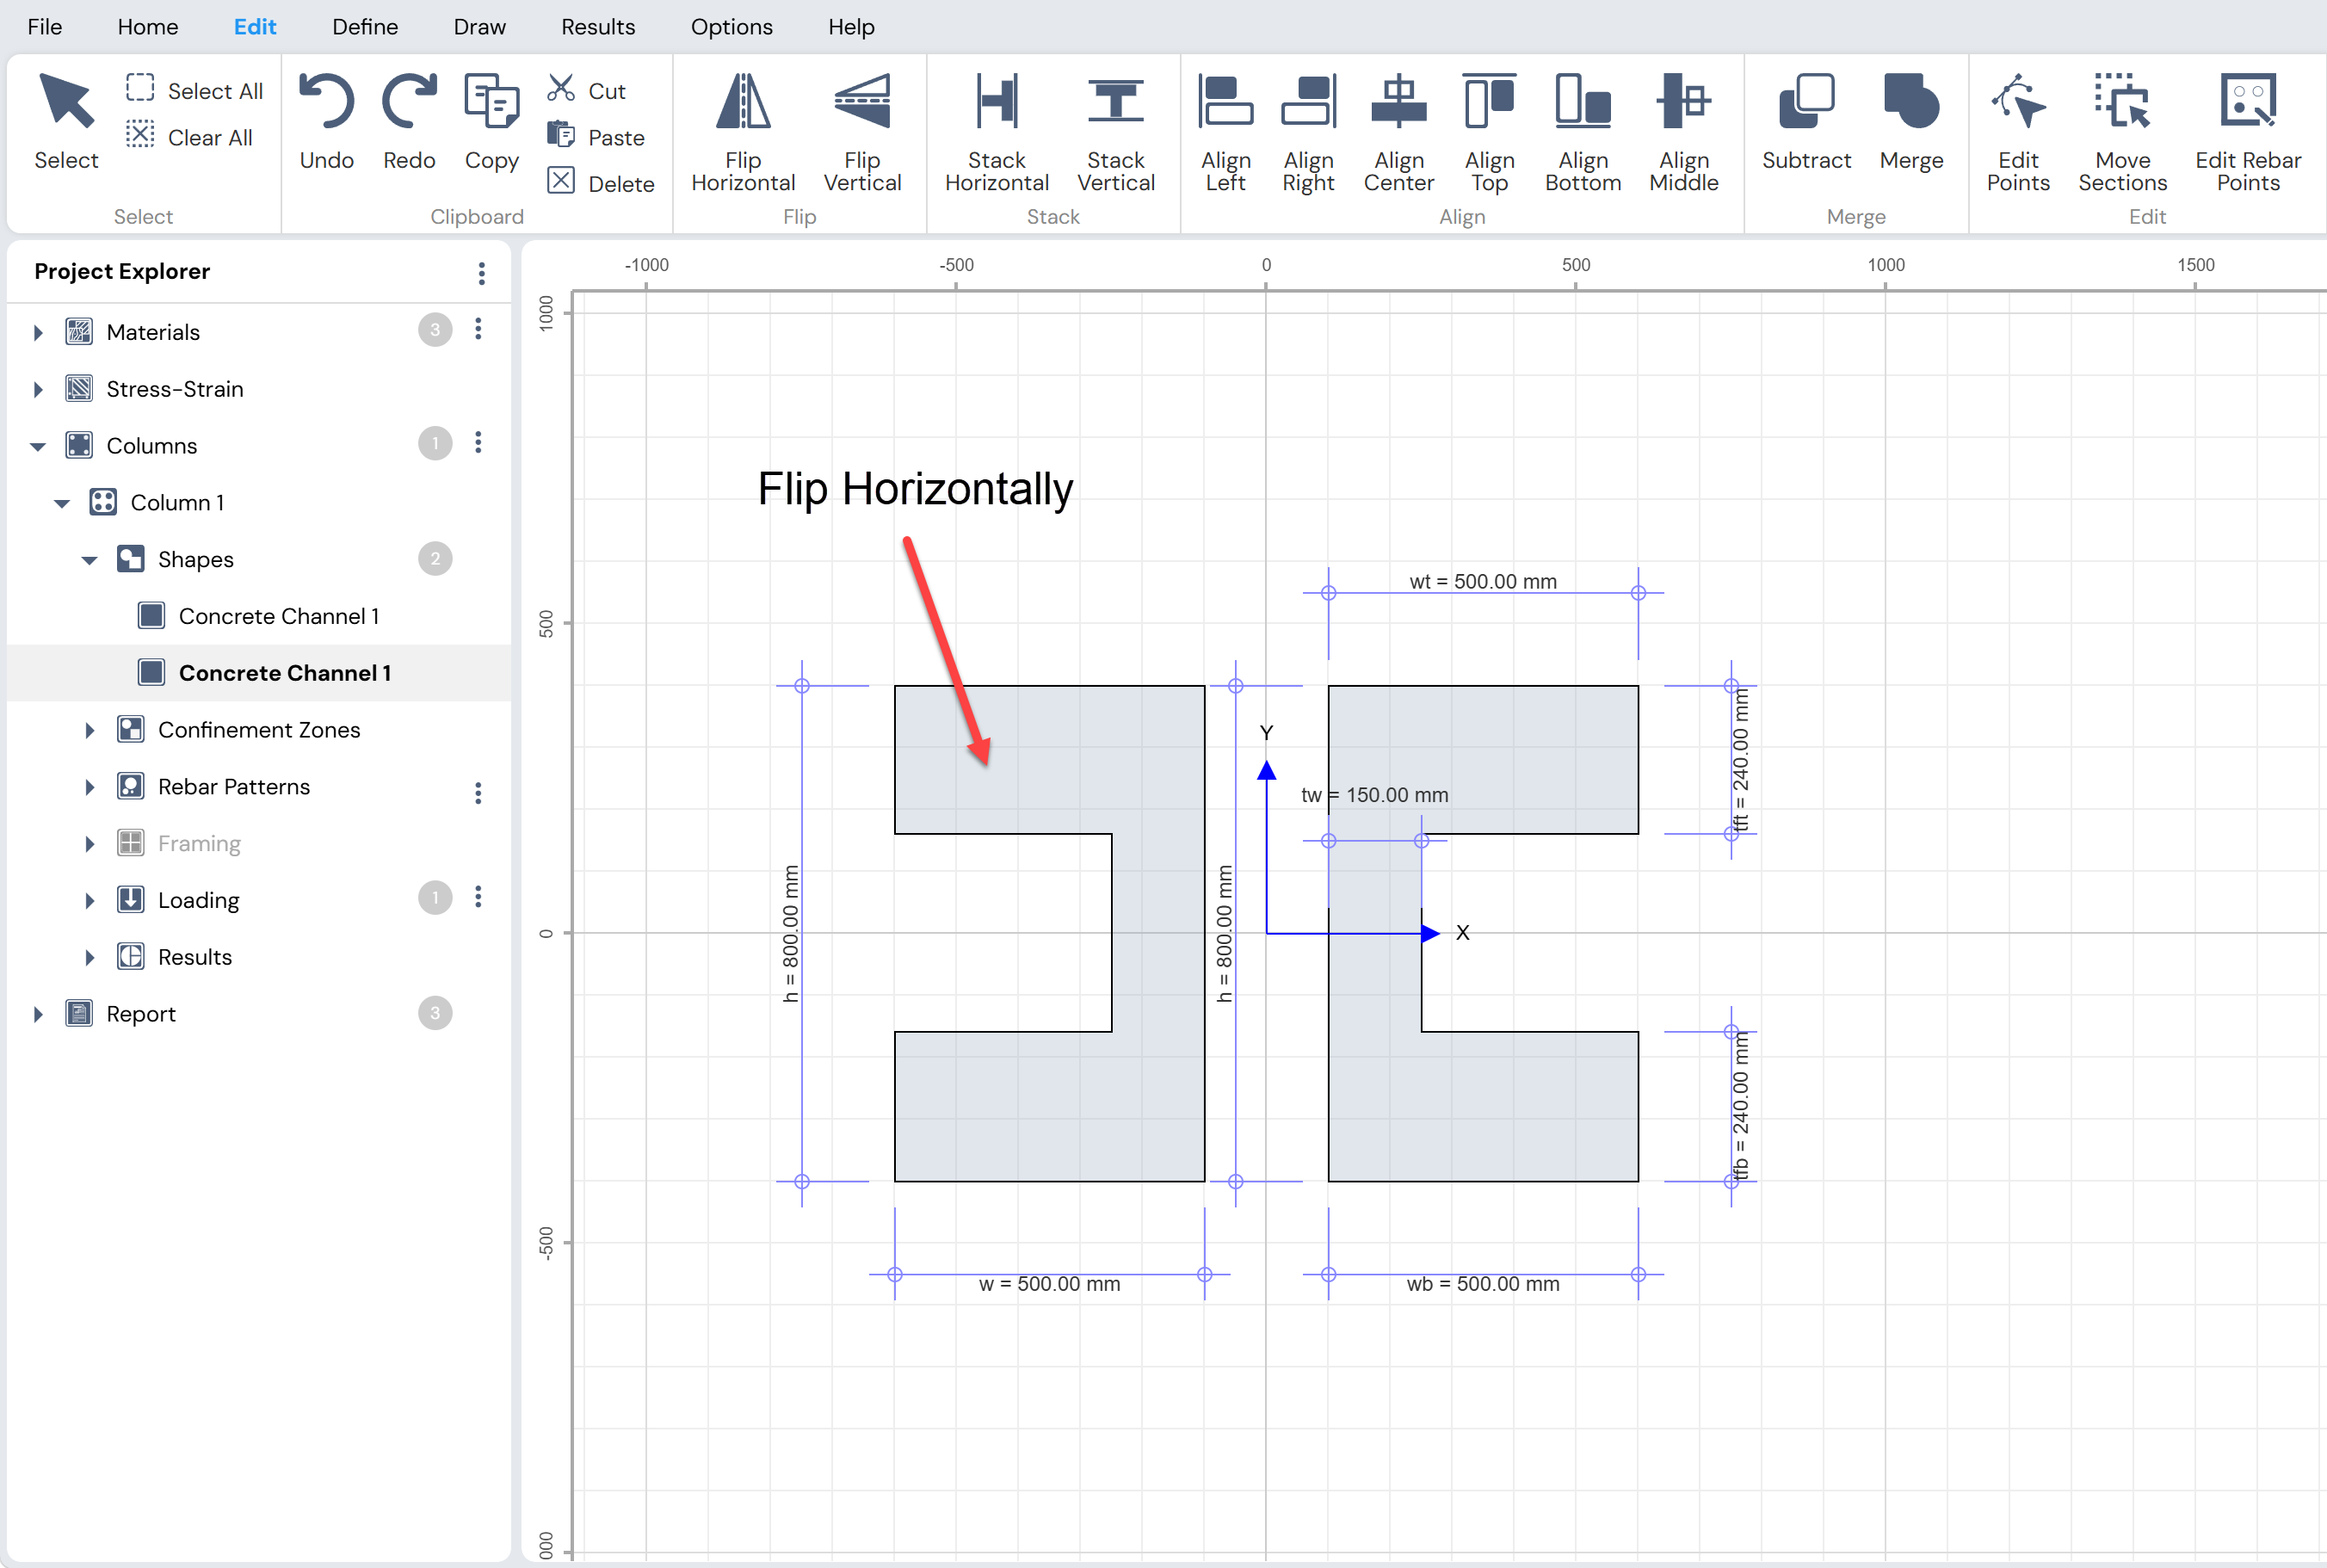
Figure: Flip Options for Shapes
Note
After a shape is flipped, it is converted into a polygon (non-parametric shape). Once converted, the shape can no longer be edited parametrically and must be modified by editing its nodal coordinates.
Stack Shapes
Stacking is performed based on the relative position of the selected shapes. To stack shapes, first select the desired shapes and then choose the appropriate stacking option from the Edit Menu.
Stacking Options
Stack Horizontal
Stacks the selected shapes side by side horizontally.
The y-coordinates remain unchanged, and the shapes are arranged along the x-direction.Stack Vertical
Stacks the selected shapes vertically, one on top of another.
The x-coordinates remain unchanged, and the shapes are arranged along the y-direction.
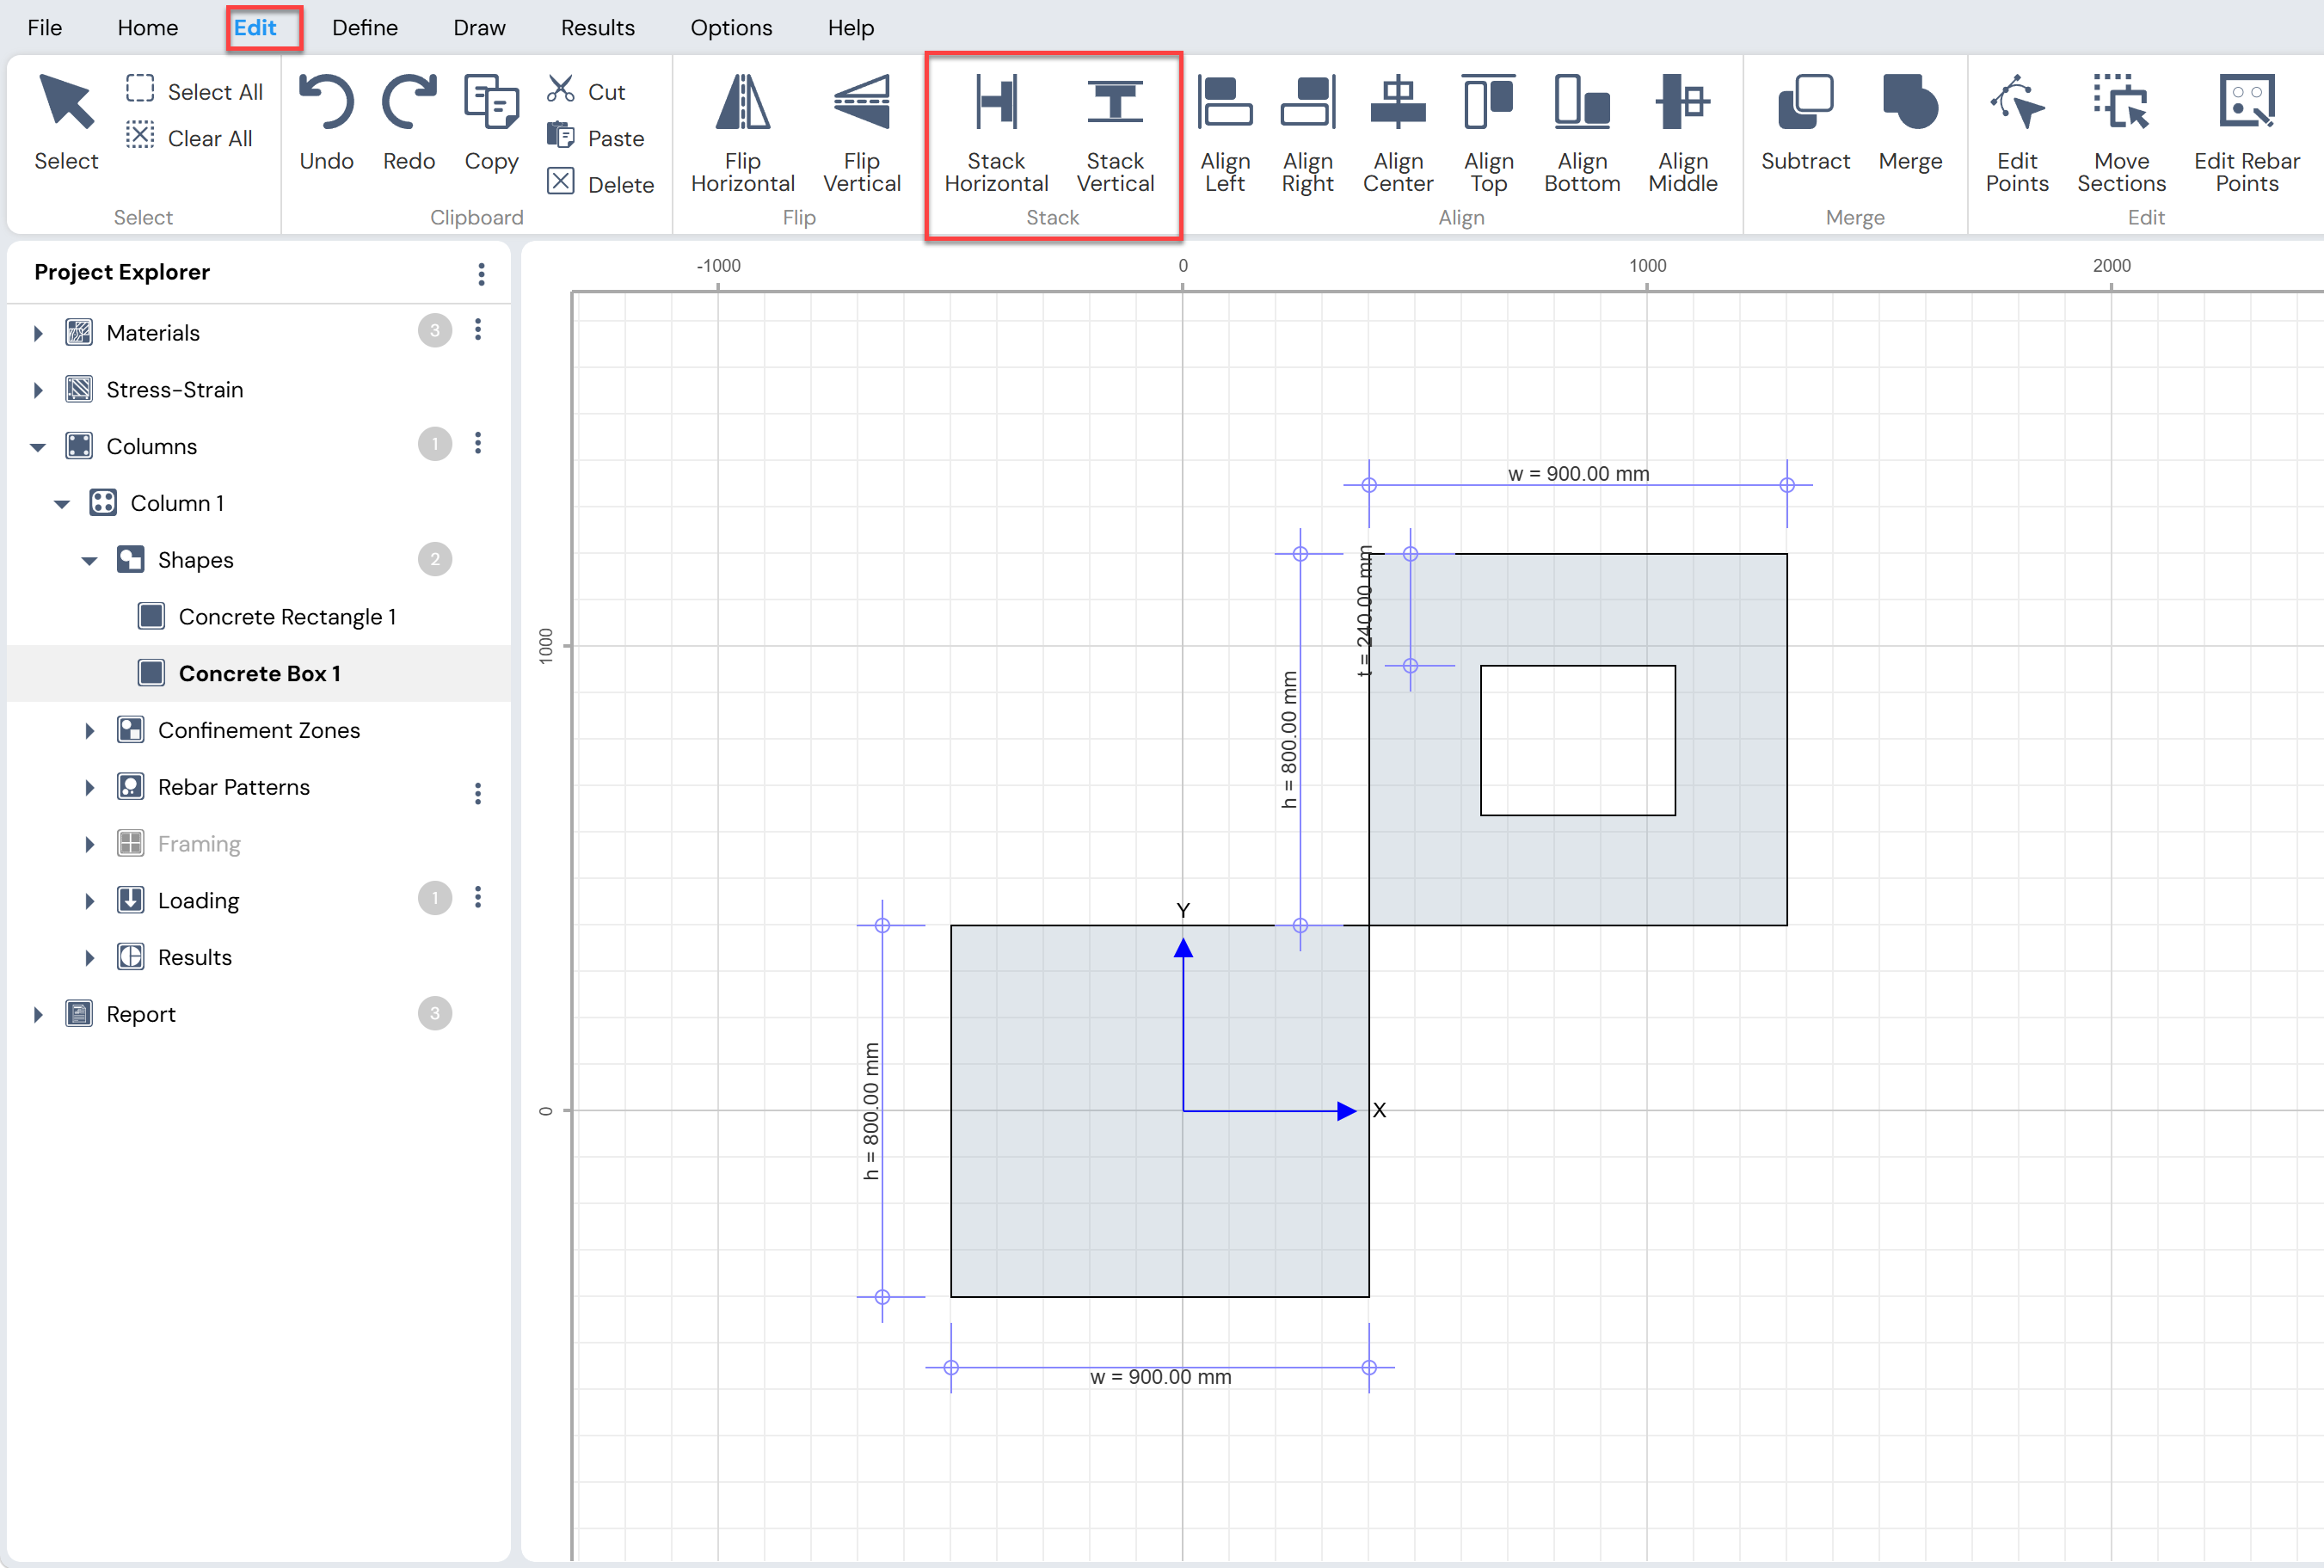
Figure: Stack Options for Shapes
Merge Shapes
Two shapes can be merged if they:
Have the same material properties, and
Share a common edge or overlap with each other.
To merge shapes:
Select the shapes to be merged.
Click Edit Menu → Merge.
Verify the geometry of the merged shape.
Note:
After merging, the shapes are converted into a single editable polygon (non-parametric shape).
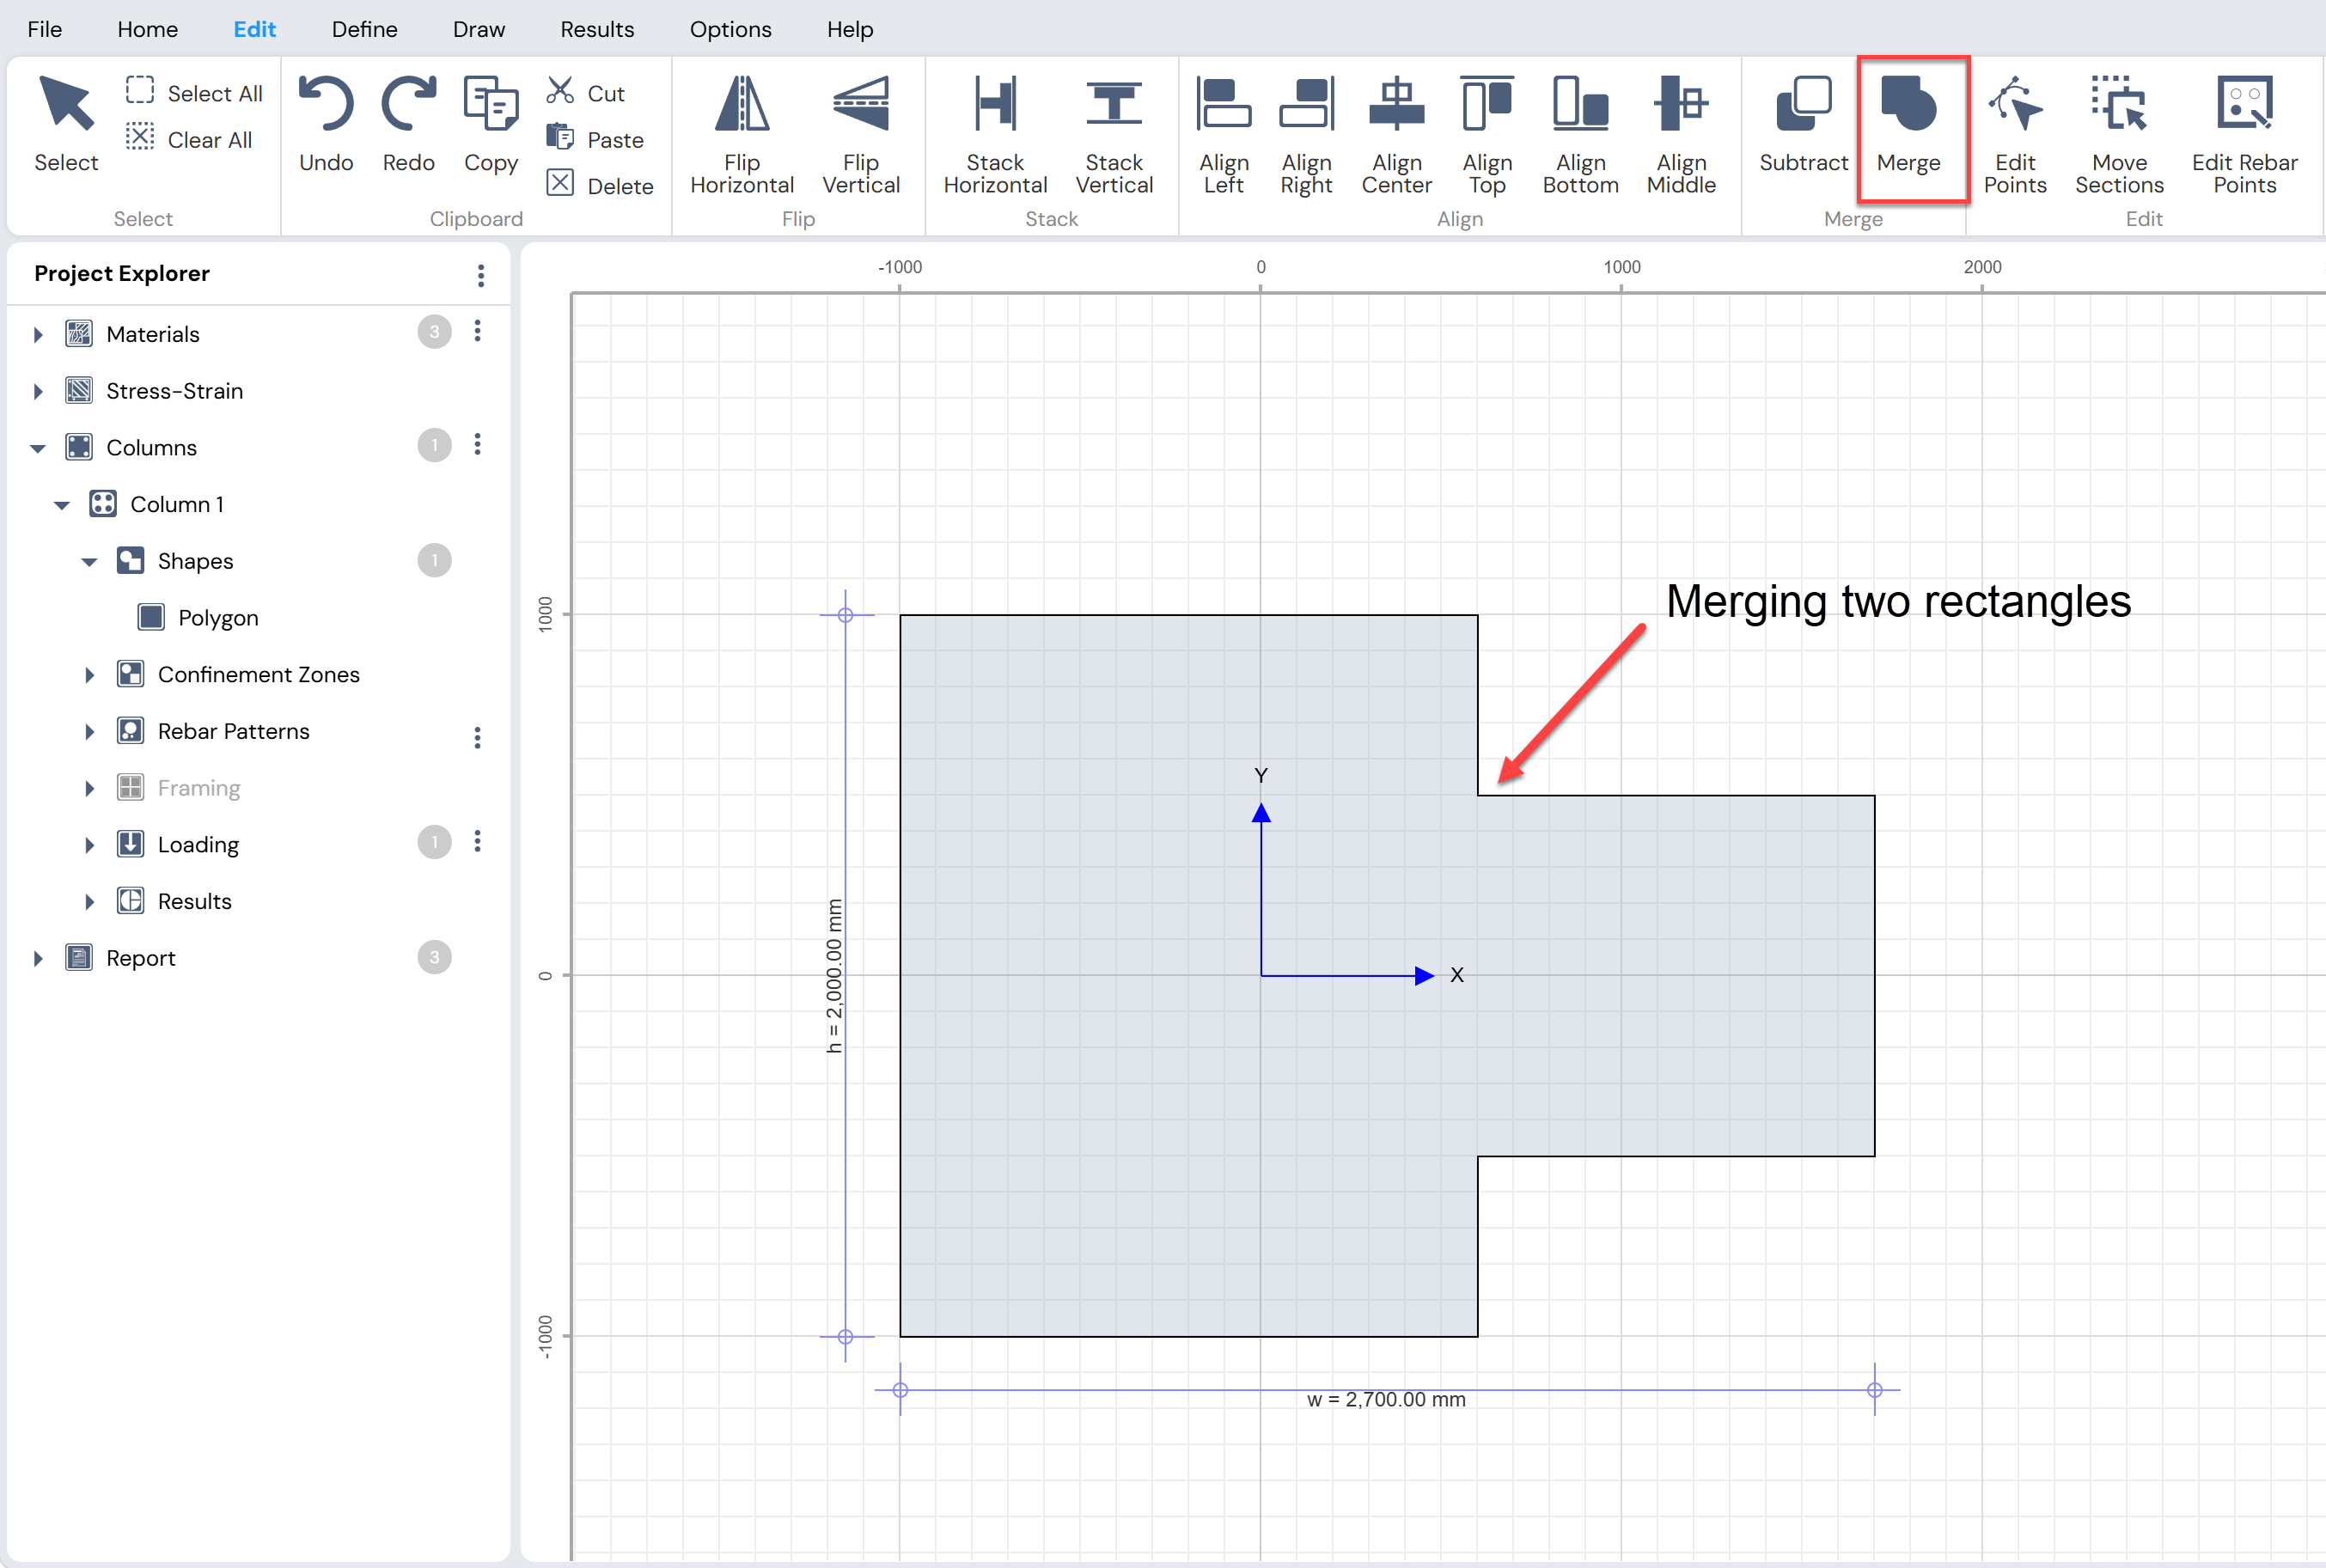
Figure: Merge Option for Shapes
Create Holes in Shapes
Holes can be created in a shape or section by subtracting one or more shapes from a main shape.
To create a hole:
Select the main shape to which the hole will be added.
While holding the Ctrl or Shift key, select the shape(s) to be subtracted.
Click Edit Menu → Merge → Subtract.
Note:
The subtract operation is selection-order dependent. The first selected shape is treated as the main shape, and all subsequently selected shapes are subtracted from it.
After subtraction, the resulting shape is converted into an editable polygon.
The dimensions and location of the hole can be modified from the Property Grid → Holes tab.
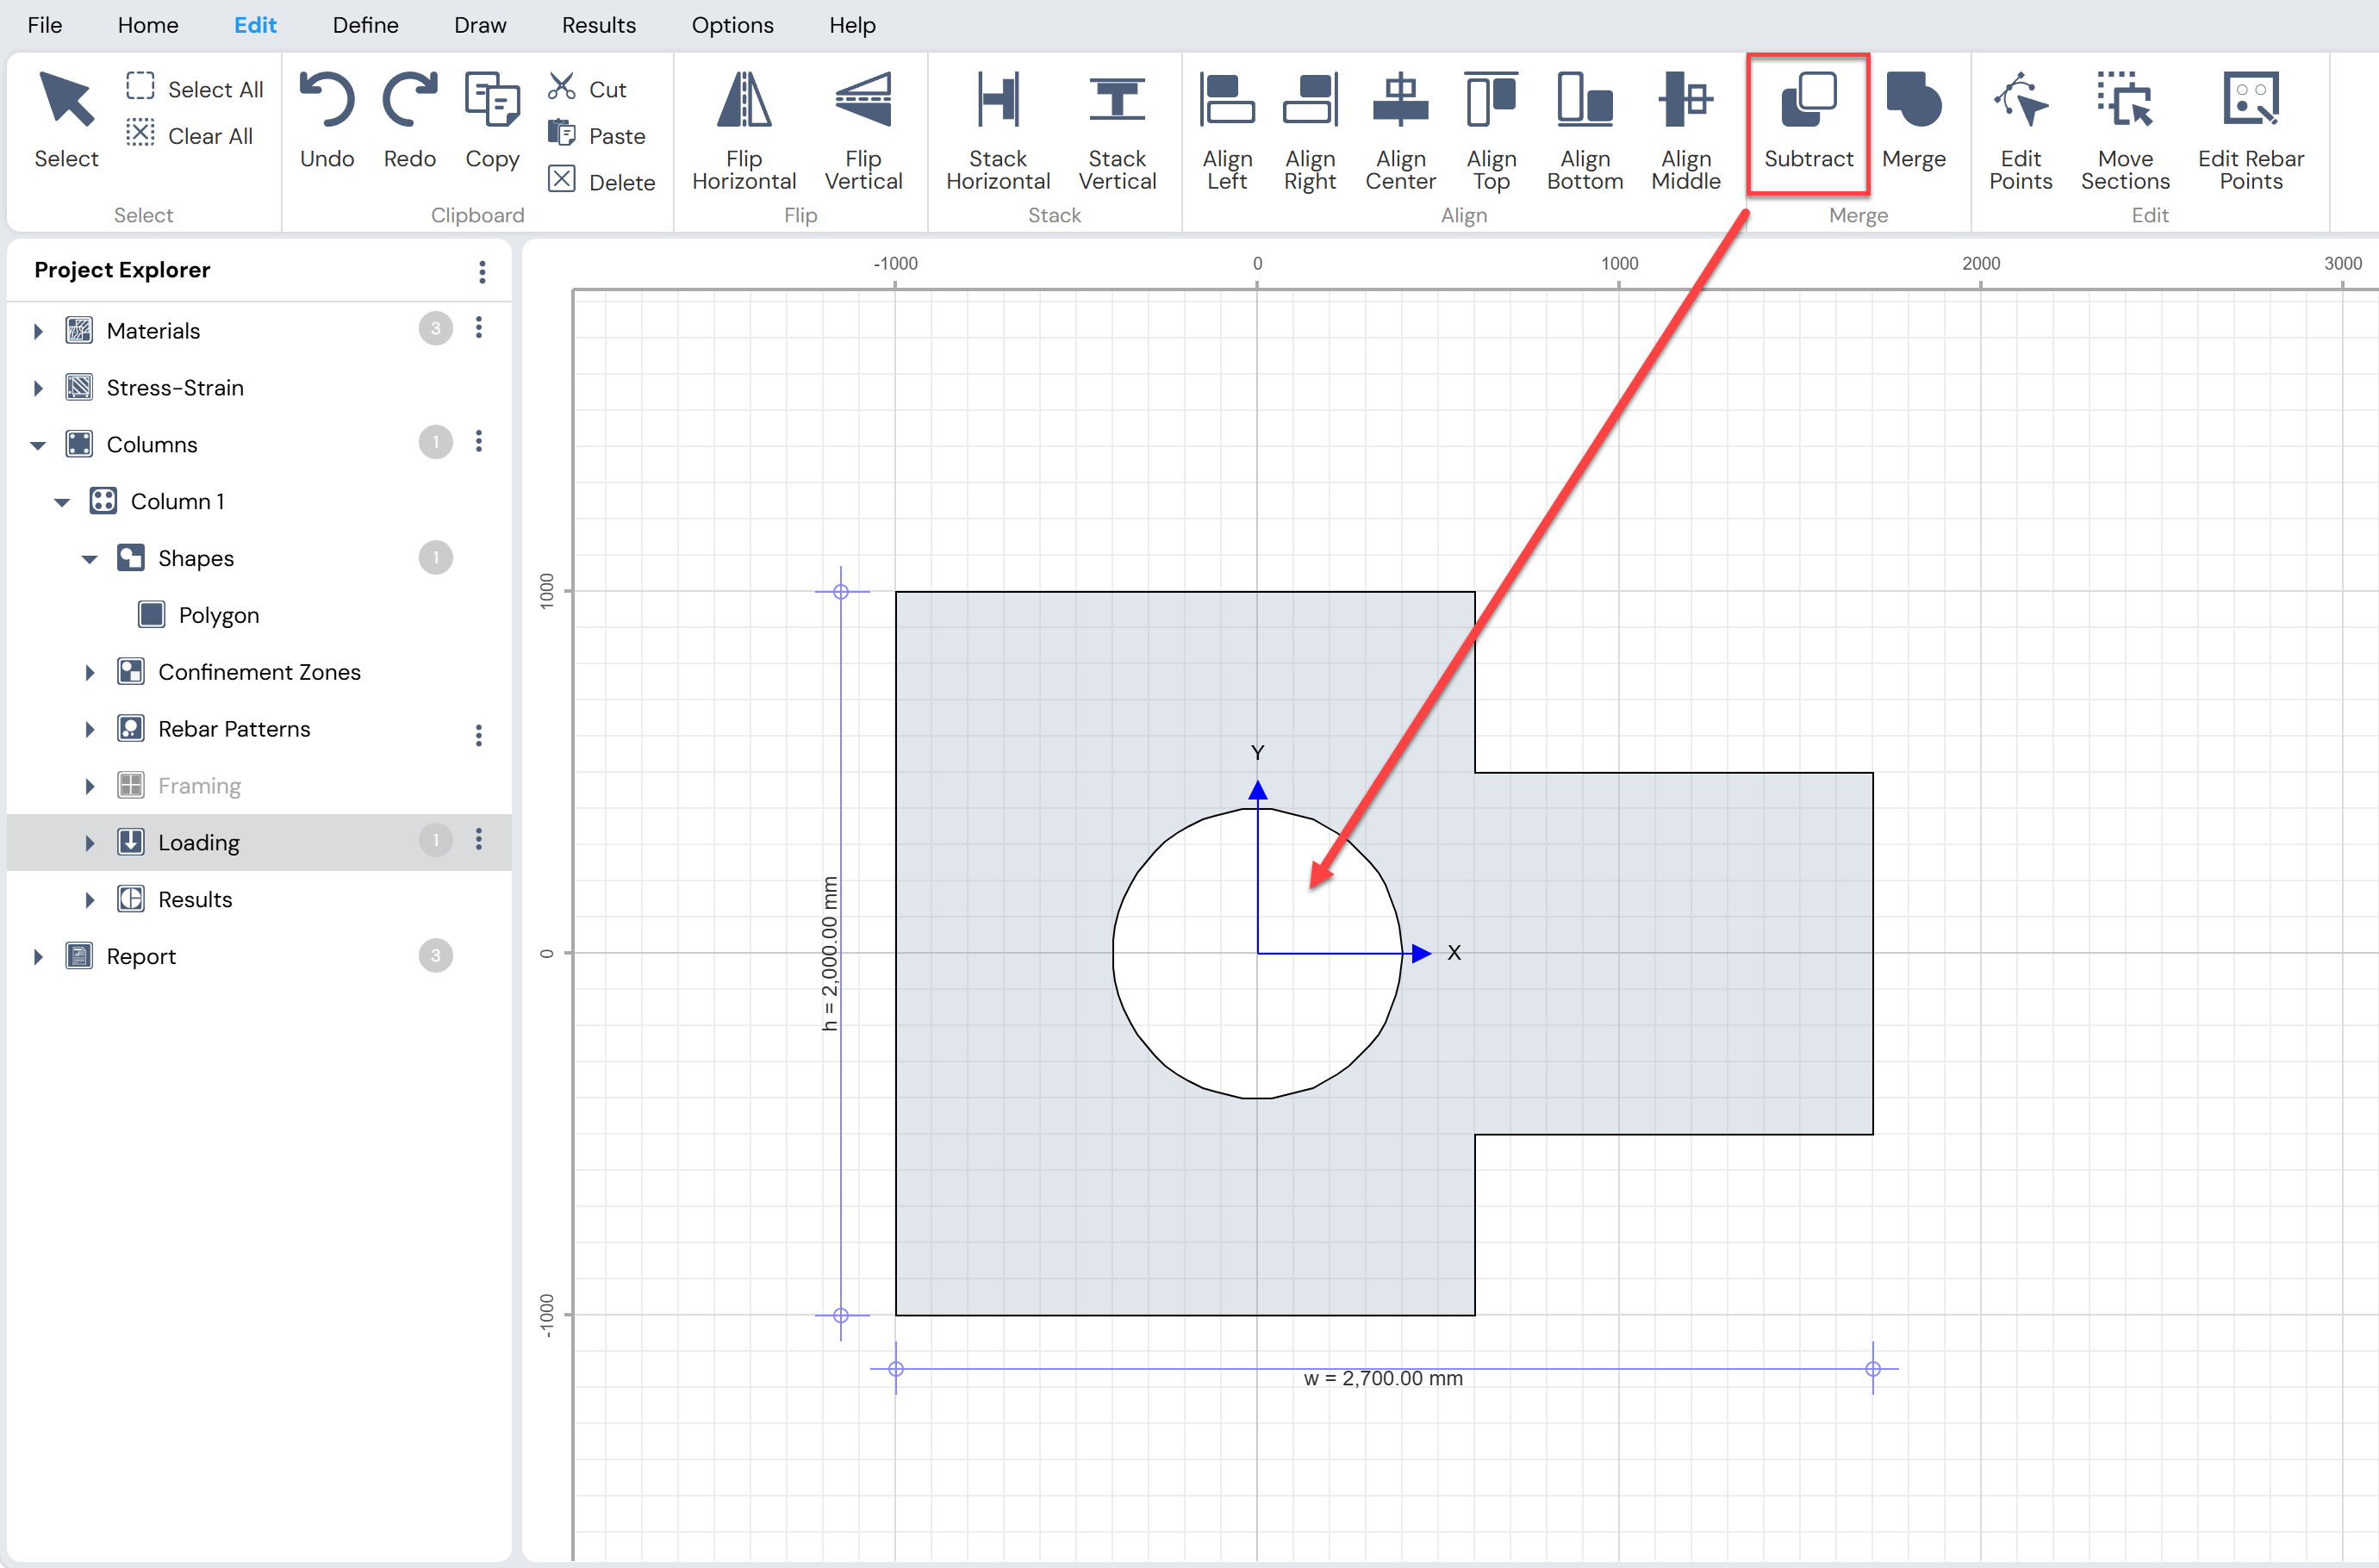
Figure: Creating Holes in Shapes
Move Shapes
Selected shapes can be moved either graphically using the mouse or numerically using displacement values.
Move Shapes Using the Mouse
Click Edit Menu → Select to activate Selection Mode.
Select a single shape or multiple shapes (use Ctrl or Shift for multi-selection).
Hold down the left mouse button and drag the shapes to the desired location.
Move Shapes by Displacement Values
Click Edit Menu → Select to activate Selection Mode.
Select the shape(s) to be moved.
Click Edit Menu → Edit → Move Sections to open the Move Points form.
Enter the displacement values in the X (dx) and Y (dy) directions.
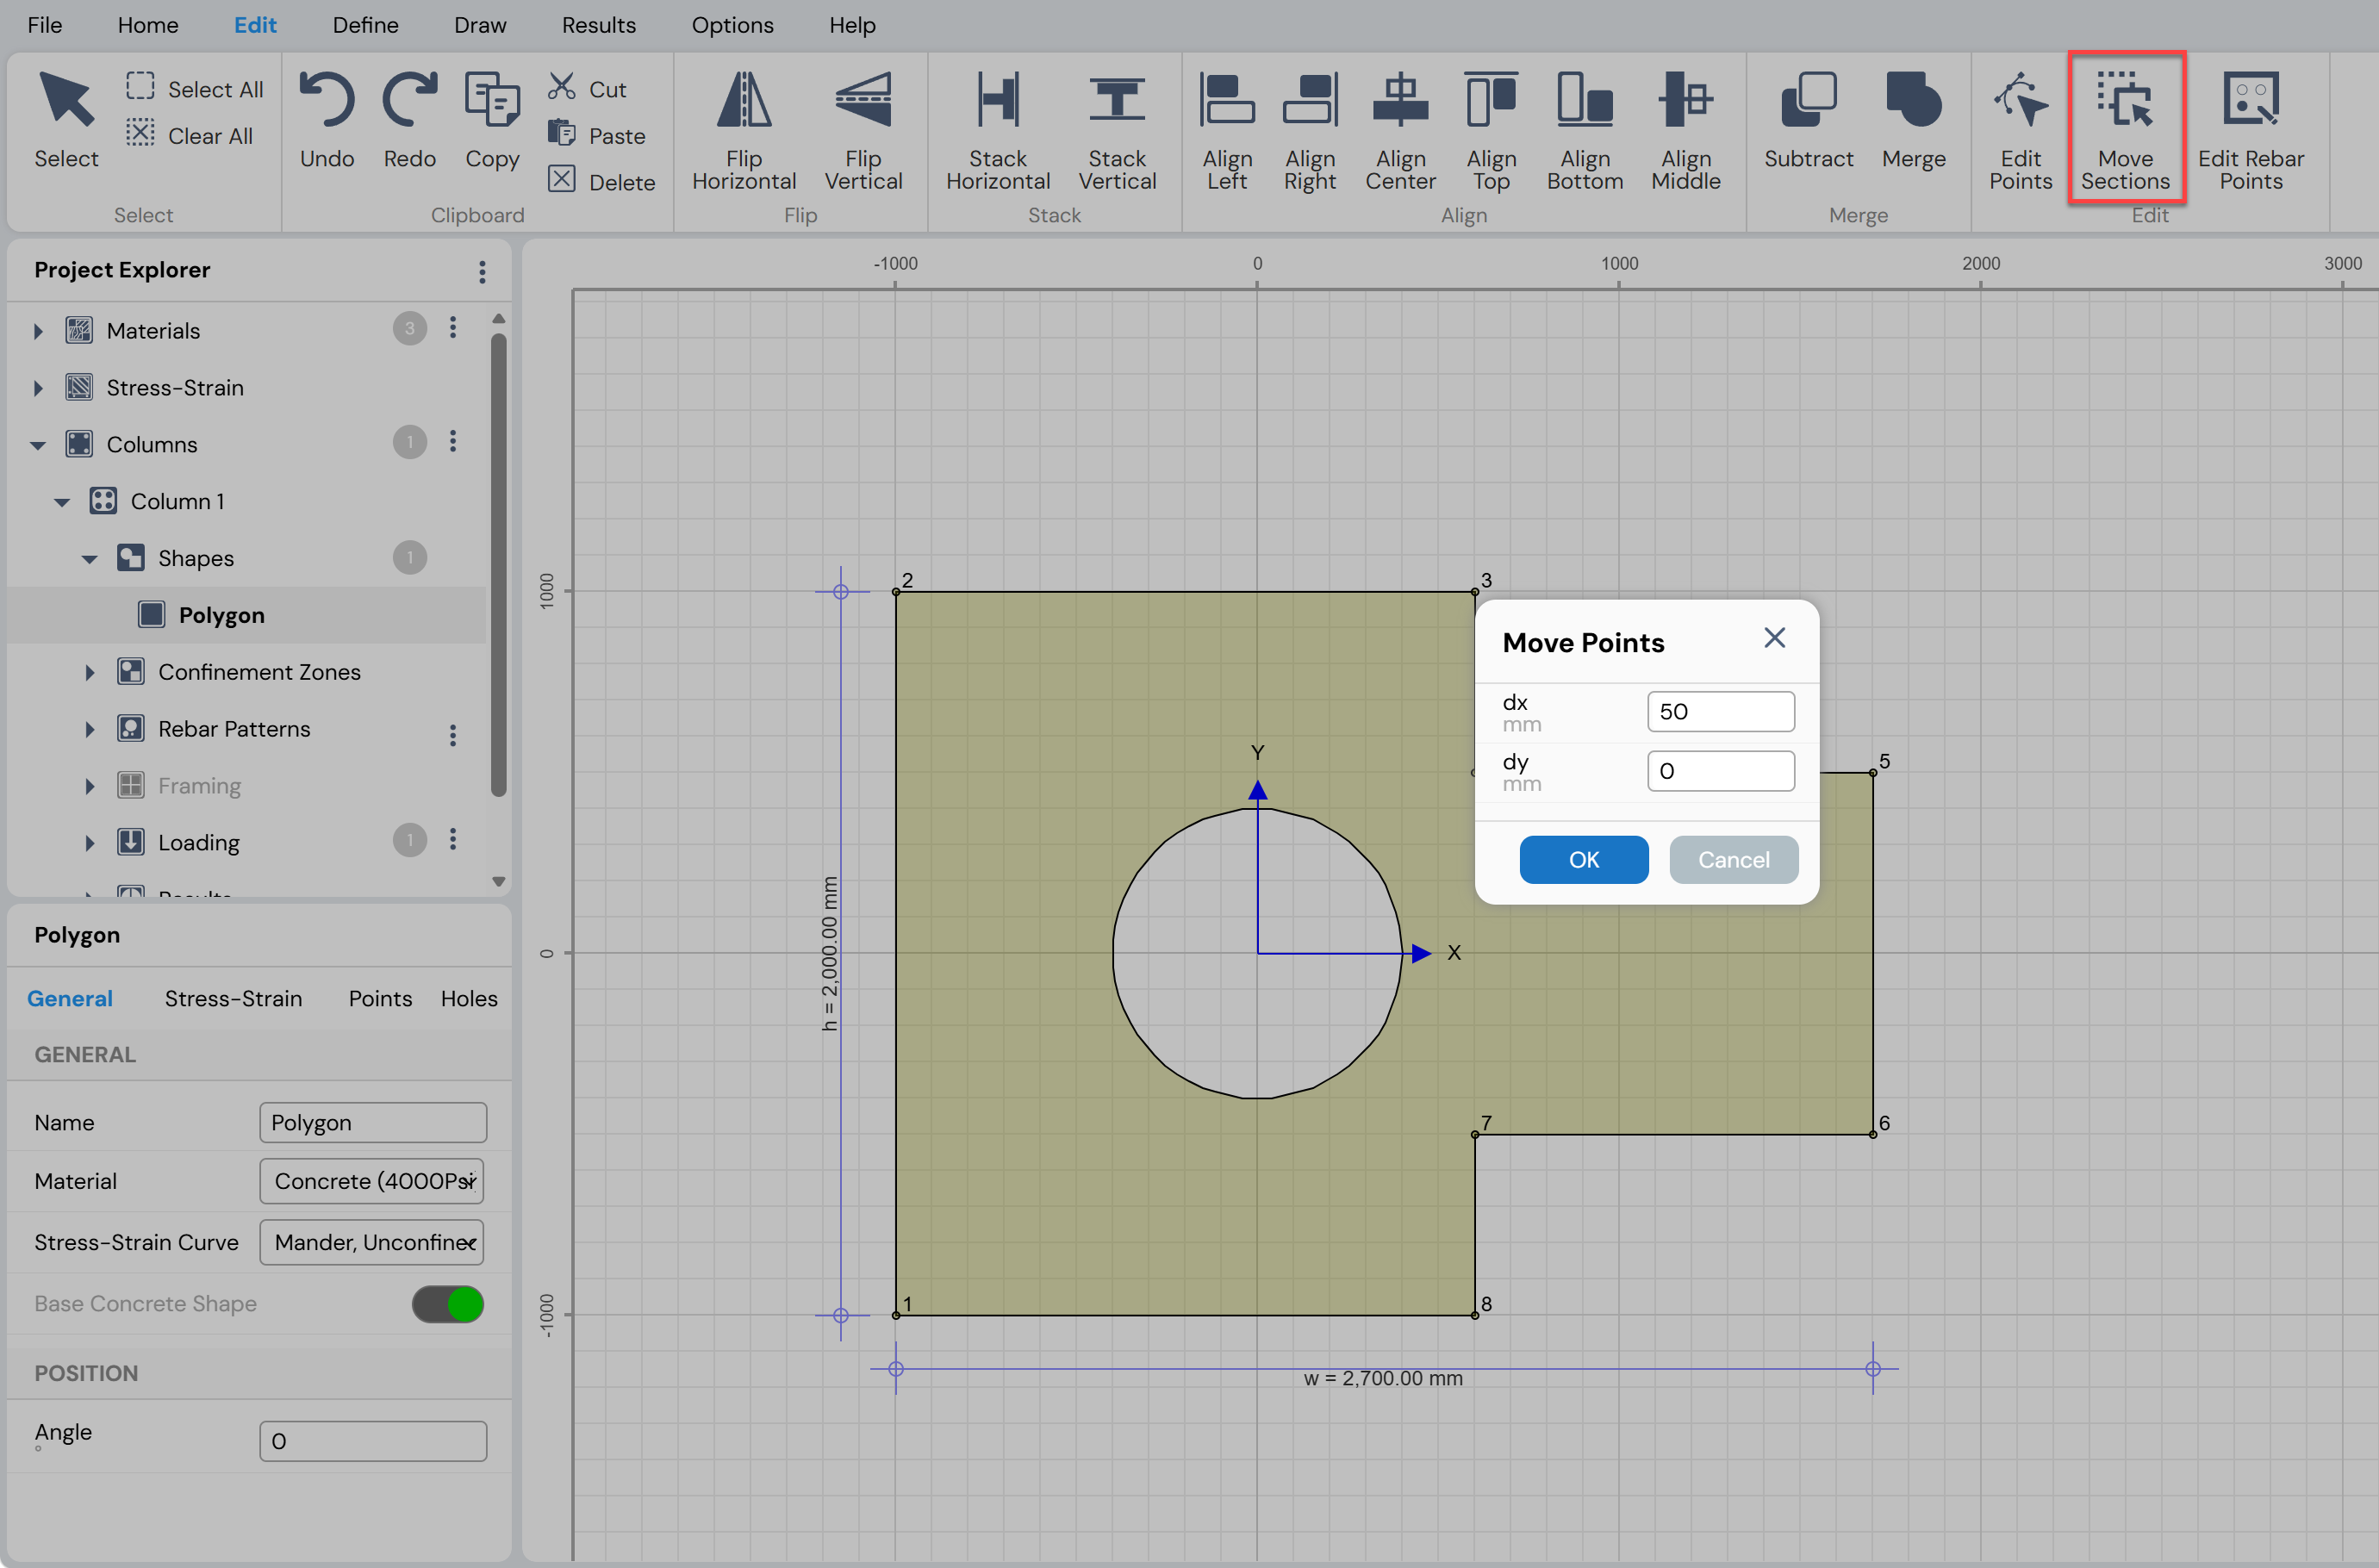
Figure: Moving Shapes by Displacement Values
Obtain and Interpret Results
This section describes how to obtain and interpret the various analysis and design results generated by Column Designer. The available result options allow users to evaluate column behavior, capacity, and adequacy under different loading conditions.
Overview
It is assumed that the user is familiar with the basic concepts of:
Column design and analysis
Structural concrete mechanics
Interpretation of structural analysis results and design parameters
This section focuses on presenting and interpreting the following types of results:
Displaying geometric properties and other section-related results
Plotting flexural stress distributions for various load combinations
Generating interaction curves and interaction surfaces
Plotting moment–curvature relationships
Checking the adequacy and capacity of a column section for different load combinations
Section Properties
To view a summary of the overall dimensions and geometric properties of the current column section, use one of the following options:
Results Menu → Section → Section Properties, or
Project Explorer → Columns → Results → Section → Section Properties
These options open the Section Properties form, which presents detailed geometric information for the selected column section.
Section Properties Form
The Section Properties form is divided into the following three sections:
Basic Properties
Includes the section area, shear areas, moments of inertia, and torsional constant.Section Bounds
Includes the overall dimensions of the section and the centroid location with respect to both the global origin and the local origin.Additional Properties
Includes the radii of gyration and section moduli of the selected section.
Context-Sensitive Toolbar Options
The following tools are available in the context-sensitive toolbar when viewing Section Properties:
Zoom In

Enlarges the view of the section. Zooming in can also be performed by scrolling the mouse wheel upward.Zoom Out

Reduces the view of the section. Zooming out can also be performed by scrolling the mouse wheel downward.Reset and Refresh View

Restores the section display to its original default view.Add to Report

Adds the displayed section properties to the detailed design report.
Note
For composite sections, concrete is treated as the base material, and all reported geometric properties are presented as transformed section properties.
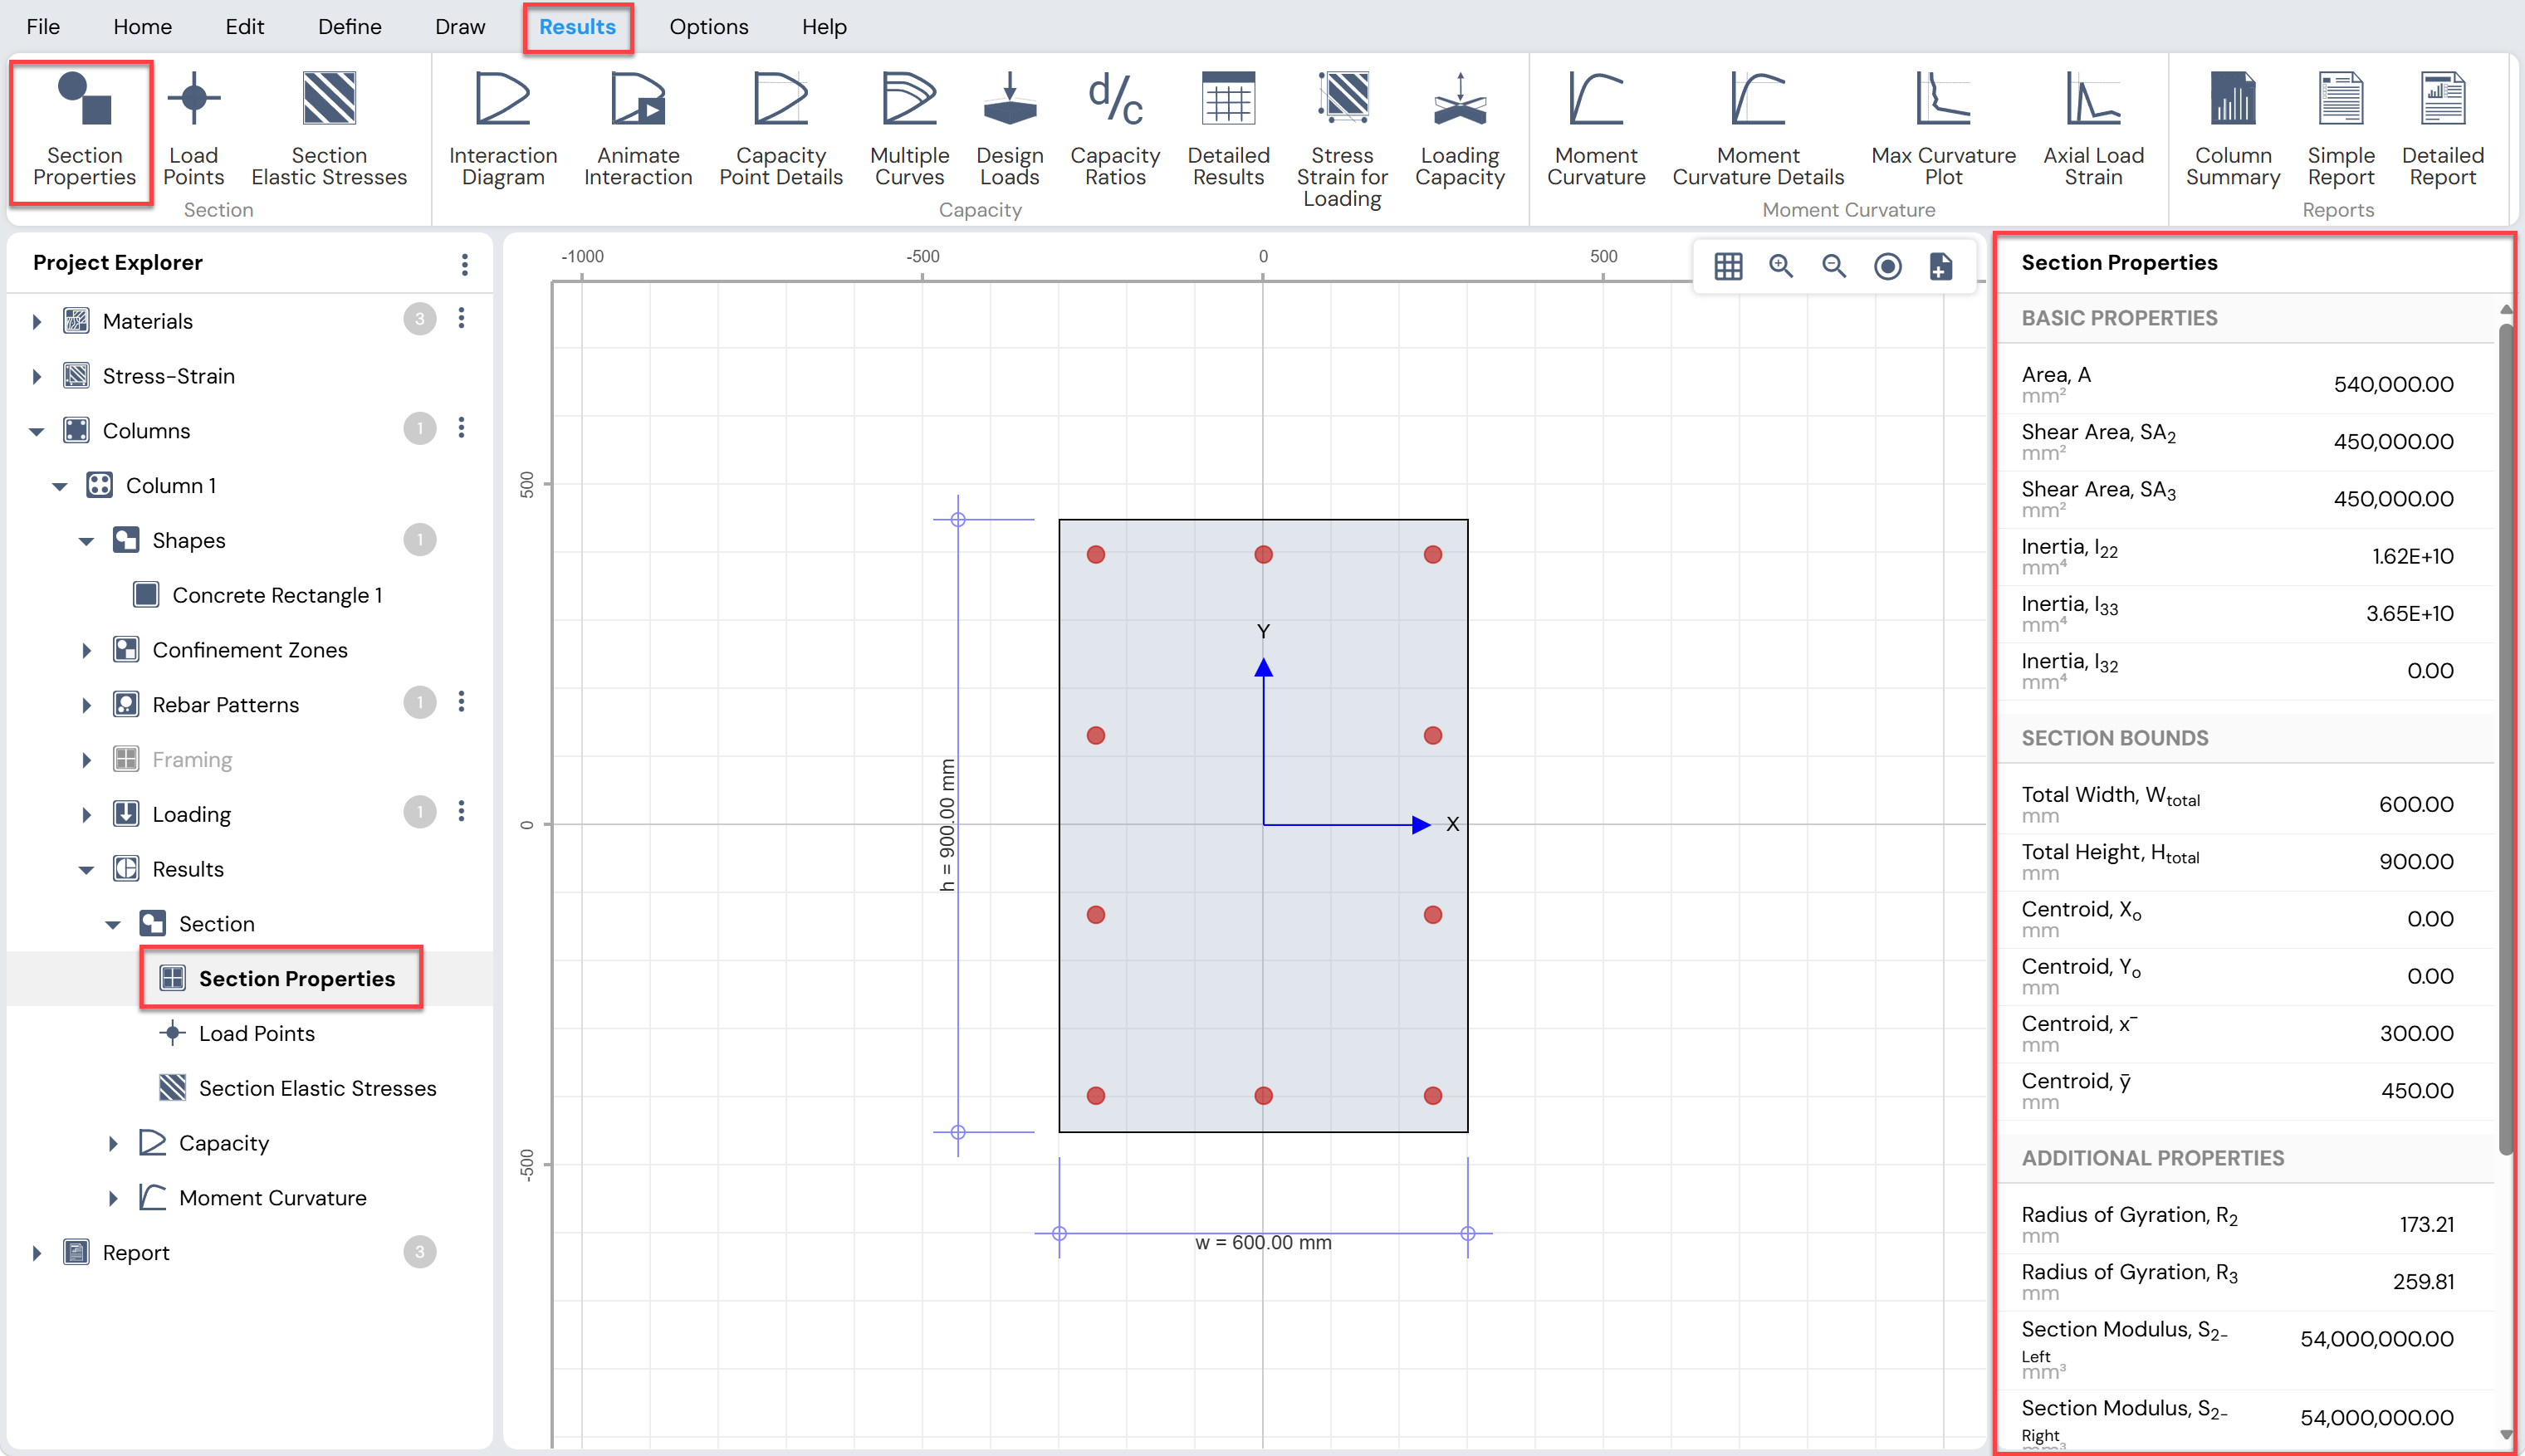
Figure: Viewing Section Properties
Load Points
The Load Points feature displays the location of applied loads on a column section at the upper and lower ends of the column. The position of each load point depends on the direction of load eccentricities along the local 3-axis and local 2-axis of the section.
This feature helps visualize how axial load and bending moments act on the column cross-section for different load combinations.
Displaying Load Points
To display the load point locations and associated eccentricities, follow the steps below:
Create the column section for which the load points are to be viewed.
Define the load combinations for the column section.
Click Results Menu → Section → Load Points, or
Project Explorer → Columns → Results → Section → Load Points.Select the desired load combination and section location from the Load Points Grid (Figure 5.1) that appears in the context-sensitive area.
Choose to view the load points in 2D or 3D using the options available in the context-sensitive toolbar (Figure 5.2).
The eccentricities of the load points are displayed along the local 3-axis and local 2-axis of the column section.
Context-Sensitive Toolbar Options
The following tools are available when viewing Load Points:
2D

Displays the load point locations in a two-dimensional view.3D

Displays the load point locations in a three-dimensional view.Zoom In

Enlarges the view of the load points. Zooming in can also be performed by scrolling the mouse wheel upward.Zoom Out

Reduces the view of the load points. Zooming out can also be performed by scrolling the mouse wheel downward.Reset and Refresh View

Restores the load point display to its default view.Add to Report

Adds the load point information to the detailed design report.
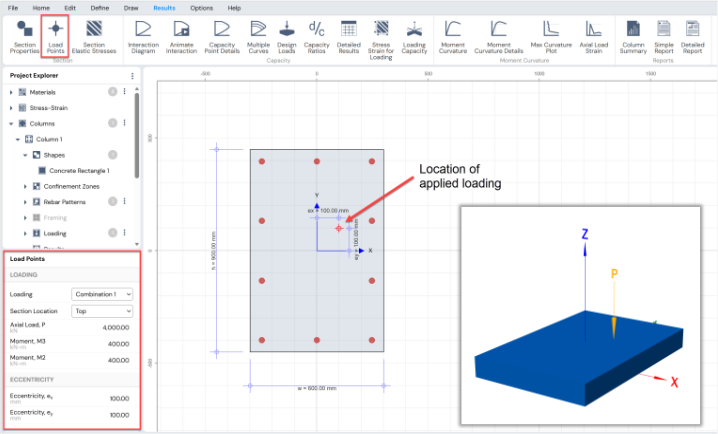
Figure: Displaying Load Point and Load Points Grid
Section Elastic Stresses
After a column section has been created and load combinations have been defined, Column Designer can display flexural stresses on the section as 2D or 3D color-coded contours in the working area.
This feature helps visualize stress distribution across the column cross-section for different load combinations and section locations.
Displaying Section Elastic Stresses
To display elastic stresses on a column section, follow the steps below:
Create the column section for which stresses are to be viewed.
Define the load combinations for the section.
Click Results Menu → Section → Section Stresses, or
Project Explorer → Columns → Results → Section → Section Stresses.Select the desired load combination and section location from the Section Elastic Stresses Grid that appears in the context-sensitive area.
Choose to view the stresses in 2D or 3D using the options available in the associated context-sensitive toolbar.
To read the stress value at any location, hover the mouse cursor over the desired point on the section.
A color-coded legend displayed on the right side of the working area helps interpret the stress values.
Context-Sensitive Toolbar Options
The following tools are available when viewing Section Elastic Stresses:

Displays the section stresses in a two-dimensional view.
Displays the section stresses in a three-dimensional view.Zoom In
Enlarges the stress display. Zooming in can also be performed by scrolling the mouse wheel upward.Zoom Out
Reduces the stress display. Zooming out can also be performed by scrolling the mouse wheel downward.Reset and Refresh View
Restores the section stress display to its default view.Add to Report
Adds the displayed section stresses to the detailed design report.
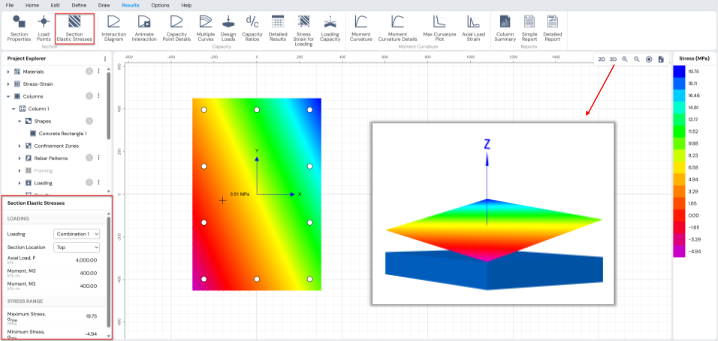
Figure: Section Elastic Stresses and Grid
Interaction Surface and Curves
For a given strain profile on a column cross-section, three stress resultants can be determined:
Axial load (P)
Bending moment about the local 3-axis (M₃)
Bending moment about the local 2-axis (M₂)
As the strain profile varies, the corresponding values of these stress resultants also vary. By plotting the three stress resultants in a three-dimensional space, a continuous surface is generated that represents all possible combinations of P, M₃, and M₂ for the cross-section. This surface is known as the Stress Resultant Interaction Surface.
Capacity (Failure) Surface
When the strain profiles used to generate the interaction surface correspond to material failure conditions, the resulting surface is referred to as the Capacity Surface or Failure Surface.
Any combination of applied actions (P, M₃, M₂) that lies inside the volume enclosed by this surface is considered safe.
Any combination that produces a point outside this surface is considered unsafe.
Because the interaction surface exists in three-dimensional space, it cannot be represented directly on a two-dimensional plot. However, it can be visualized through two-dimensional interaction curves obtained by slicing the surface in specific planes.
Interaction Curves Derived from the Capacity Surface
The two most commonly used curves derived from the interaction surface are described below.
Load–Moment Interaction Curve (P–M Curve)
A P–M interaction curve is obtained by slicing the capacity surface vertically at a specified angle about the origin. This produces a two-dimensional plot showing the relationship between:
Axial load capacity (P), and
Resultant bending moment capacity (M)
P–M curves are widely used for the design and assessment of columns. Special P–M curves can be generated by slicing the capacity surface along the local 3-axis or local 2-axis, providing insight into column behavior under uniaxial bending.
Moment–Moment Interaction Curve (M–M Curve)
A Moment–Moment (M–M) interaction curve is obtained by slicing the capacity surface on the local 2–3 plane. This produces a plot of:
Moment capacity about the local 3-axis (M₃) versus
Moment capacity about the local 2-axis (M₂)
The M–M interaction curve illustrates how the moment capacity varies around the cross-section at a given axial load level and provides valuable insight into the biaxial bending behavior of the column section.
Interaction Diagrams
The variation of the three parameters governing the capacity of a column section—axial load (P), moment about the local 3-axis (M₃), and moment about the local 2-axis (M₂)—can be displayed together in a single three-dimensional interaction diagram.
In this representation:
P is plotted along the vertical axis, and
M₃ and M₂ are plotted along two orthogonal horizontal axes.
This provides an overall view of the combined axial–biaxial bending capacity of the column section.
Generating Interaction Diagrams
To generate and view interaction surfaces and curves for a column section, follow the steps below:
Define the column section geometry and material properties (refer to Chapter 3 for details).
Click Results Menu → Capacity → Interaction Diagram, or
Project Explorer → Columns → Results → Capacity → Interaction Diagram.Selecting this option activates the Interaction Diagram Settings Grid in the context-sensitive area, where display options—such as inclusion or exclusion of strength reduction factors (or partial safety factors)—can be adjusted.
After modifying the desired settings, click Refresh to update the interaction diagrams.
Notes
Strength reduction factors (or partial safety factors) specific to the selected design code can be modified from
Options Menu → Strength Reduction Factors (or Partial Safety Factors, depending on the code).The stirrup type (tied or spiral) can be specified from Define Menu → Stirrup Type.
The number of curves generated in the interaction diagram can be controlled from
Options Menu → Diagrams → Curves.- Default value: 32 curves, each at 11.25° neutral-axis rotation.
The number of points displayed on each curve can be adjusted from
Options Menu → Diagrams → Points.- Default value: 25 points per curve.
Interaction Diagram Display
The working area is divided into three sections, each with its own toolbar, as shown in Figure.
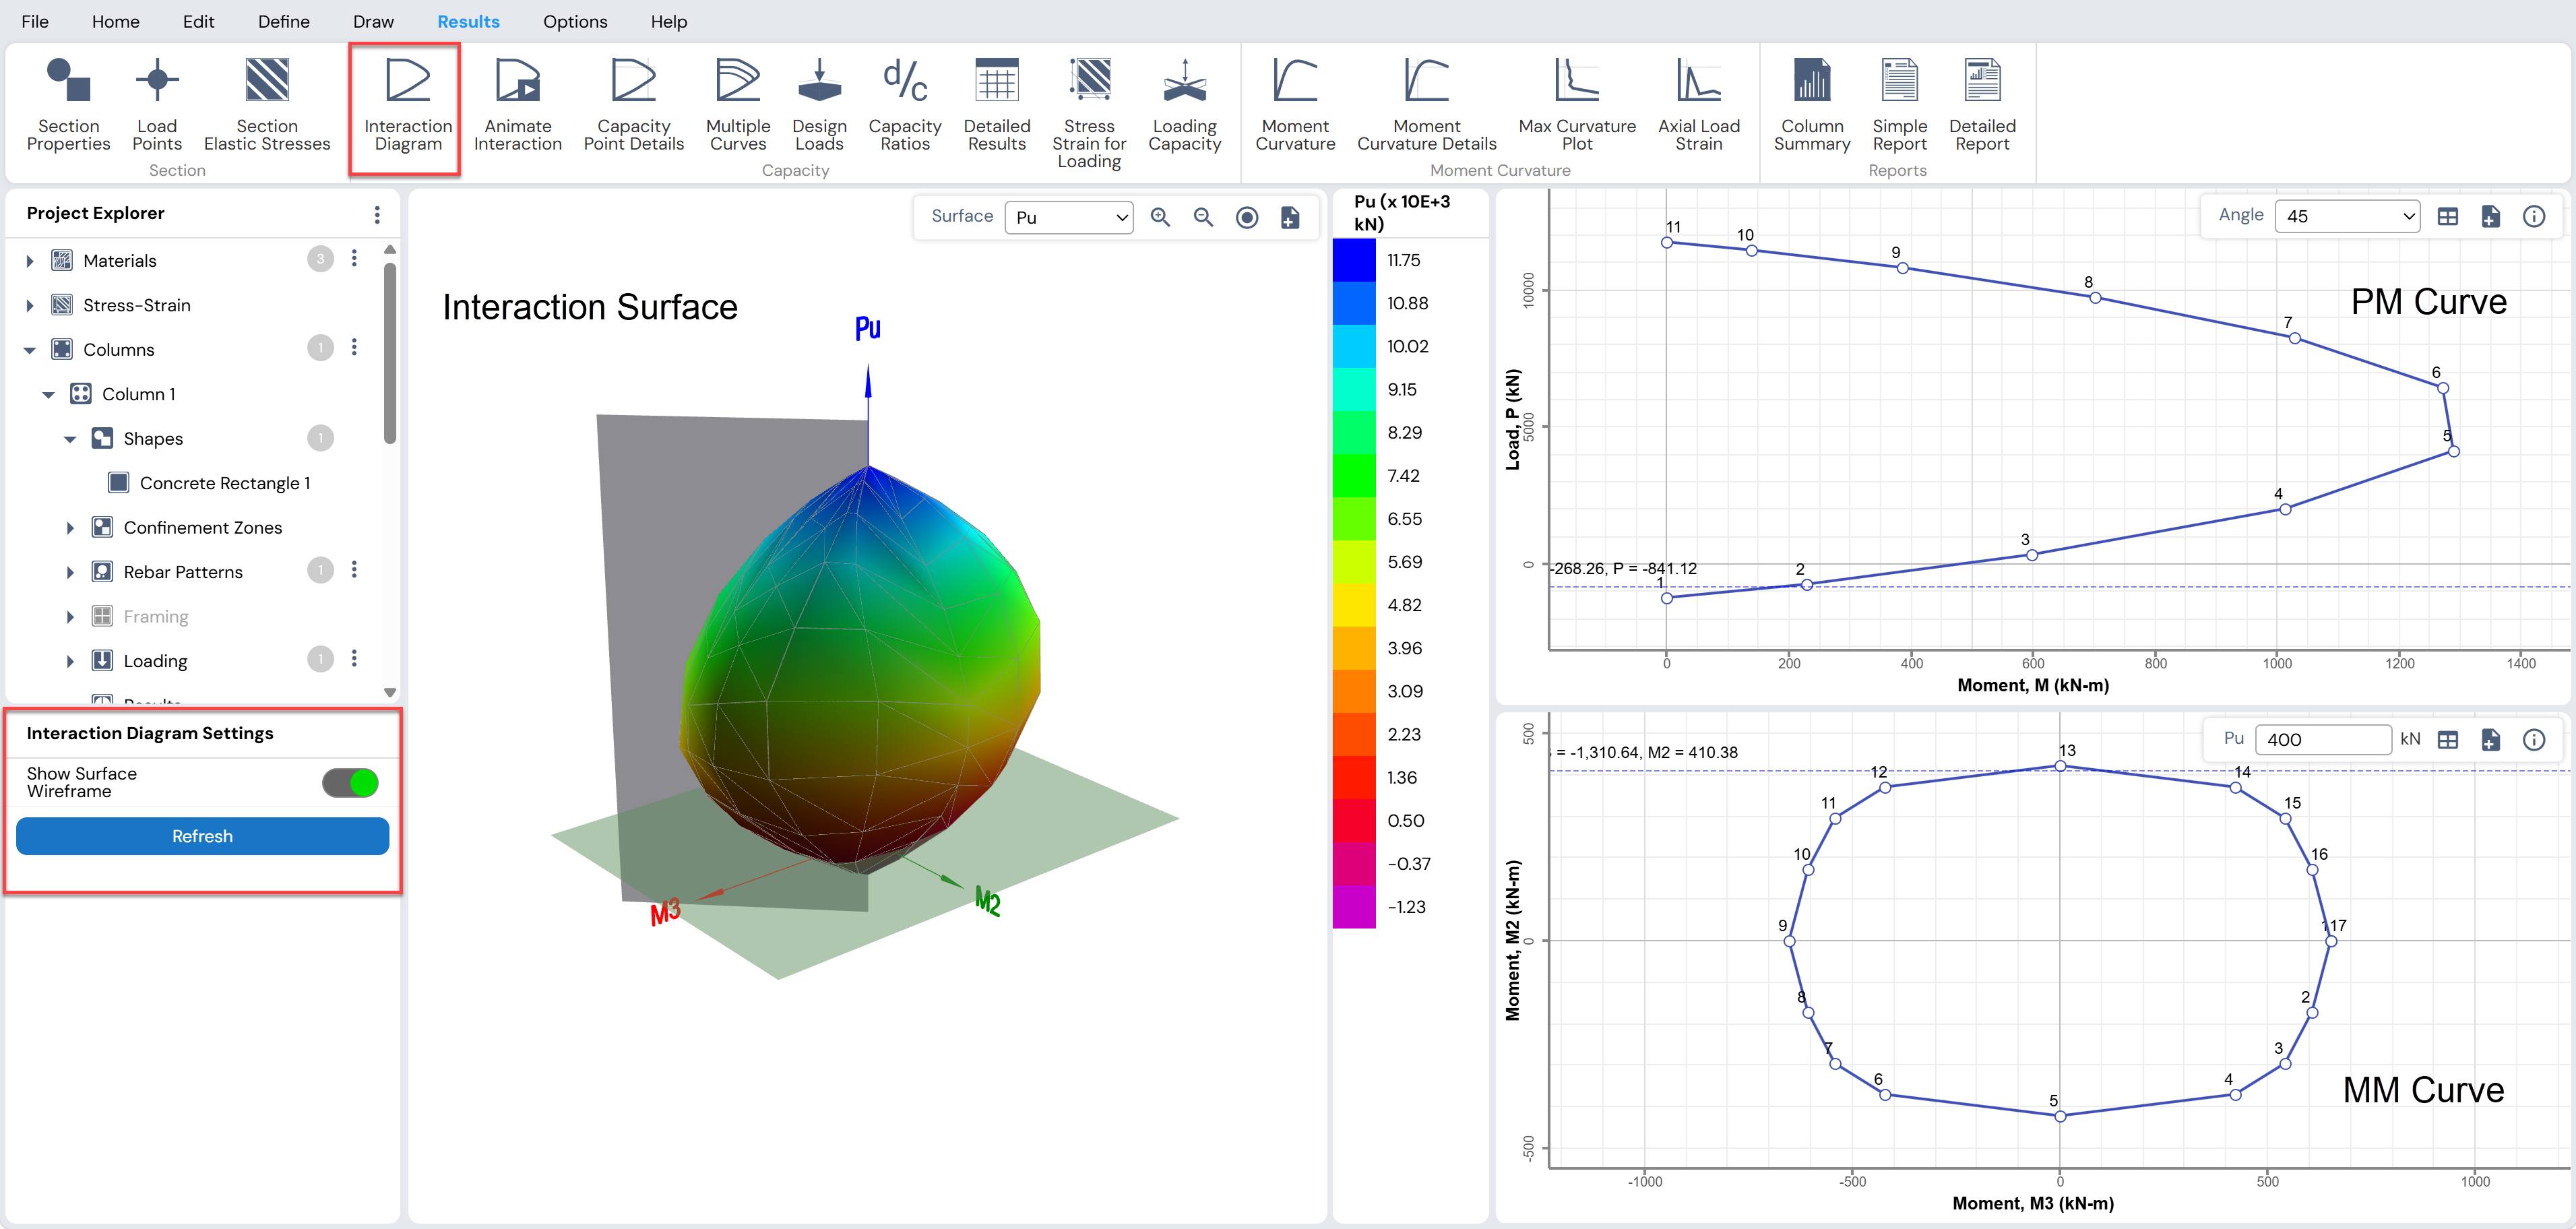
Figure: Interaction Diagram Screen
Each section and its associated tools are described below.
Interaction Surface
The Interaction Surface displays the variation of axial load capacity and biaxial moment capacity in a color-coded 3D plot.
Pᵤ is plotted along the vertical axis.
M₃ and M₂ are plotted along the horizontal axes.
This visualization provides a complete overview of the section’s capacity.
Interaction Surface Toolbar Options
Interaction Surface Drop-Down List

Select whether the surface coloring represents Pᵤ, M₂, or M₃.
A color legend is shown on the right side to assist interpretation.Zoom In
Enlarges the interaction surface view. Mouse scroll-up can also be used.Zoom Out
Reduces the interaction surface view. Mouse scroll-down can also be used.Reset and Refresh View
Restores the interaction surface to the default display.Add to Report
Adds the interaction surface to the detailed design report.
P–M Curves
P–M curves are obtained by slicing the interaction surface with a vertical plane at specified neutral-axis angles. Each curve represents the relationship between axial load and resultant bending moment.
P–M Curve Toolbar Options
Angle Drop-Down List

Displays available neutral-axis angles and user-defined load combinations.
If a load combination is selected and the corresponding point lies within the curve, the section is adequate for that load.
Moving the cursor over the curve displays numerical values at any point.Tabulated Output

Displays the numerical data for the selected curve.
The data may be exported to Excel or copied to the clipboard.Add to Report

Adds the displayed P–M curve to the detailed report.Interaction Curve Details

Opens the Interaction Curve Details form, showing information such as neutral-axis angle, maximum compression and tension capacity, and maximum moment capacity.
M–M Curves
M–M curves are obtained by slicing the interaction surface with a horizontal plane at a specified axial load level (Pᵤ). These curves represent the biaxial bending capacity at a given axial load.
M–M Curve Toolbar Options
Pᵤ Value Edit Box

Enter the axial load level for which the M–M curve is to be displayed.
The curve updates automatically.Tabulated Output
Displays numerical data for the curve, which can be exported or copied.Add to Report
Adds the M–M curve to the detailed report.Interaction Curve Details
Displays maximum and minimum moment capacities about the local 2- and 3-axes.
Animate Interaction
The Animate Interaction feature allows users to visualize the generation of the capacity interaction surface as the neutral axis angle varies.
To view the interaction animation:
Click Results Menu → Capacity → Animate Interaction, or
Select Project Explorer → Columns → Results → Capacity → Animate Interaction
This opens an animated display showing how the interaction surface is formed for different neutral axis orientations.
Animation Toolbar Options
The following tools are available in the animation toolbar:
Play / Stop

Click Play to start the animation.
While the animation is running, the button changes to Stop , which can be clicked to pause the animation.
Zoom In
Enlarges the interaction surface display. Zooming in can also be performed by scrolling the mouse wheel upward.Zoom Out
Reduces the interaction surface display. Zooming out can also be performed by scrolling the mouse wheel downward.Reset and Refresh View
Restores the interaction surface display to its original default view.
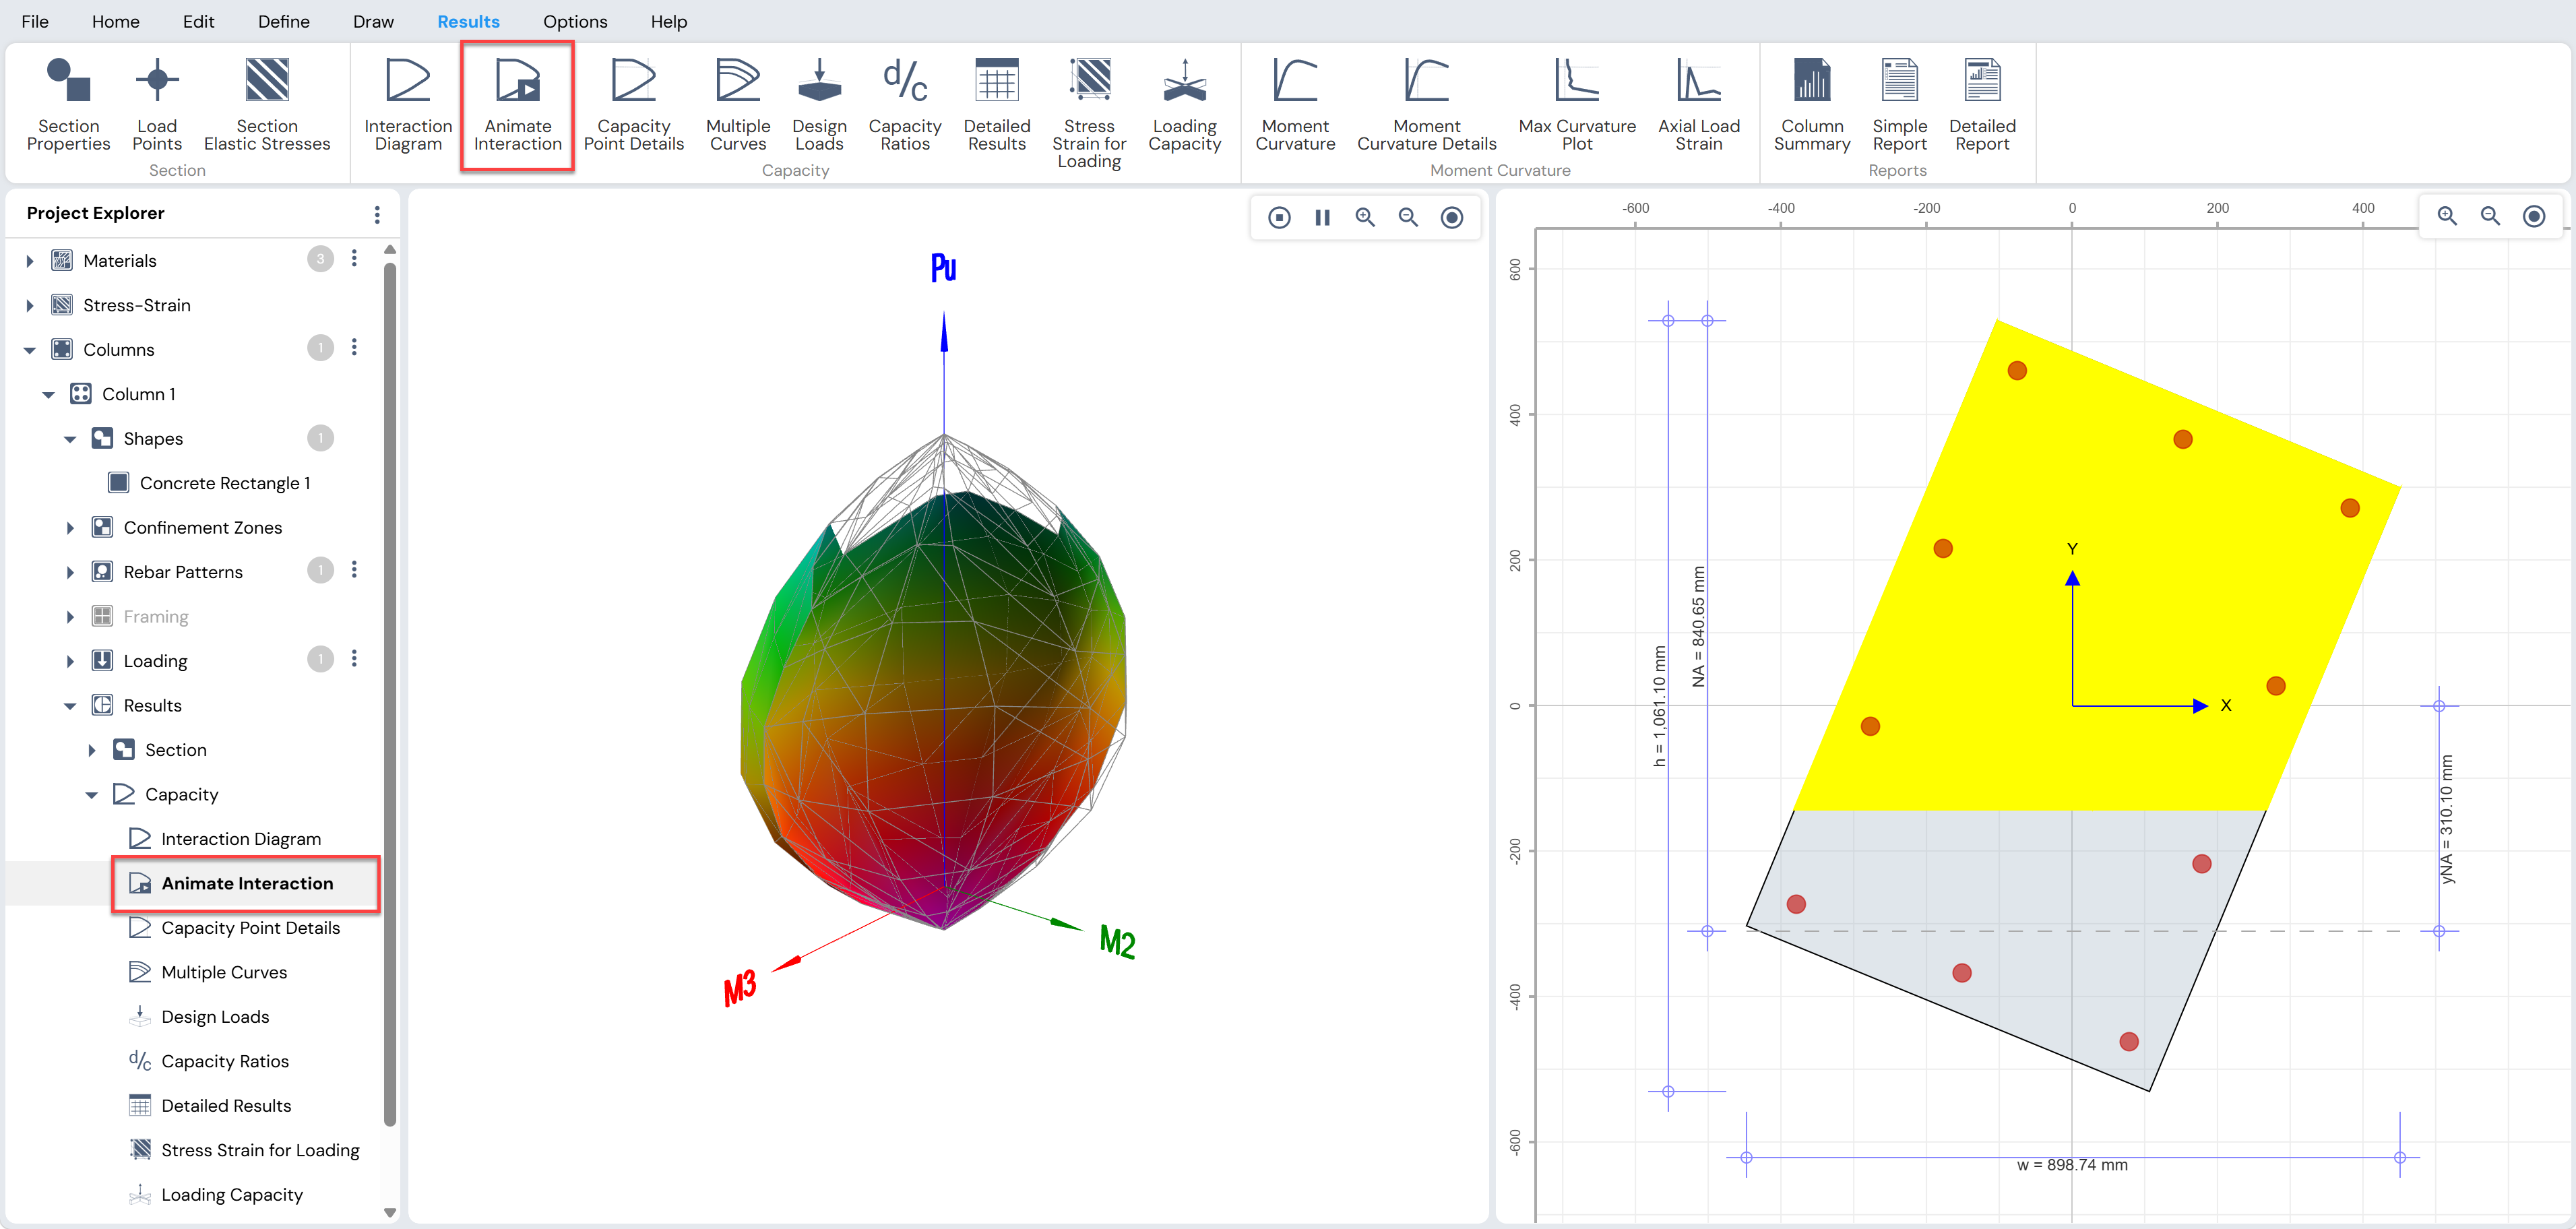
Figure: Animate Interaction Diagram Screen
Capacity Point Details
The Capacity Point Details feature provides detailed information at selected points along the P–M interaction diagram, either for a specified neutral axis angle (with respect to the X-axis) or for a selected load combination.
To access this feature, use one of the following options:
Results Menu → Capacity → Capacity Point Details, or
Project Explorer → Columns → Results → Capacity → Capacity Point Details
Capacity Point Details Display
The working area is divided into two sections, each with its own toolbar:
Left Section: P–M Curve display
Right Section: Stress/Strain Contour display
As the cursor is moved along points on the P–M curve in the left section, the corresponding capacity point information is displayed in the Capacity Point Details Grid in the context-sensitive area. At the same time, the associated stress or strain contour is displayed in the right section.
The following information may be displayed for each capacity point:
Point status
Axial load
Major bending moment
Force and moment contributions from concrete and reinforcement
Strain values in concrete and reinforcement
Interpretation of Capacity Point Details
The capacity point details provide valuable insight into the behavior of the column section:
By examining the Point Status, it can be determined whether the capacity point lies in a:
Compression-controlled zone, or
Tension-controlled zone
In the compression-controlled zone, failure is initiated by crushing of concrete at the highly compressed edge of the section.
In the tension-controlled zone, failure is initiated by yielding of the outermost longitudinal reinforcement on the tension side of the neutral axis.
The rebar strain and rebar force values are particularly useful for determining appropriate lap splice requirements, such as whether compression lap splices or tension lap splices are required in different regions of the P–M diagram.
P–M Curve Section Toolbar Options
The toolbar associated with the P–M curve section provides the following options:
Angle Drop-Down List
Displays available neutral axis angles and all user-defined load combinations.
If the section is adequate for the selected load combination, the load vector lies within the P–M curve, indicating available reserve capacity.
Selecting an angle or load combination updates the P–M curve automatically.
Moving the cursor over the curve displays values at any point.Tabulated Output
Displays the numerical data for the currently displayed curve.
The data can be exported to Excel or copied to the clipboard.Add to Report
Adds the capacity point details to the detailed design report.Interaction Curve Details
Opens the Interaction Curve Details form, which displays information such as:Neutral axis angle
Maximum compression capacity
Maximum tension capacity
Maximum moment capacity
Stress/Strain Contour Section Toolbar Options
The toolbar associated with the stress/strain contour section includes the following options:

Displays the stress or strain contour in two-dimensional view.
Displays the stress or strain contour in three-dimensional view.Type of Contour Drop-Down List

Allows selection of the contour type to be displayed. Available options include:Concrete stress
Bar stress
Concrete strain
Bar strain
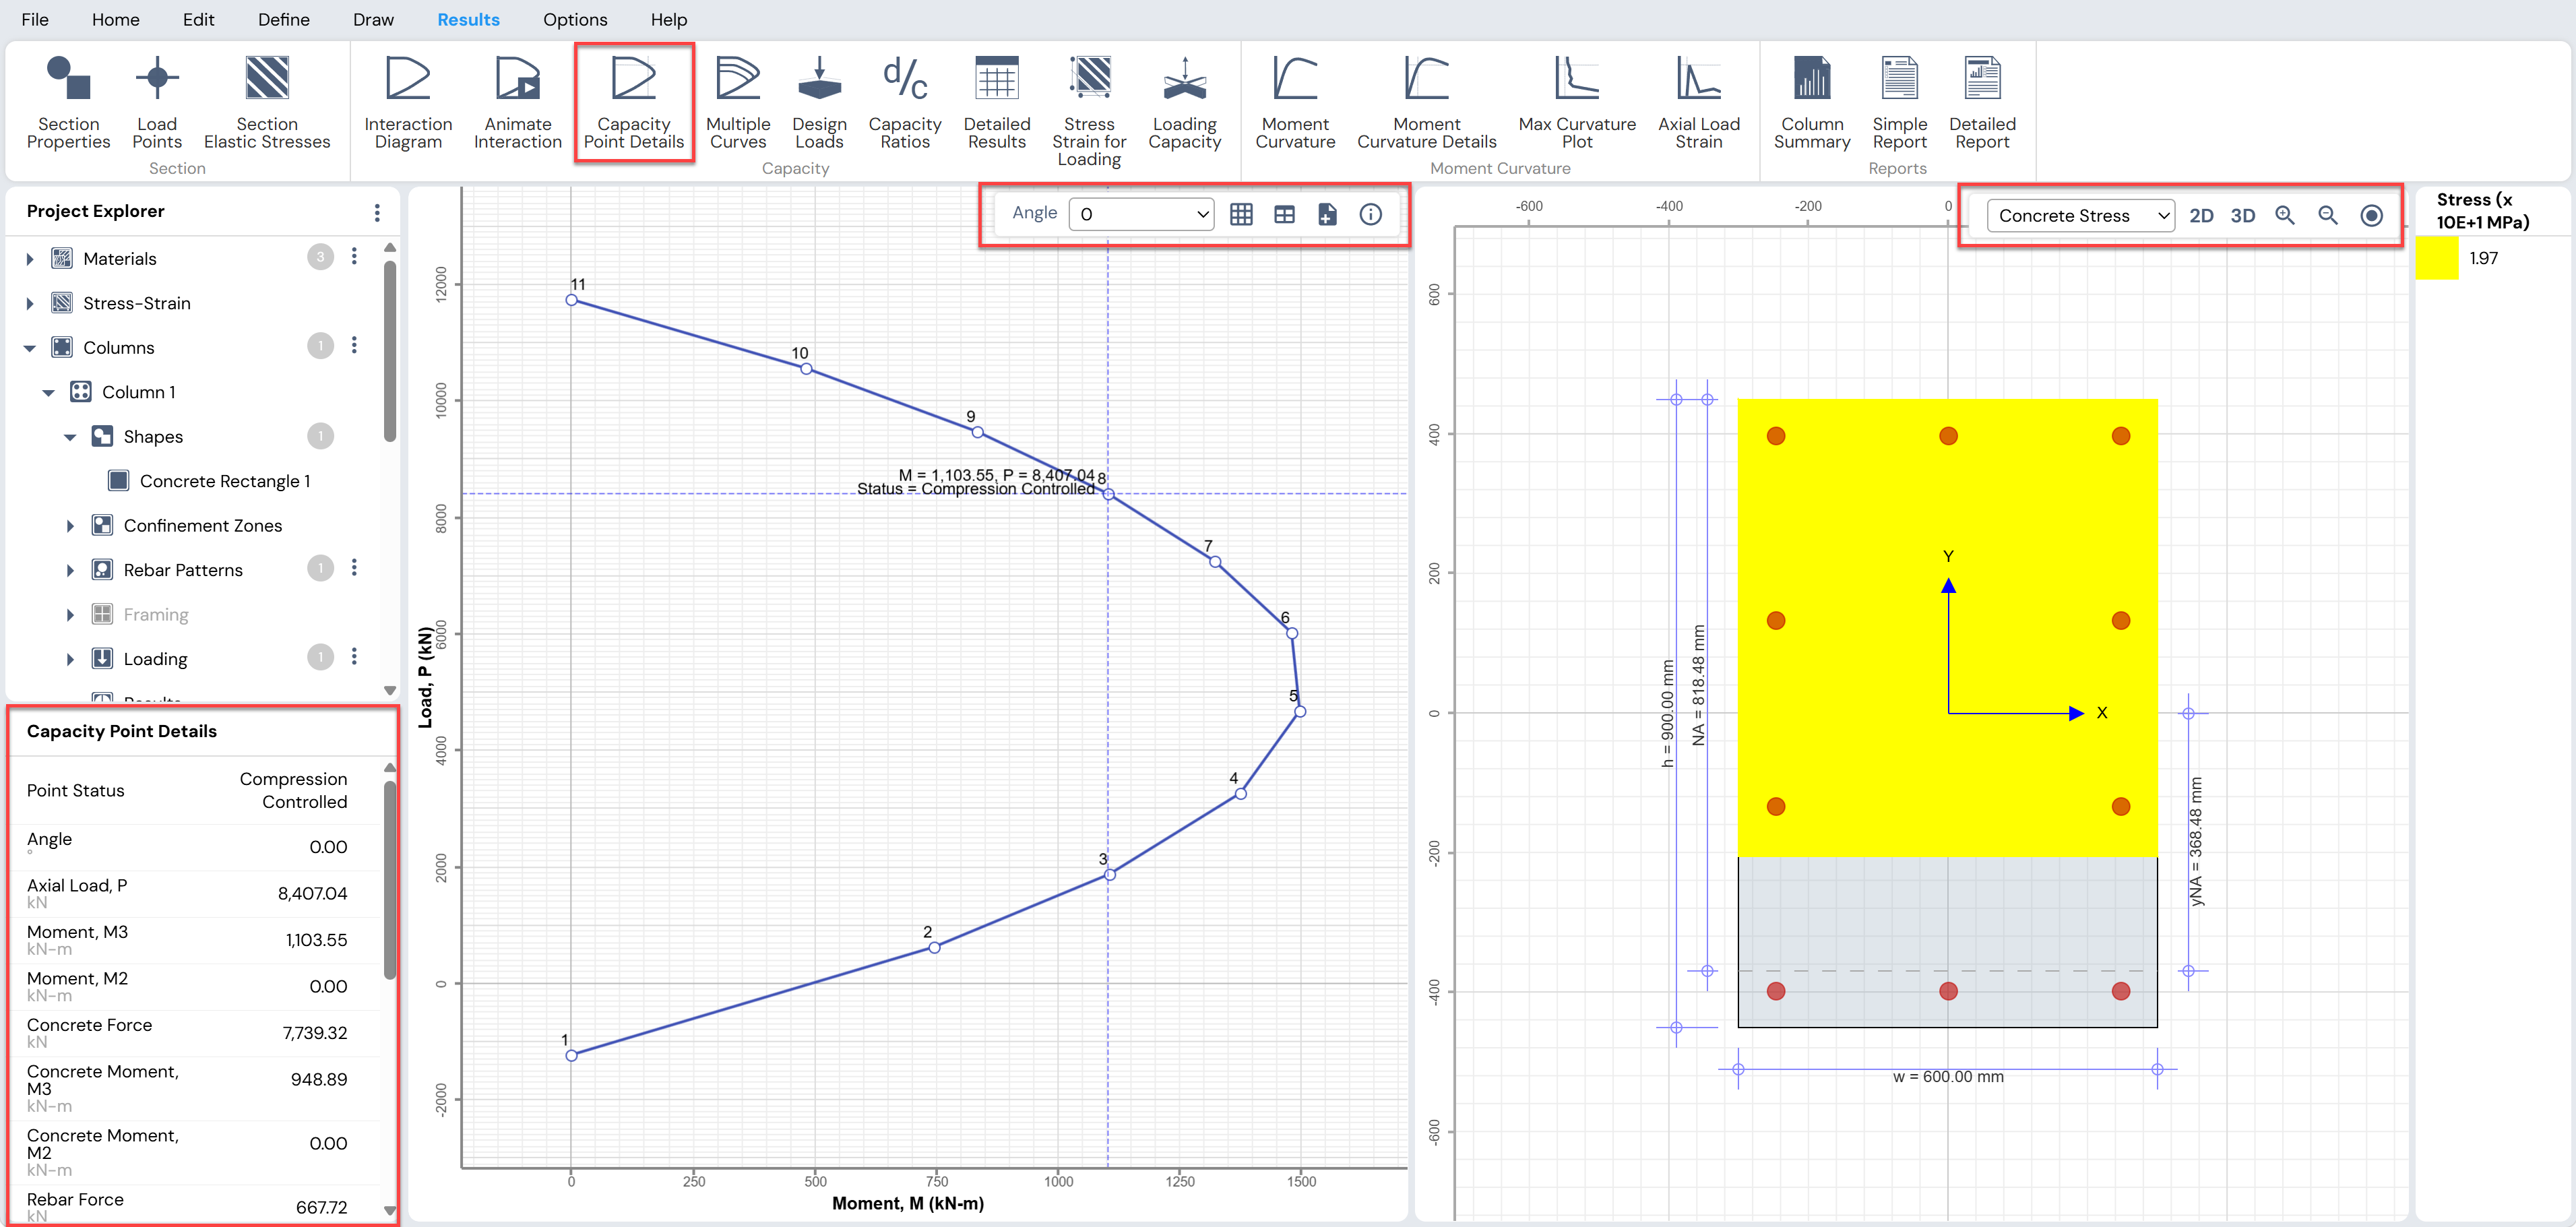
Figure: Capacity Point Details Screen
Multiple Curves
The Multiple Curves feature helps evaluate the influence of key design parameters—such as compressive strength of concrete, tensile strength of reinforcement, and rebar size—on the capacity of a column cross-section.
This feature is especially useful for:
Understanding sensitivity of section capacity to material and reinforcement changes
Identifying the most effective way to improve capacity when a section is found to be inadequate for the given load combinations
Accessing Multiple Curves
To access the Multiple Curves feature, click:
- Results Menu → Capacity → Multiple Curves
This opens the Multiple Curves form, which allows plotting multiple P–M or M–M diagrams on the same graph while varying selected parameters.
Curve Type Options
Select the desired curve type from the following options:
P–M₃ (Angle = 0°)
Plots a P–M interaction diagram at a neutral axis angle of 0 degrees.P–M₂ (Angle = 90°)
Plots a P–M interaction diagram at a neutral axis angle of 90 degrees.P–Mₙ (Specified Neutral Axis Angle)
Plots a P–M interaction diagram at a user-specified neutral axis angle.
Selecting this option requires choosing the desired angle from a drop-down list.P–Mₙ (Specified Load Combination)
Plots the P–M interaction diagram corresponding to a selected load combination.
All previously defined load combinations are available in the drop-down list.M₃–M₂ (Specified Axial Load, Pᵤ)
Plots an M–M interaction curve at a specified axial load level.
Selecting this option requires entering the desired axial load value (Pᵤ).
Varying Parameters and Generating Curves
Select the Variable Type to be varied, such as:
Compressive strength of concrete (f′c)
Steel tensile strength (fᵧ)
Rebar size
Set the remaining options as required for the selected curve type.
Click the Refresh button to generate and display the multiple curves on the same graph.
The resulting plots allow easy comparison of section capacity under different material and reinforcement scenarios.
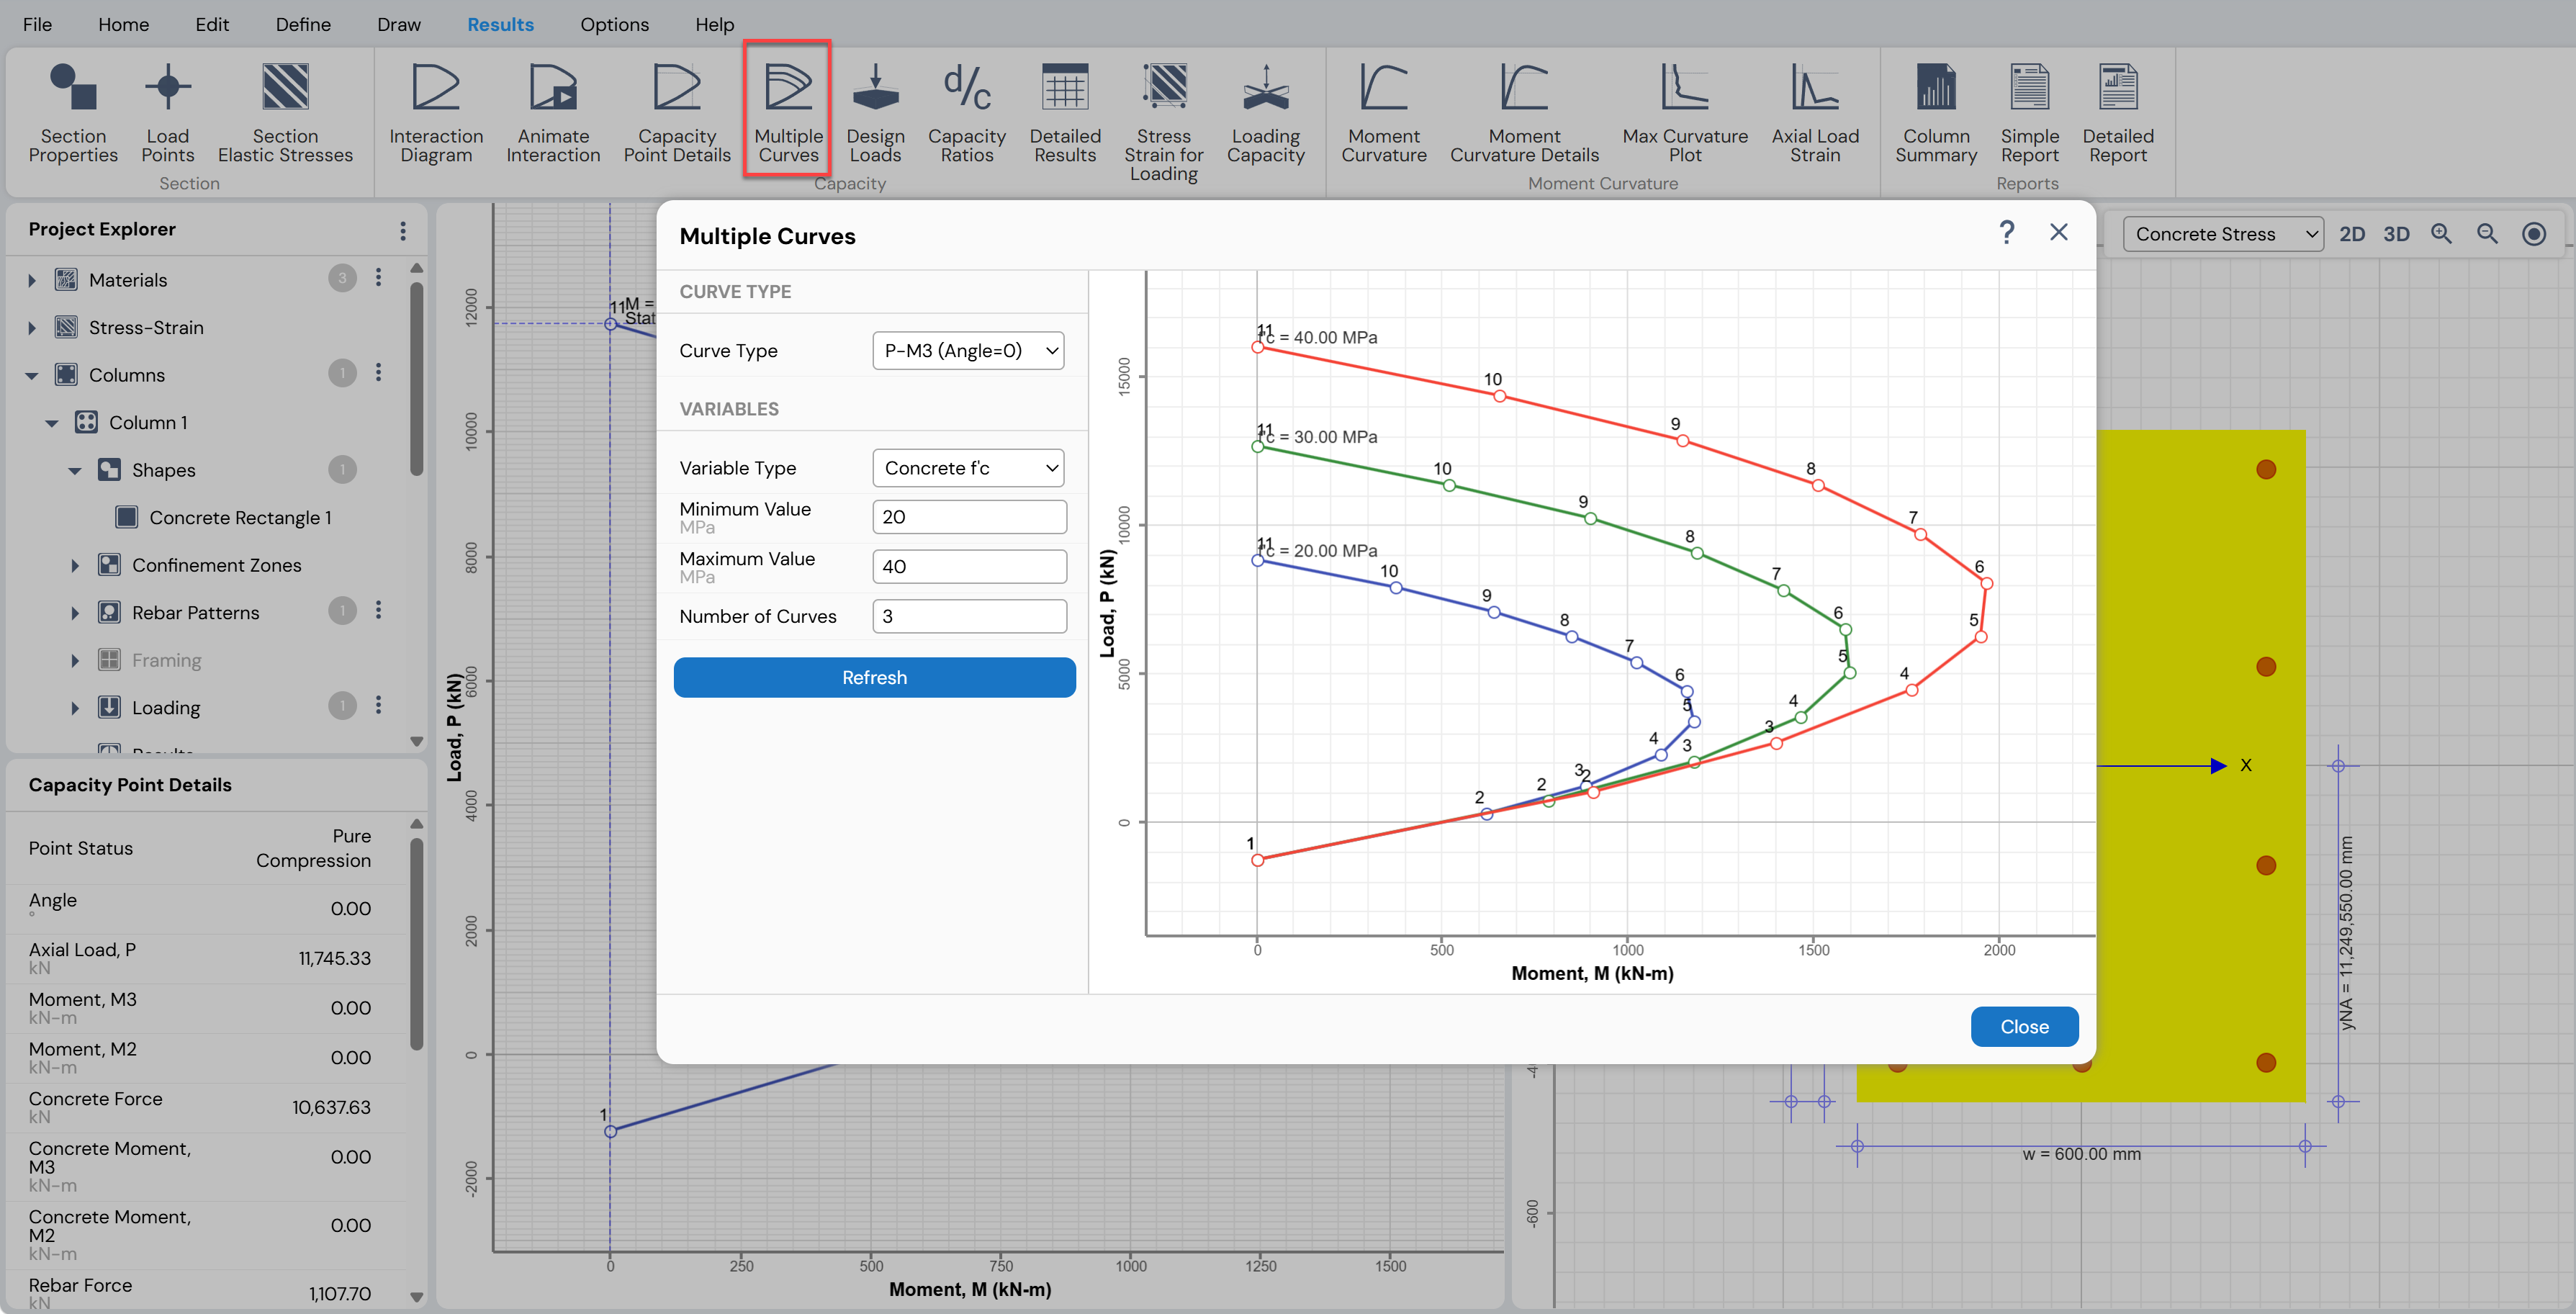
Figure: Multiple Curves Feature in Column Designer
Design Loads
The Design Loads feature displays the final loads used for design after all required adjustments have been applied.
To access the Design Loads form, use one of the following options:
Results Menu → Capacity → Design Loads, or
Project Explorer → Columns → Results → Capacity → Design Loads
This opens the Final Design Loads form, where the loads actually considered in the design checks can be reviewed.
Final Design Loads
For slender columns, the final design loads may differ from the user-defined input loads, as they are modified to account for second-order (moment magnification) effects in accordance with the selected design code.
To view the design loads in a specific direction:
Select the Along X tab to view moments about the X-axis, or
Select the Along Y tab to view moments about the Y-axis
The moments displayed under the Along X and Along Y tabs correspond to bending about the respective global axes.
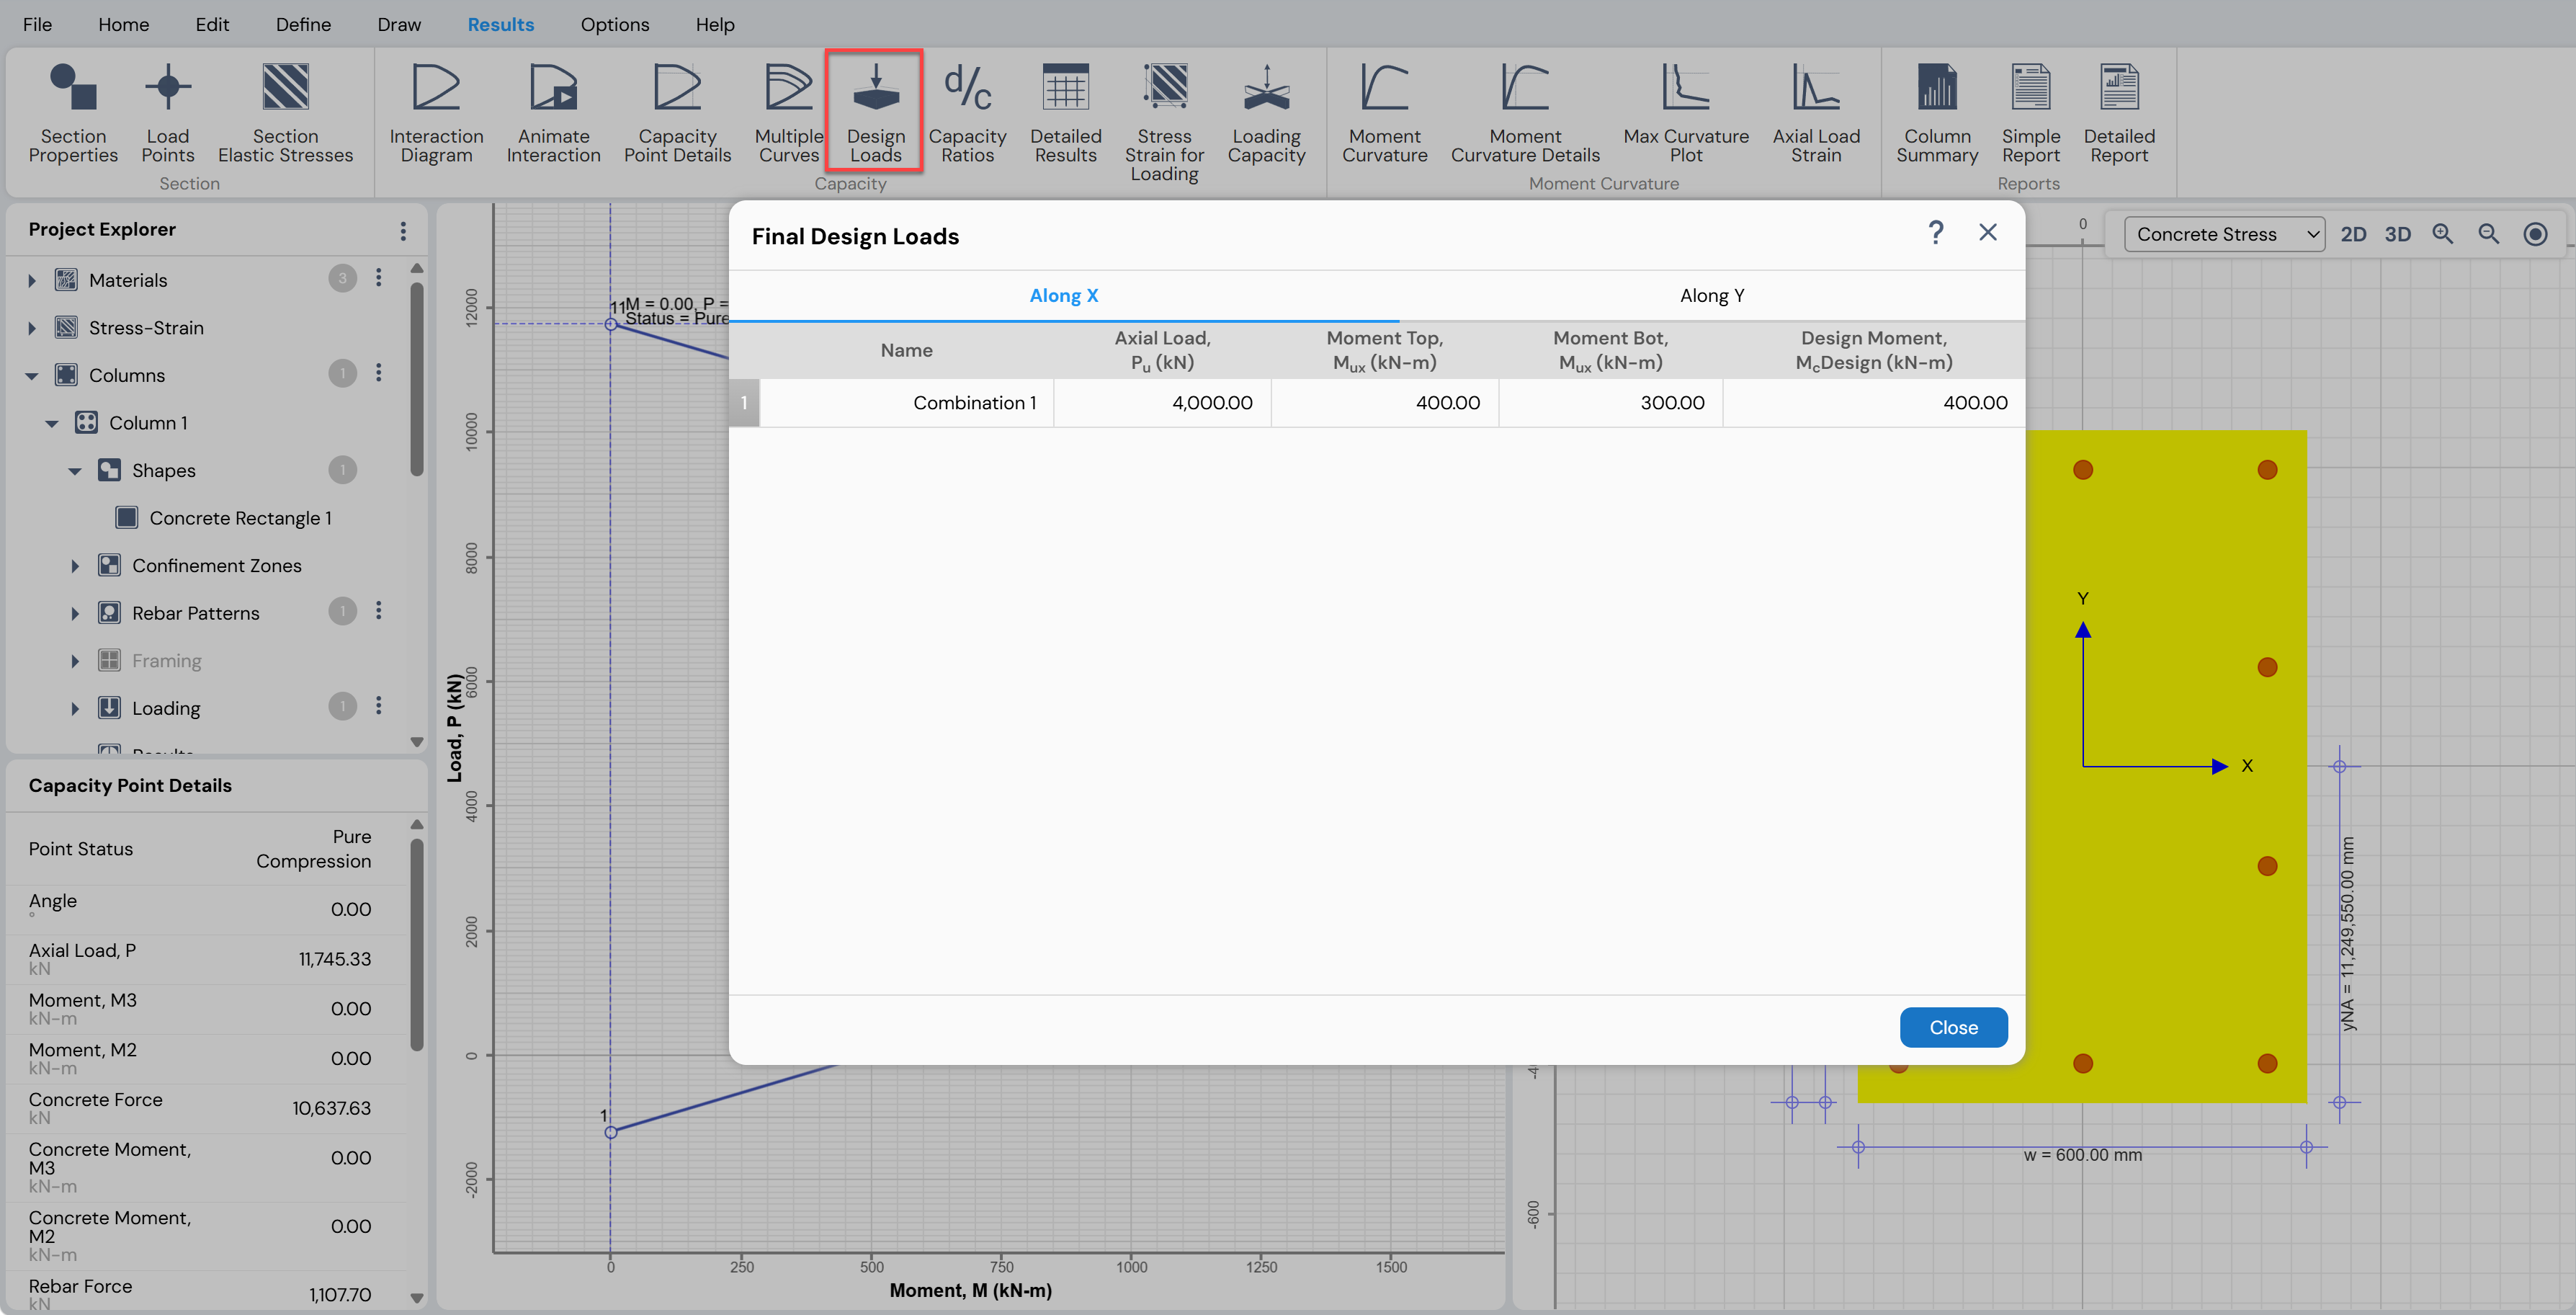
Figure: Final Design Load Combinations
Capacity Ratio Calculation
After a column section has been defined (geometry and material properties), it is checked for adequacy against all specified load combinations based on the capacity ratio.
The capacity ratio is defined as the ratio of the applied actions to the corresponding capacity of the cross-section.
For members with a single governing action (such as beams under bending), capacity ratios are straightforward to define. However, for column sections subjected simultaneously to axial load and biaxial bending, the definition of capacity and capacity ratio is more complex. As a result, multiple capacity ratio formulations can be defined.
Column Designer computes capacity ratios using the following methods.
Moment Sum at P
The Moment Sum at P method defines the capacity ratio as the sum of the individual ratios of applied moments to the corresponding maximum moment capacities about each principal axis for a given axial load .
The moment capacity about each axis is obtained by slicing the capacity interaction surface at the specified axial load to generate an M–M interaction curve.
Figure illustrates the capacity ratio calculation based on the Moment Sum at P method.
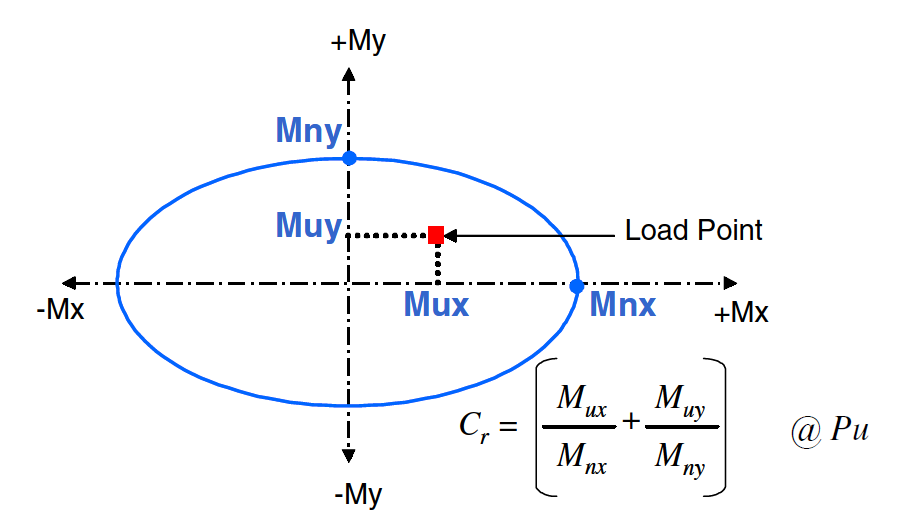
Figure: Capacity Ratio Based on Moment Sum at P
Moment Vector at P
The Moment Vector at P method defines the capacity ratio as the ratio of the length of the applied moment vector to the length of the moment capacity vector at the specified axial load .
As with the previous method, the moment capacity vector is obtained from the M–M interaction curve corresponding to the given axial load.
Figure illustrates the capacity ratio calculation based on the Moment Vector at P method.
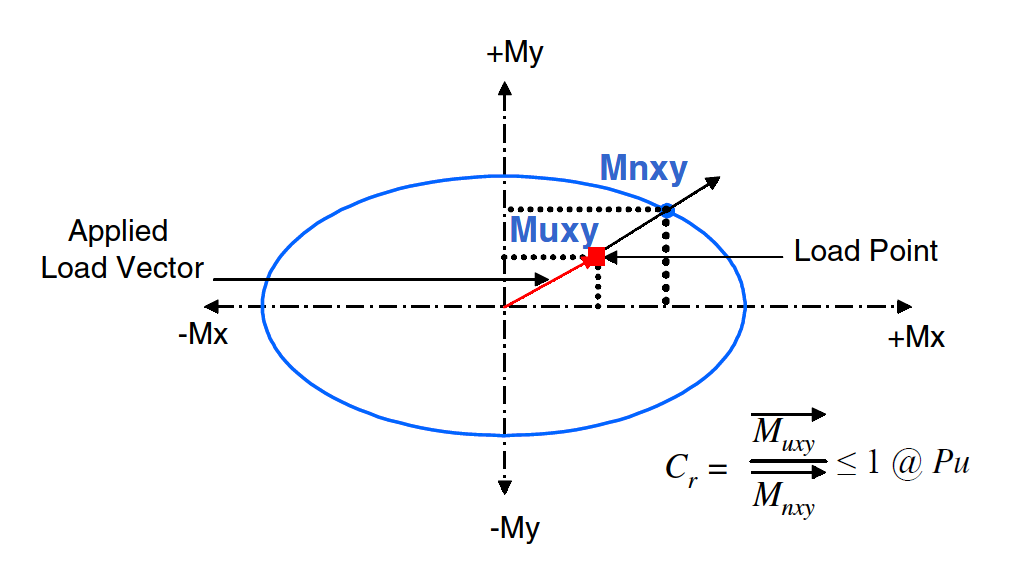
Figure: Capacity Ratio Based on Moment Vector at P
Axial Compression (P)
For pure axial compression, the capacity ratio is defined as the ratio of the applied compressive axial load to the maximum compressive axial load capacity in the absence of bending moments.
\text{Capacity Ratio}_{\text{compression}} = \frac{P_{u}}{\phi P_{n0}}where:
= applied axial load
= design axial compression capacity without bending
Axial Tension (P)
For pure axial tension, the capacity ratio is defined as the ratio of the applied tensile axial load to the maximum tensile axial load capacity in the absence of bending moments.
\text{Capacity Ratio}_{\text{tension}} = \frac{P_{u}}{\phi P_{n0}}P–M Vector Method
The P–M Vector method defines the capacity ratio as the ratio of the length of the applied action vector (combining axial load and bending moments) to the length of the capacity vector in the same direction.
This approach evaluates adequacy directly in the combined axial–moment space.
Figure illustrates the capacity ratio calculation based on the P–M Vector method.
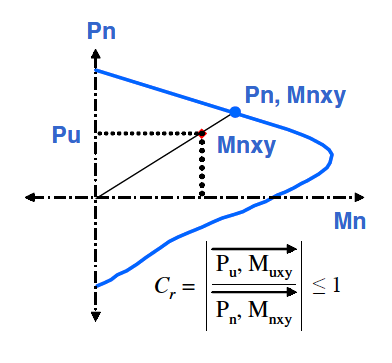
Figure: Capacity Ratio Based on P–M Vector
Capacity Ratios Results
Capacity check results are presented in terms of capacity ratios. The results are reported separately for the top end, bottom end, and for combined effects in both directions of the column.
The Capacity Calculation Results form is shown in Figure.
Displaying Capacity Ratio Results
To view the capacity ratio results, follow the steps below:
Define the column cross-section for which capacity is to be checked.
Click Results Menu → Capacity → Capacity Ratios, or
Project Explorer → Columns → Results → Capacity → Capacity Ratios.
This opens the Capacity Calculation Results form.
Interpreting the Results
The maximum capacity ratios calculated using different methods are displayed in separate tabs for the top and bottom ends of the column section.
For each load combination, the software indicates whether the section is adequate or inadequate.
If the maximum capacity ratio exceeds 1.0, the section is reported as inadequate for the corresponding load combination.
The tabulated results can be:
Exported to an Excel file using the Export button, or
Copied to the clipboard using the Copy button.
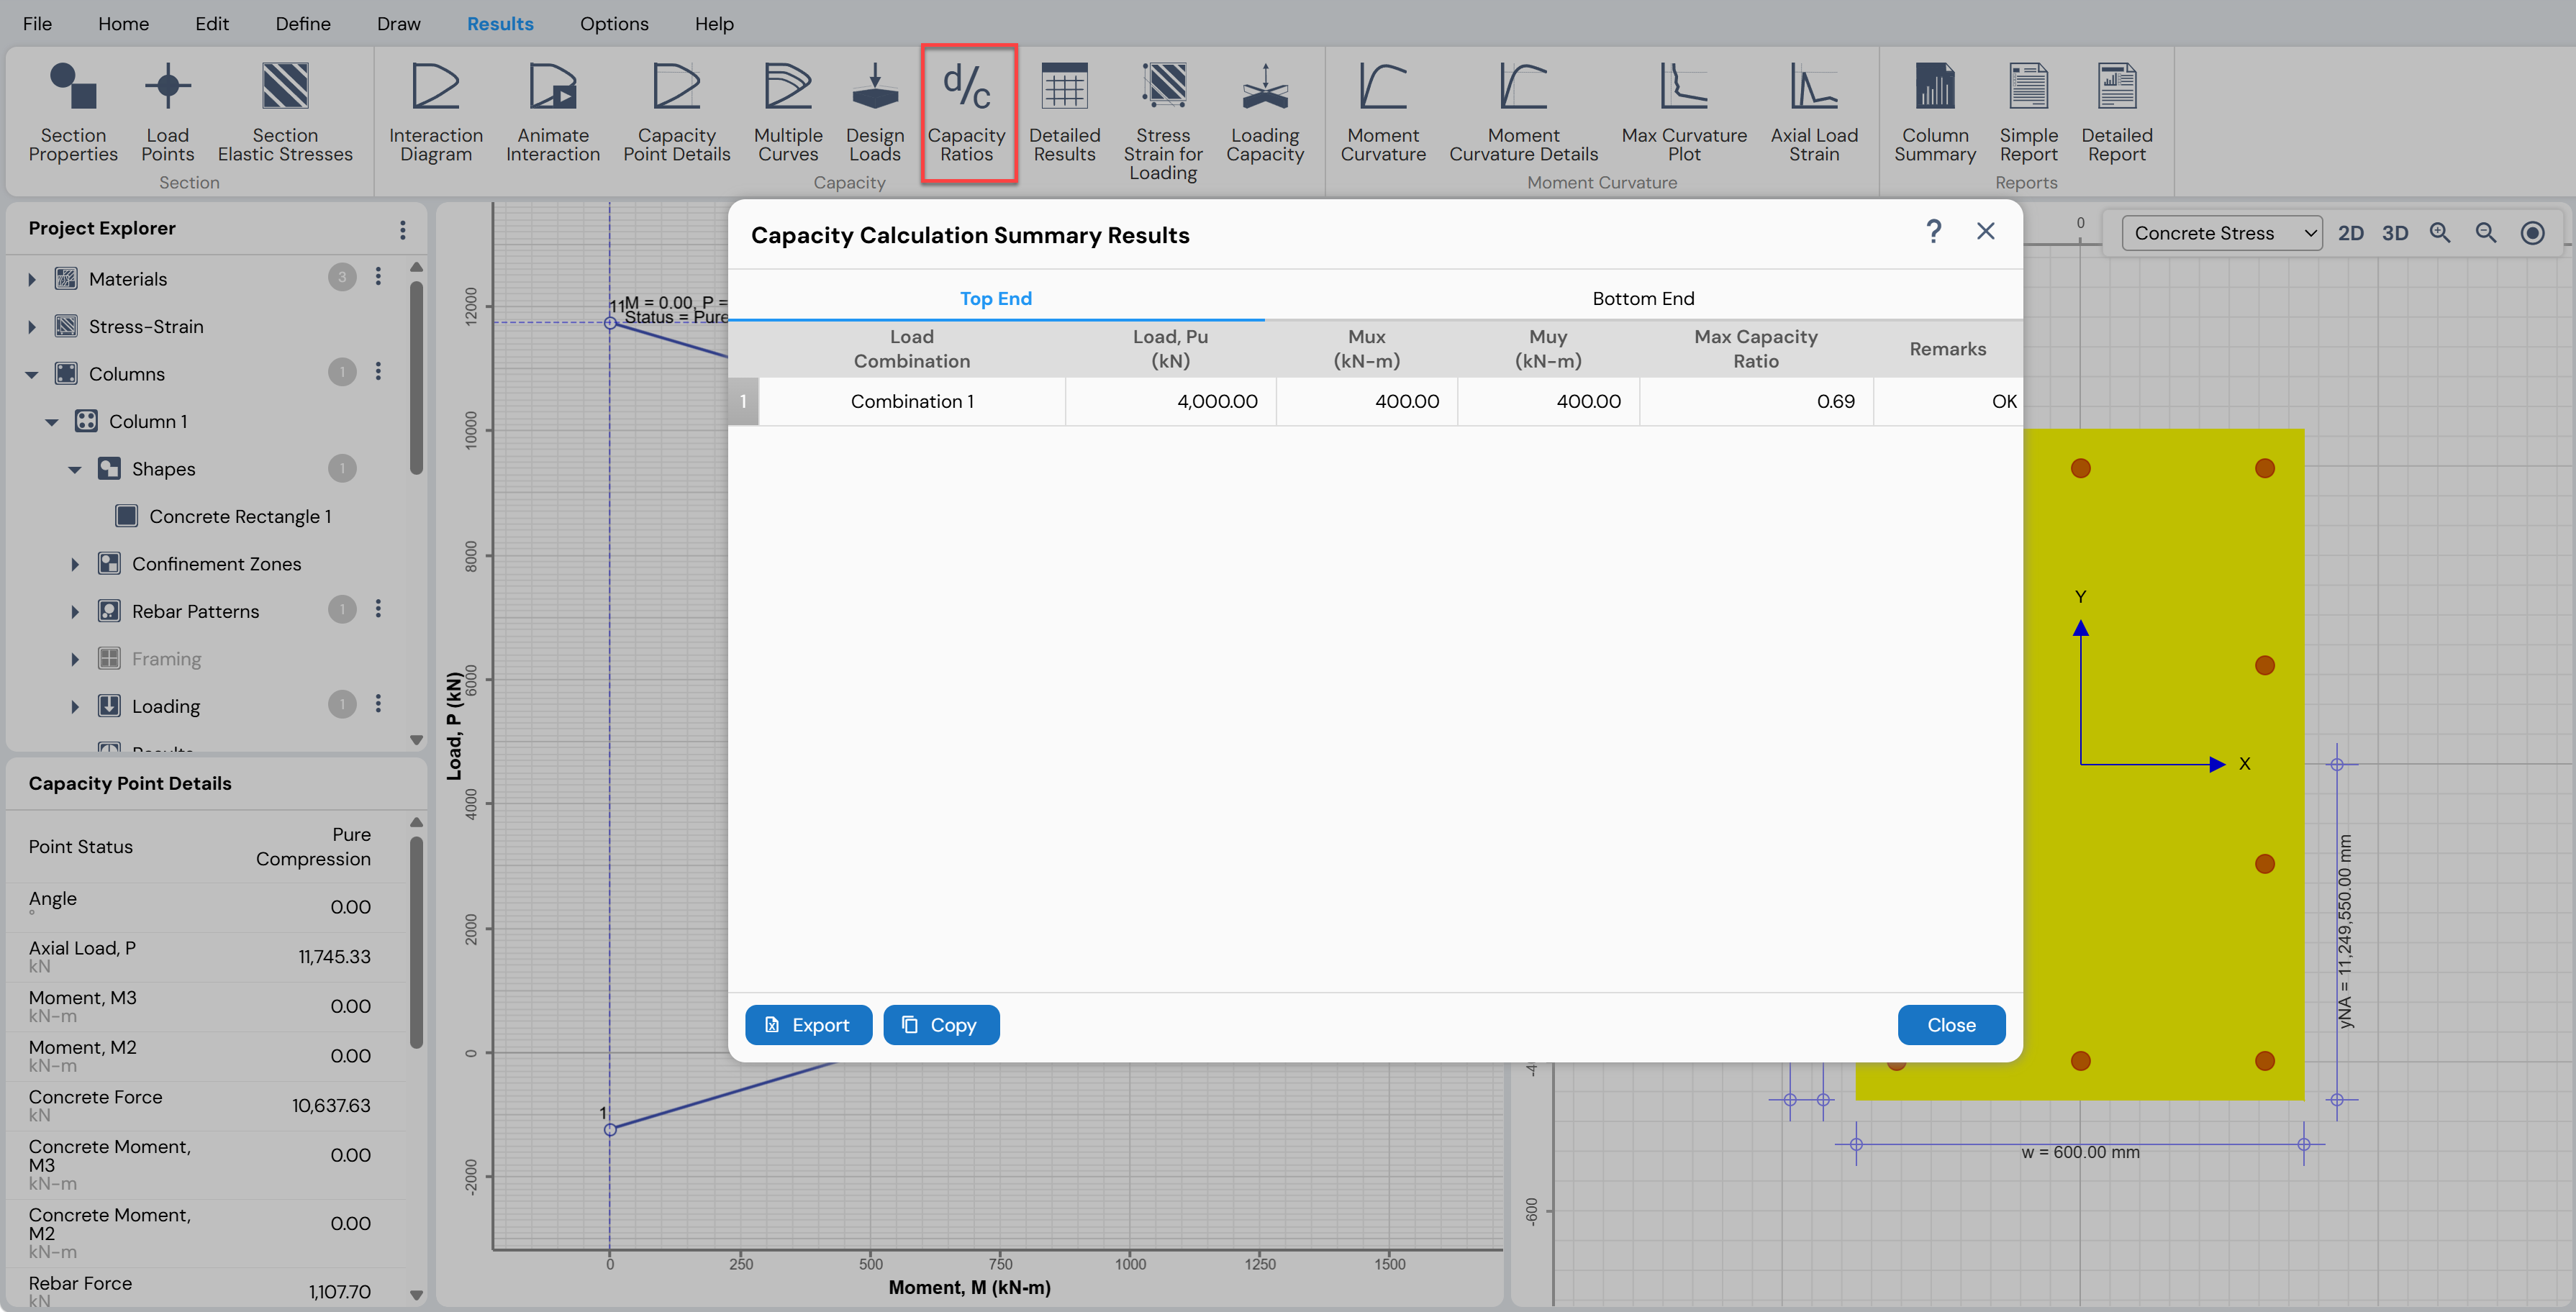
Figure: Capacity Calculation Results Form
Notes
The capacity ratio calculated using the Moment Sum at P method is excluded when determining the governing (maximum) capacity ratio.
Capacity ratios are calculated from the interaction surface with capacity reduction factors included, in accordance with the selected design code.
Detailed Results
The Detailed Results feature provides comprehensive capacity evaluation information for each load combination, in addition to the governing capacity ratios.
To access the detailed results, use one of the following options:
Results Menu → Capacity → Detailed Results, or
Project Explorer → Columns → Results → Capacity → Detailed Results
This opens the Detailed Capacity Calculation Results form, shown in Figure.
Detailed Capacity Calculation Results
The Detailed Capacity Calculation Results form displays the following additional information for each load combination:
Resultant bending moment
Resultant moment angle
Neutral axis angle
Neutral axis depth
Capacity ratios calculated using all available methods
The tabulated results can be:
Exported to an Excel file using the Export button, or
Copied to the clipboard using the Copy button
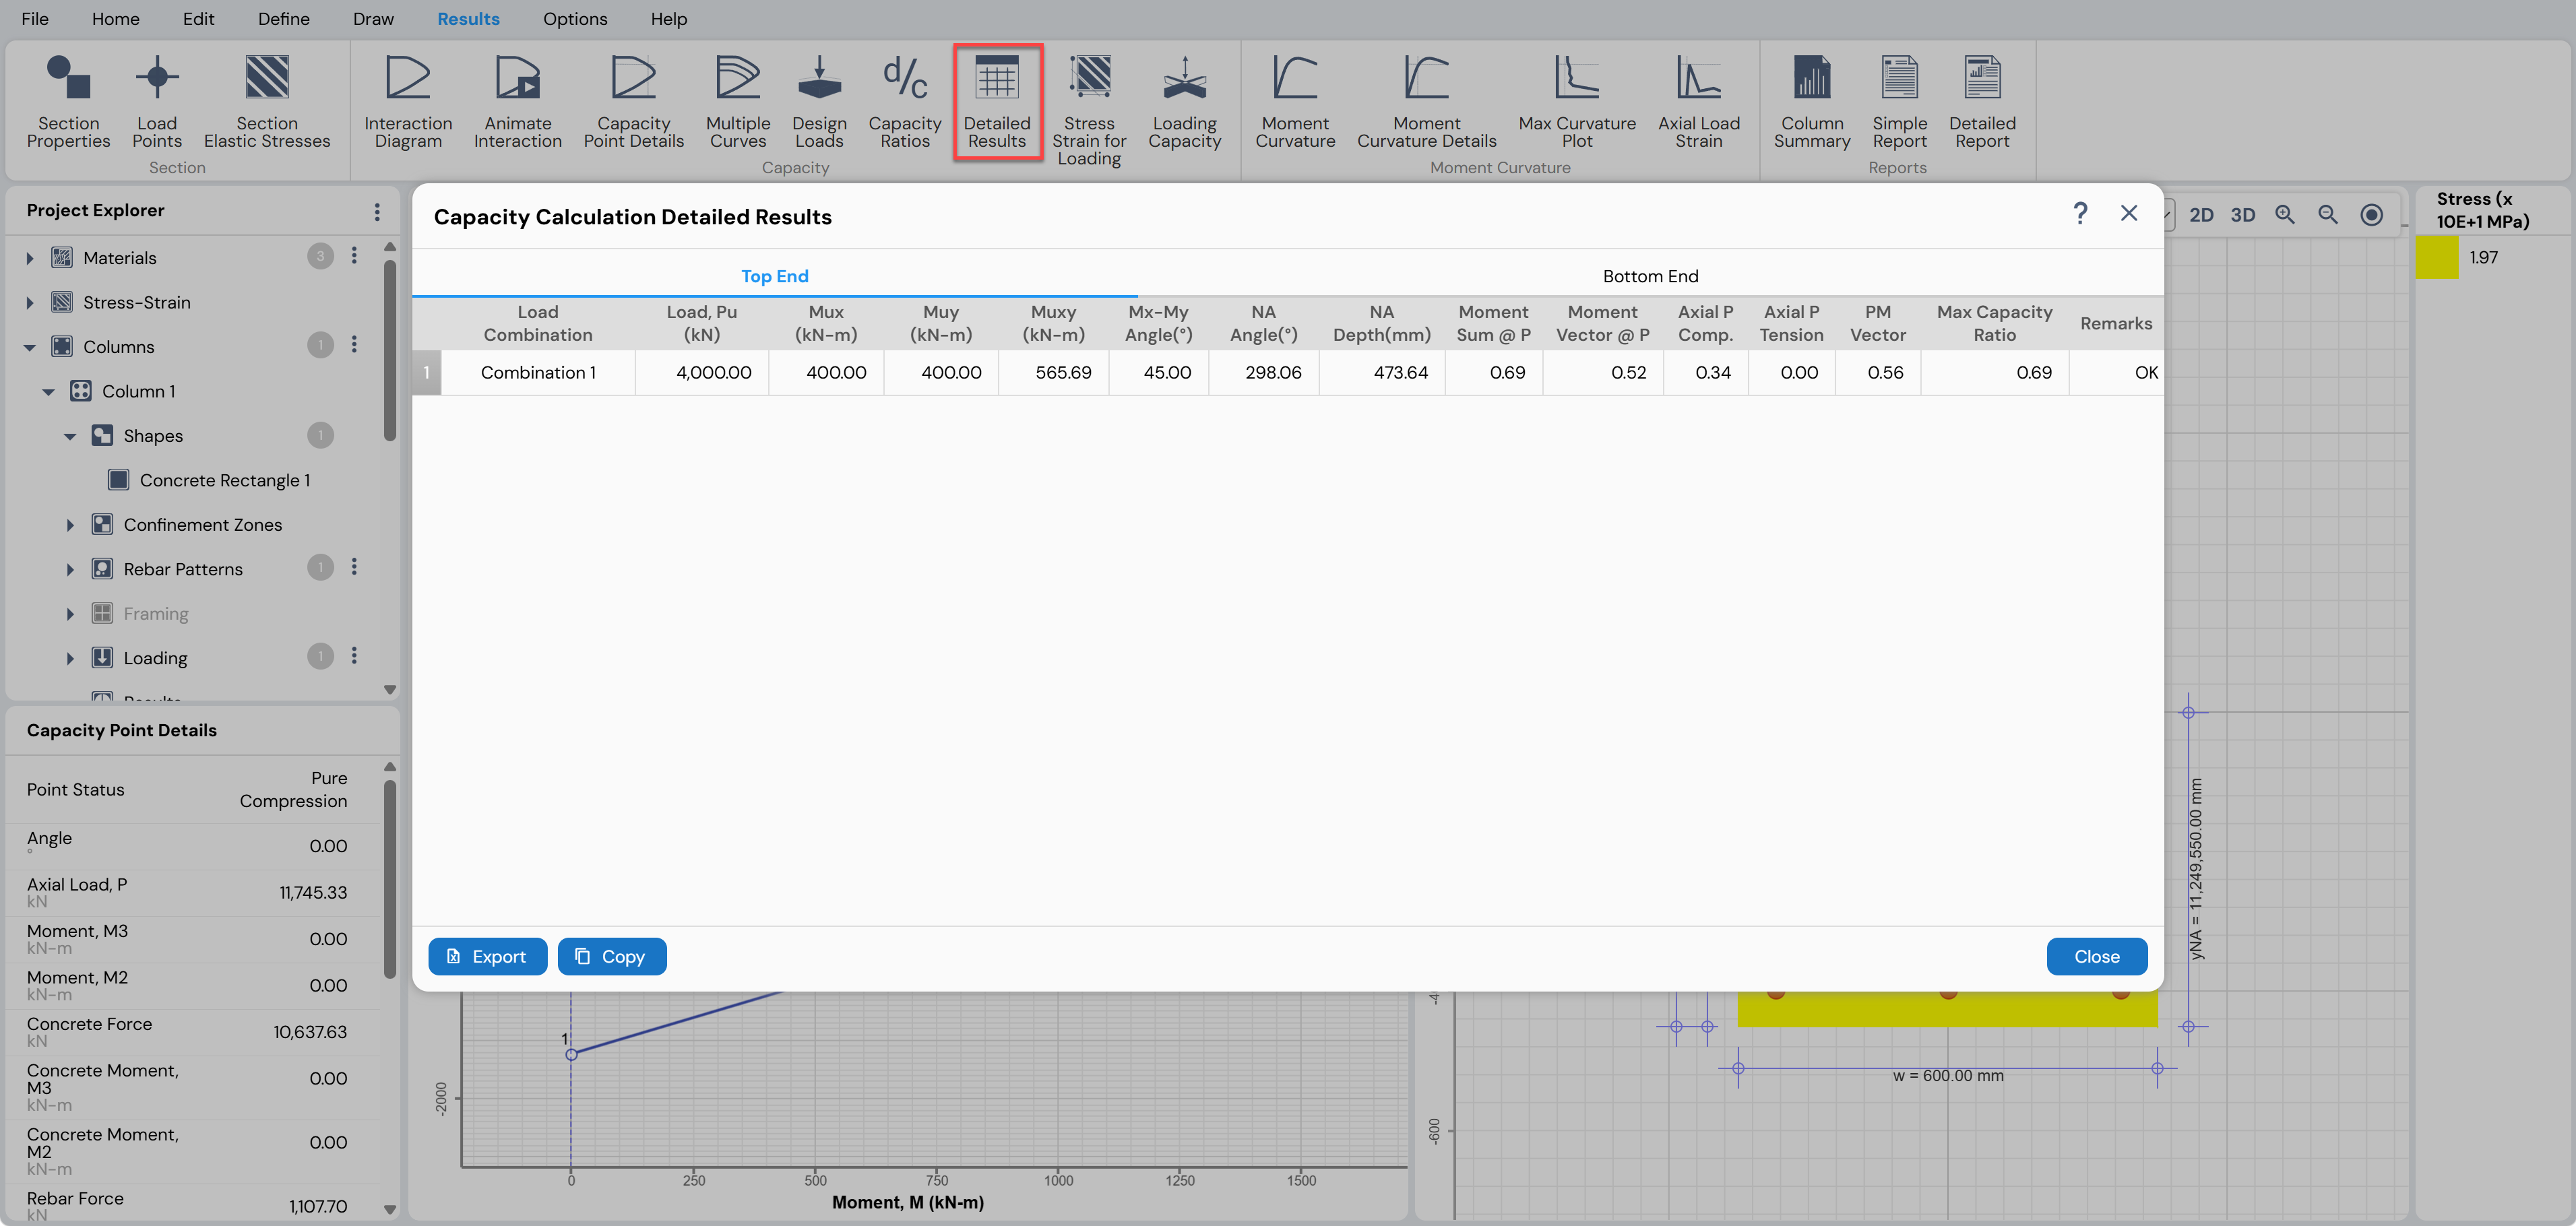
Figure: Detailed Capacity Calculation Results Form
Notes
If the specified axial load exceeds the maximum axial load capacity, the capacity ratios computed using the Moment Sum at P and Moment Vector at P methods display very large values (typically 200 and 100, respectively), indicating that the section is inadequate.
Capacity ratios are calculated from the interaction surface with capacity reduction factors included, in accordance with the selected design code.
The neutral axis depth is calculated for the nominal moment corresponding to the factored axial force on the relevant P–M interaction curve, based on the direction of bending.
Stress–Strain for Loading
The Stress–Strain for Loading feature allows the user to view the stress and strain contours in concrete and reinforcement, along with the orientation and location of the neutral axis, for a selected load combination.
To access this feature, use one of the following options:
Results Menu → Capacity → Stress Strain for Loading, or
Project Explorer → Columns → Results → Capacity → Stress Strain for Loading
Display Options
Once activated, the stress–strain contours are displayed in the working area. The associated toolbar provides the following options:
Load Combination drop-down list

Select the desired load combination for which the stress–strain state is to be displayed.2D button
Displays the stress/strain contours in 2D view.3D button
Displays the stress/strain contours in 3D view.Type of Contour drop-down list
Select the type of contour to display. The available options are:Concrete stress
Bar stress
Concrete strain
Bar strain
Notes
When the axial load is non-zero, the stress–strain state for loading is determined based on the eccentricity angles.
When the axial load is zero, the stress–strain state for loading is determined based on the moment angles.
If the selected load combination lies outside the interaction surface (i.e., the applied demand exceeds the section capacity), the Stress–Strain for Loading may not be computed.
The neutral axis depth is calculated for the factored axial force and factored moment using the moment–curvature curve corresponding to the resultant moment angle.
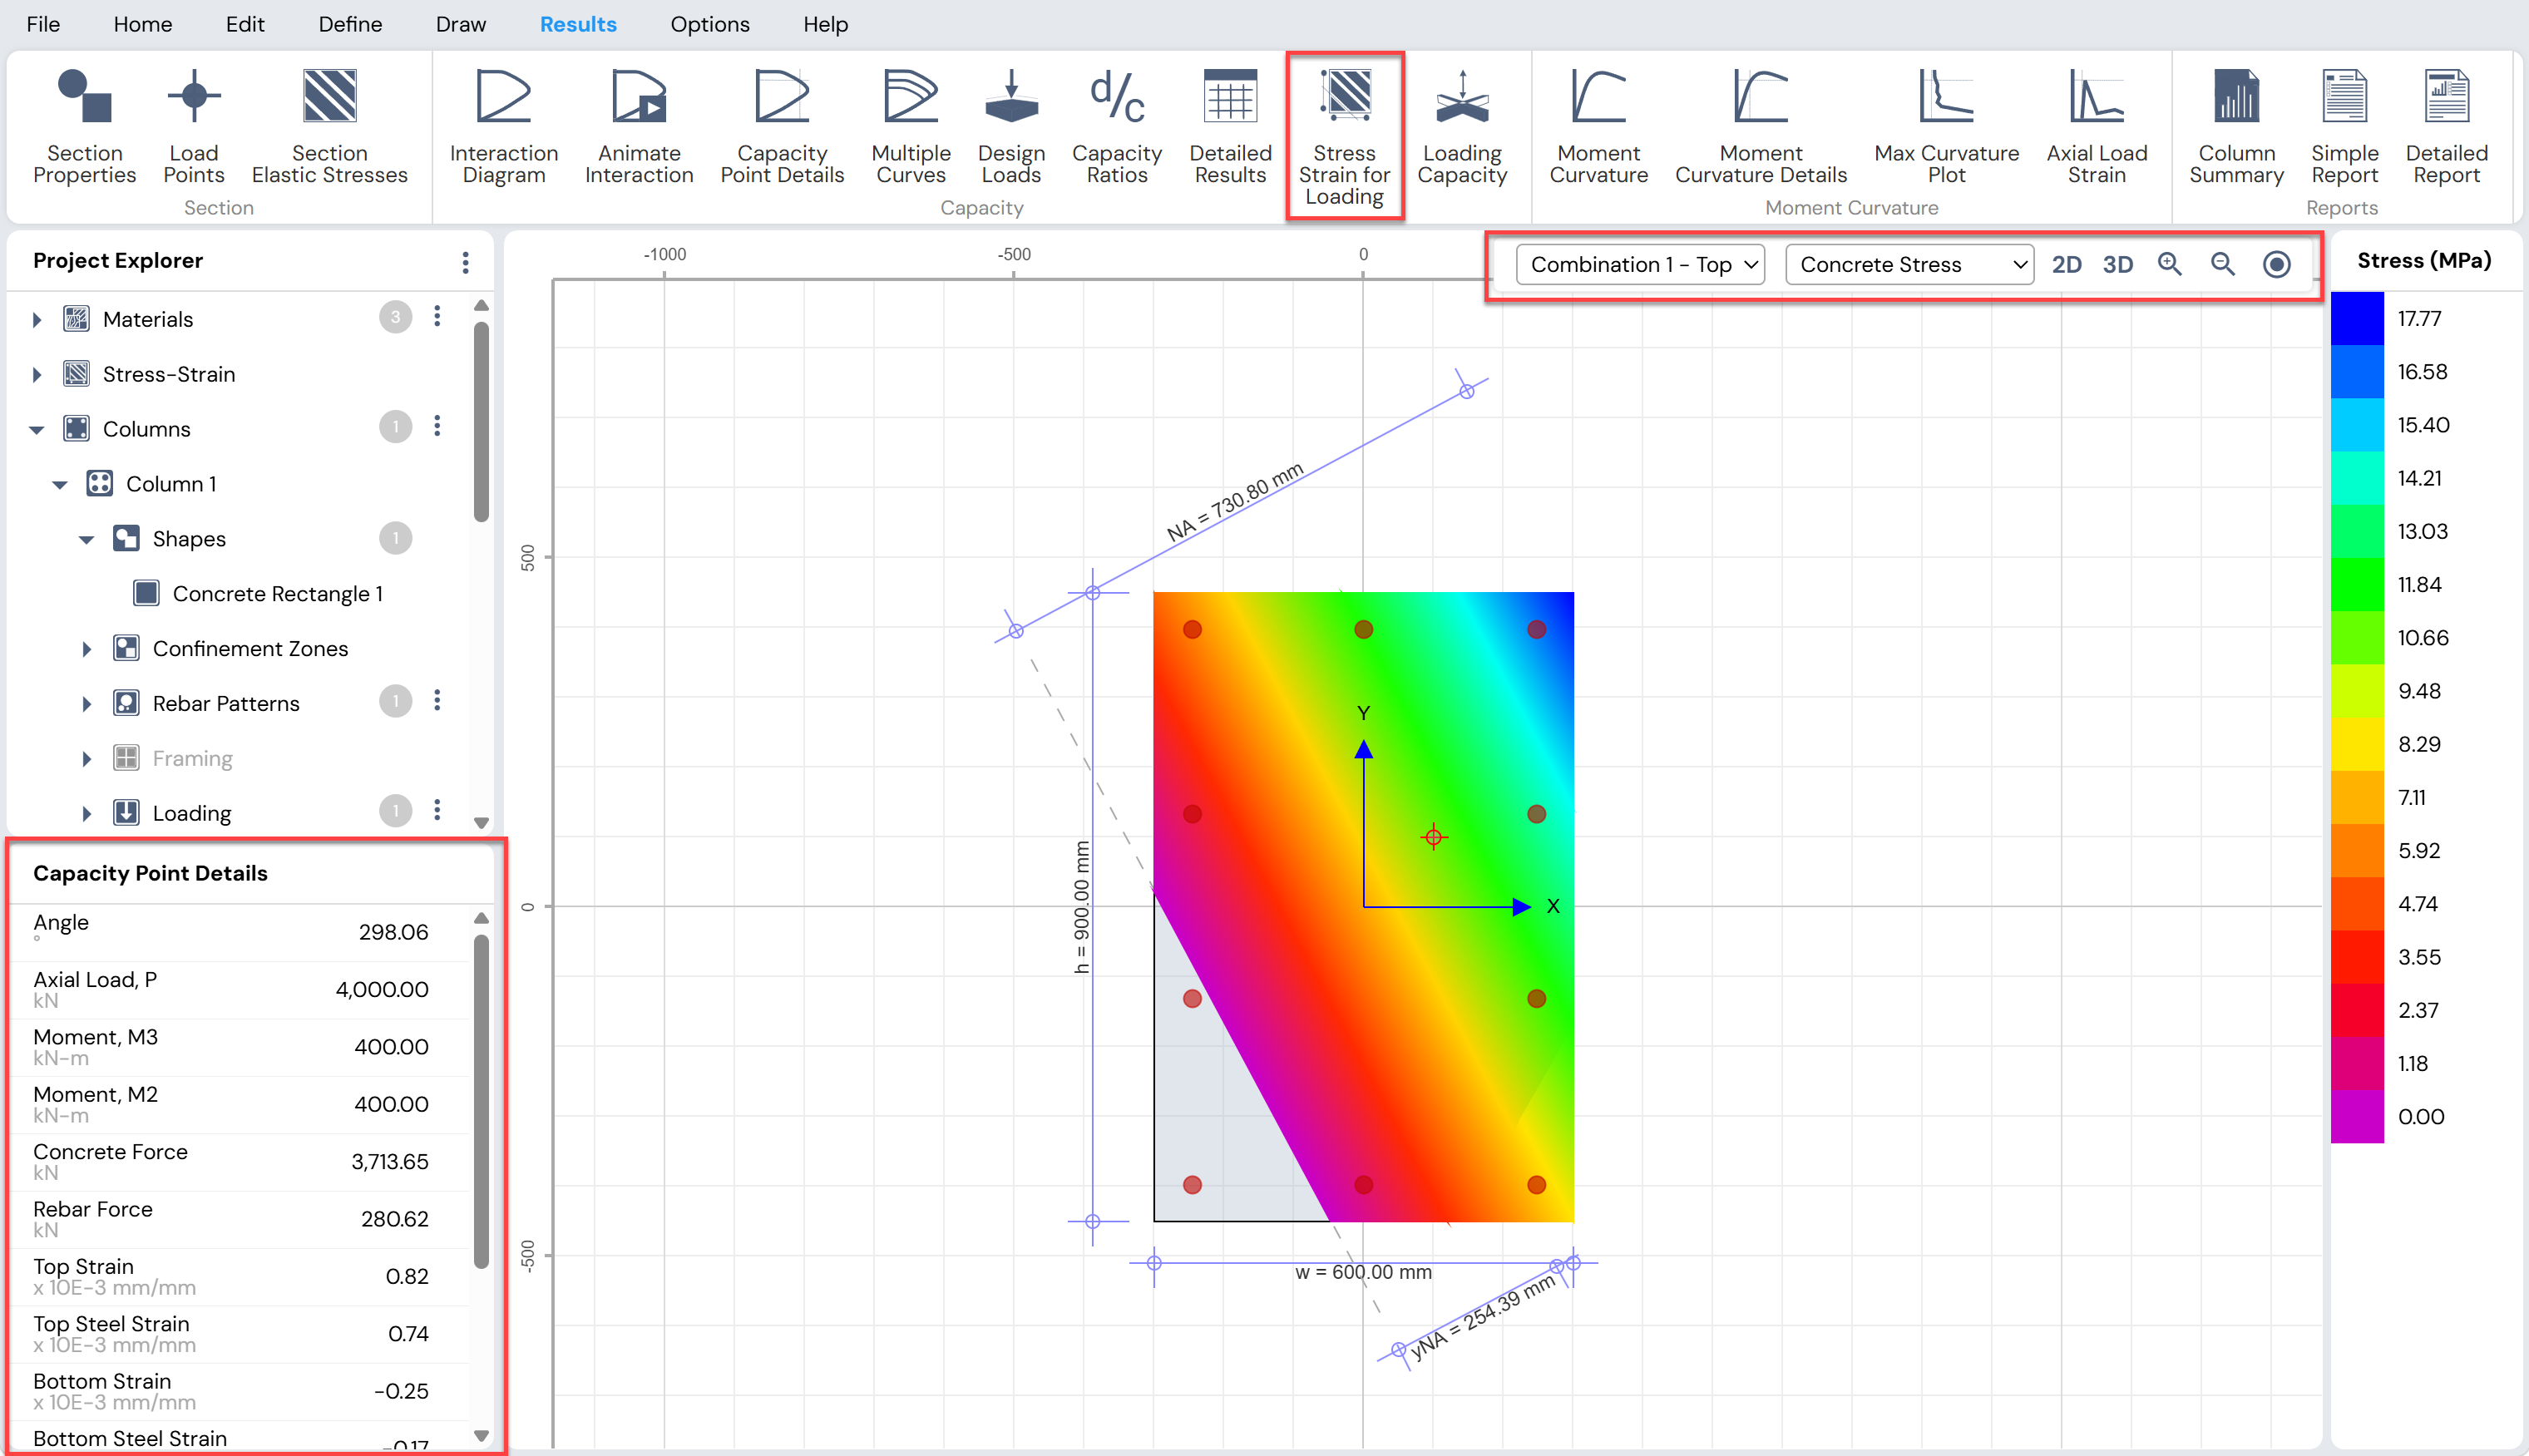
Figure: Stress-strain contours for Given Loading
Loading Capacity
The Loading Capacity feature provides a visual comparison between the applied loading and the section capacity for a selected column. The results can be viewed in both 2D and 3D, allowing users to clearly assess whether the applied loads lie within the capacity envelope of the section.
To access this feature, use one of the following options:
Results Menu → Capacity → Loading Capacity, or
Project Explorer → Columns → Results → Capacity → Loading Capacity
Display Options
When the Loading Capacity view is activated, the following toolbar options are available:
Load Combination Drop-Down List

Select the load combination for which the loading and capacity are to be displayed.Show Loading / Capacity Drop-Down List

Choose the desired display option:Loading – Displays only the applied load vector
Capacity – Displays only the section capacity envelope
Loading and Capacity – Displays both the applied loading and the capacity together for direct comparison
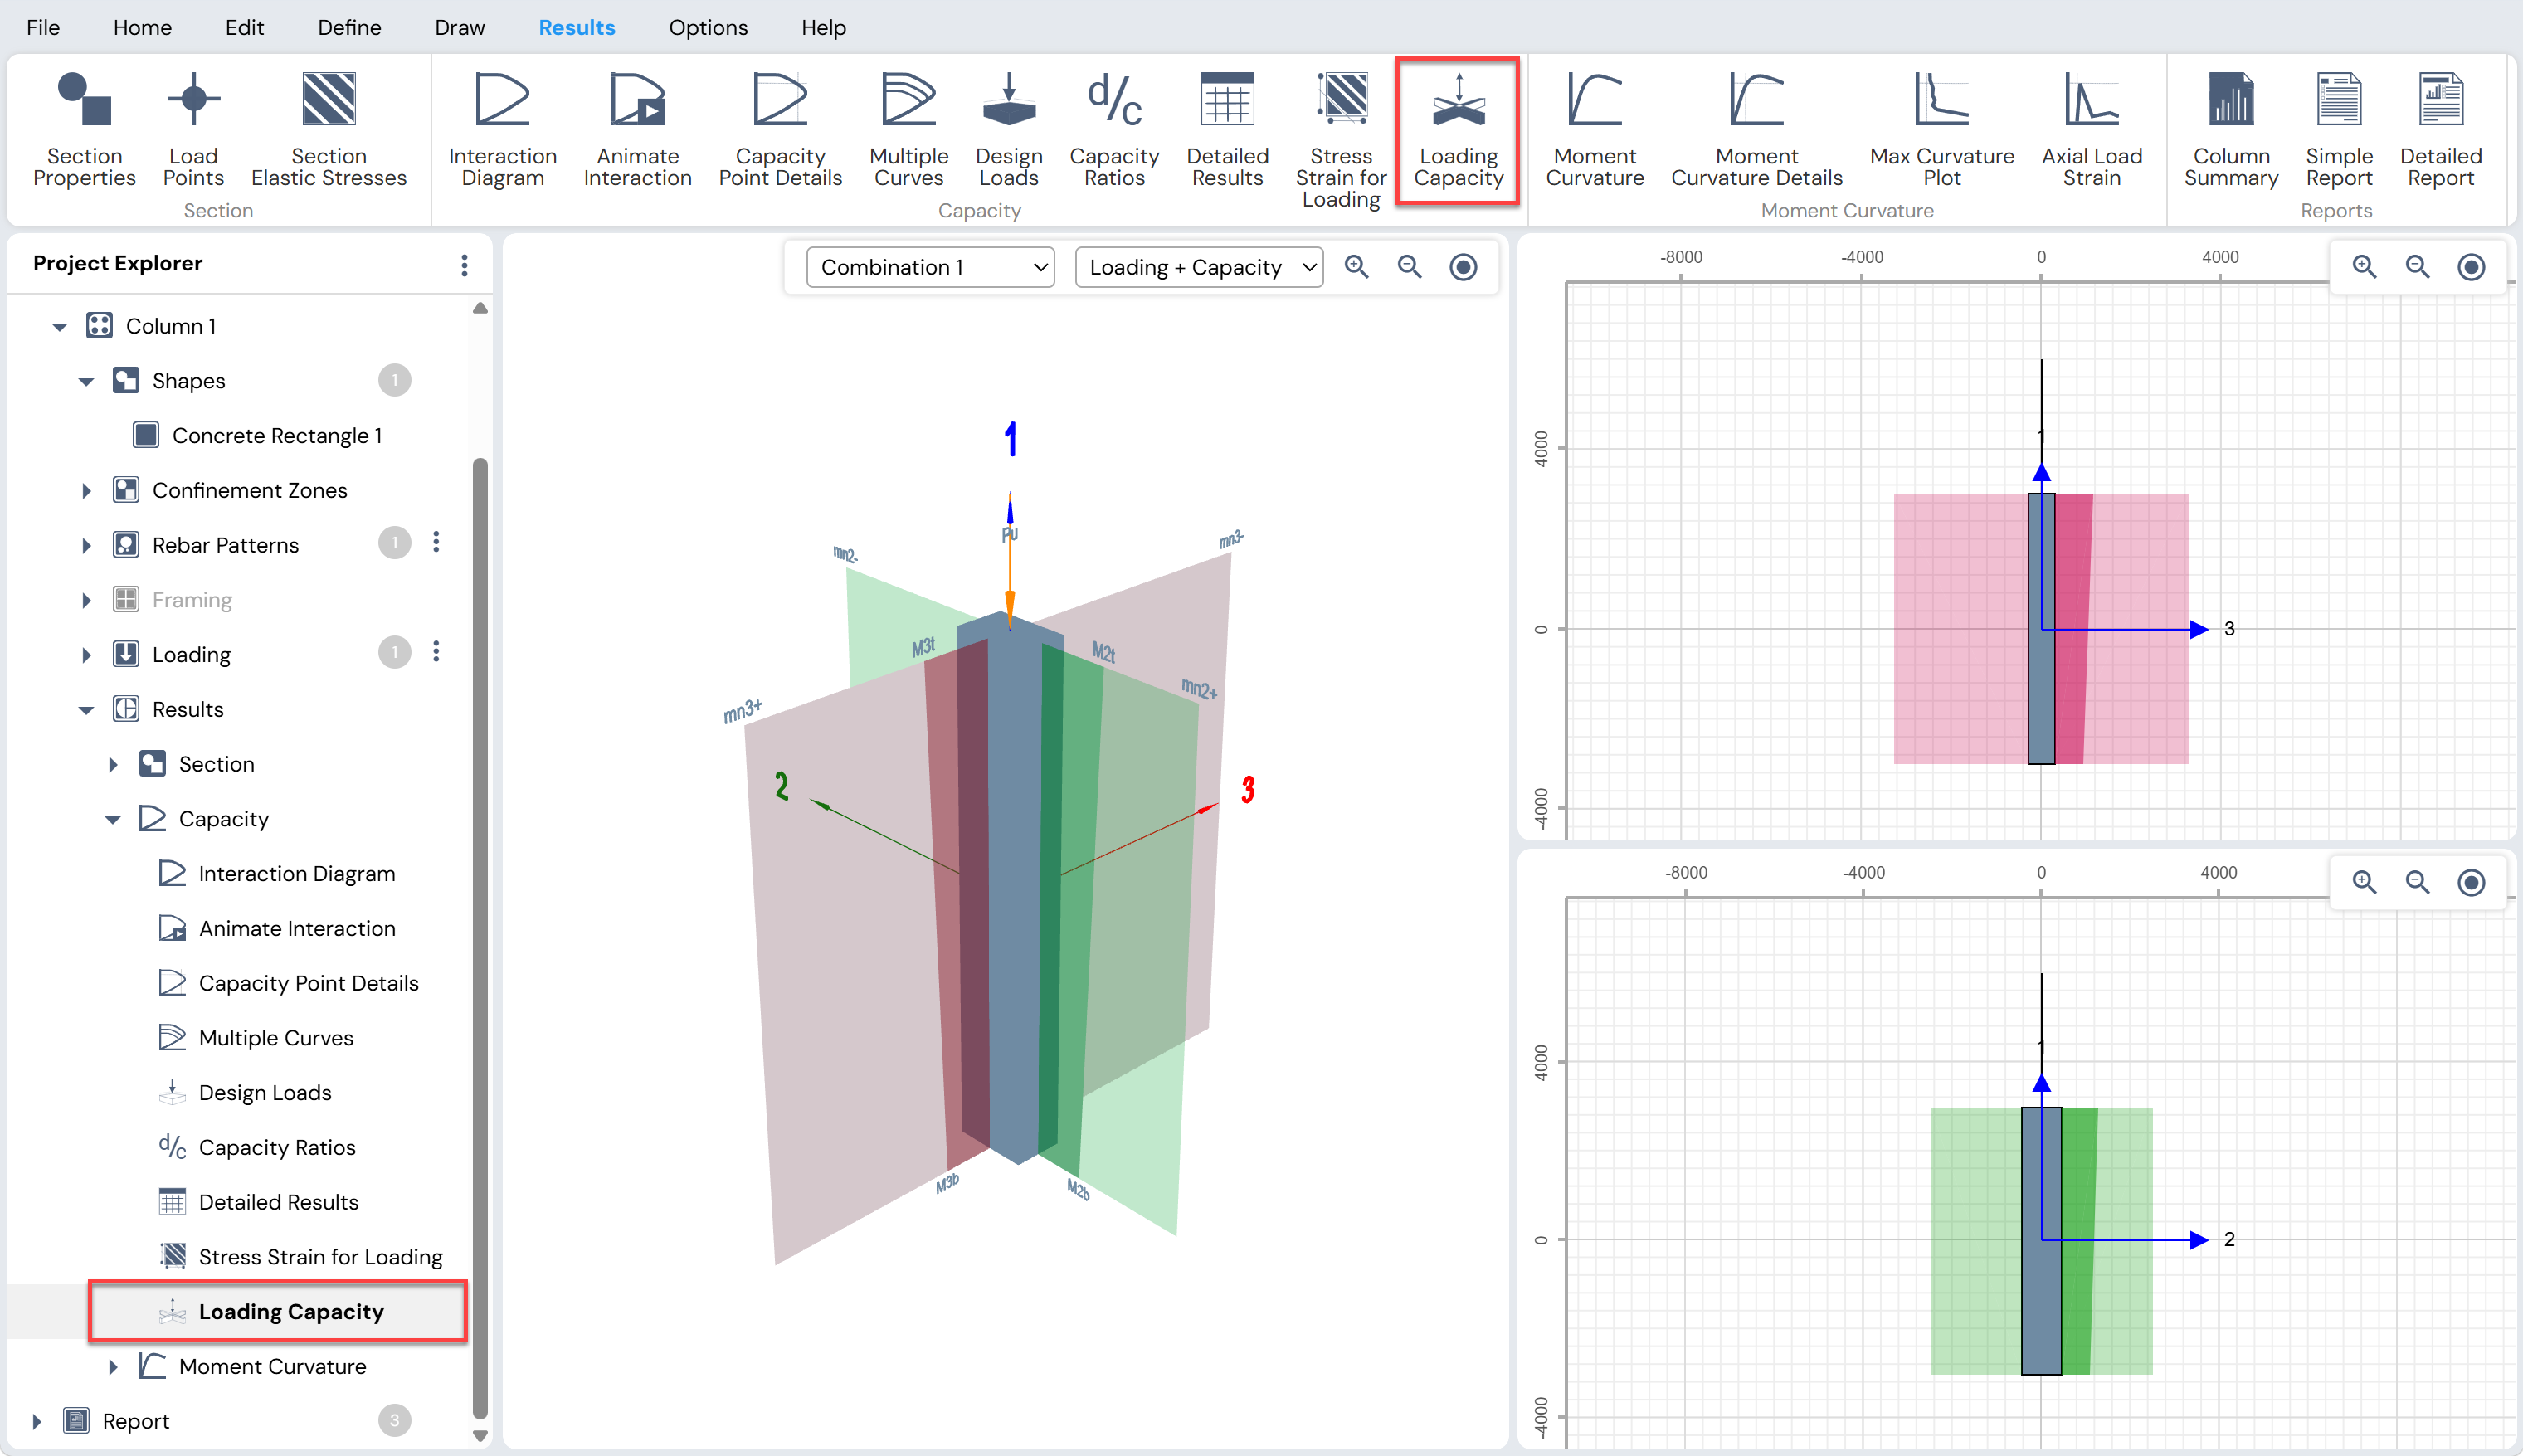
Figure: Viewing Loading Capacity Feature
Moment Curvature
The moment–curvature diagram is a graphical representation of the relationship between the moment resistance of a cross-section and its curvature. A moment–curvature diagram is derived from stress resultants and is independent of member geometry or bending moment distribution. For a specified axial load, it represents a fundamental property of the cross-section.
The moment–curvature relationship is a critical input for:
Nonlinear static analysis
Nonlinear dynamic analysis
Evaluation of post-elastic behavior
Determination of plastic hinge rotational capacity under high seismic demand
This relationship also forms the basis of capacity-based and performance-based design methodologies.
Displaying the Moment–Curvature Diagram
Column Designer allows users to generate and display moment–curvature curves for a column section.
To access this feature:
Click Results Menu → Results → Moment Curvature → Moment Curvature, or
Use Project Explorer → Columns → Results → Moment Curvature → Moment Curvature
Once activated, the Moment Curvature Diagram is displayed in the working area.
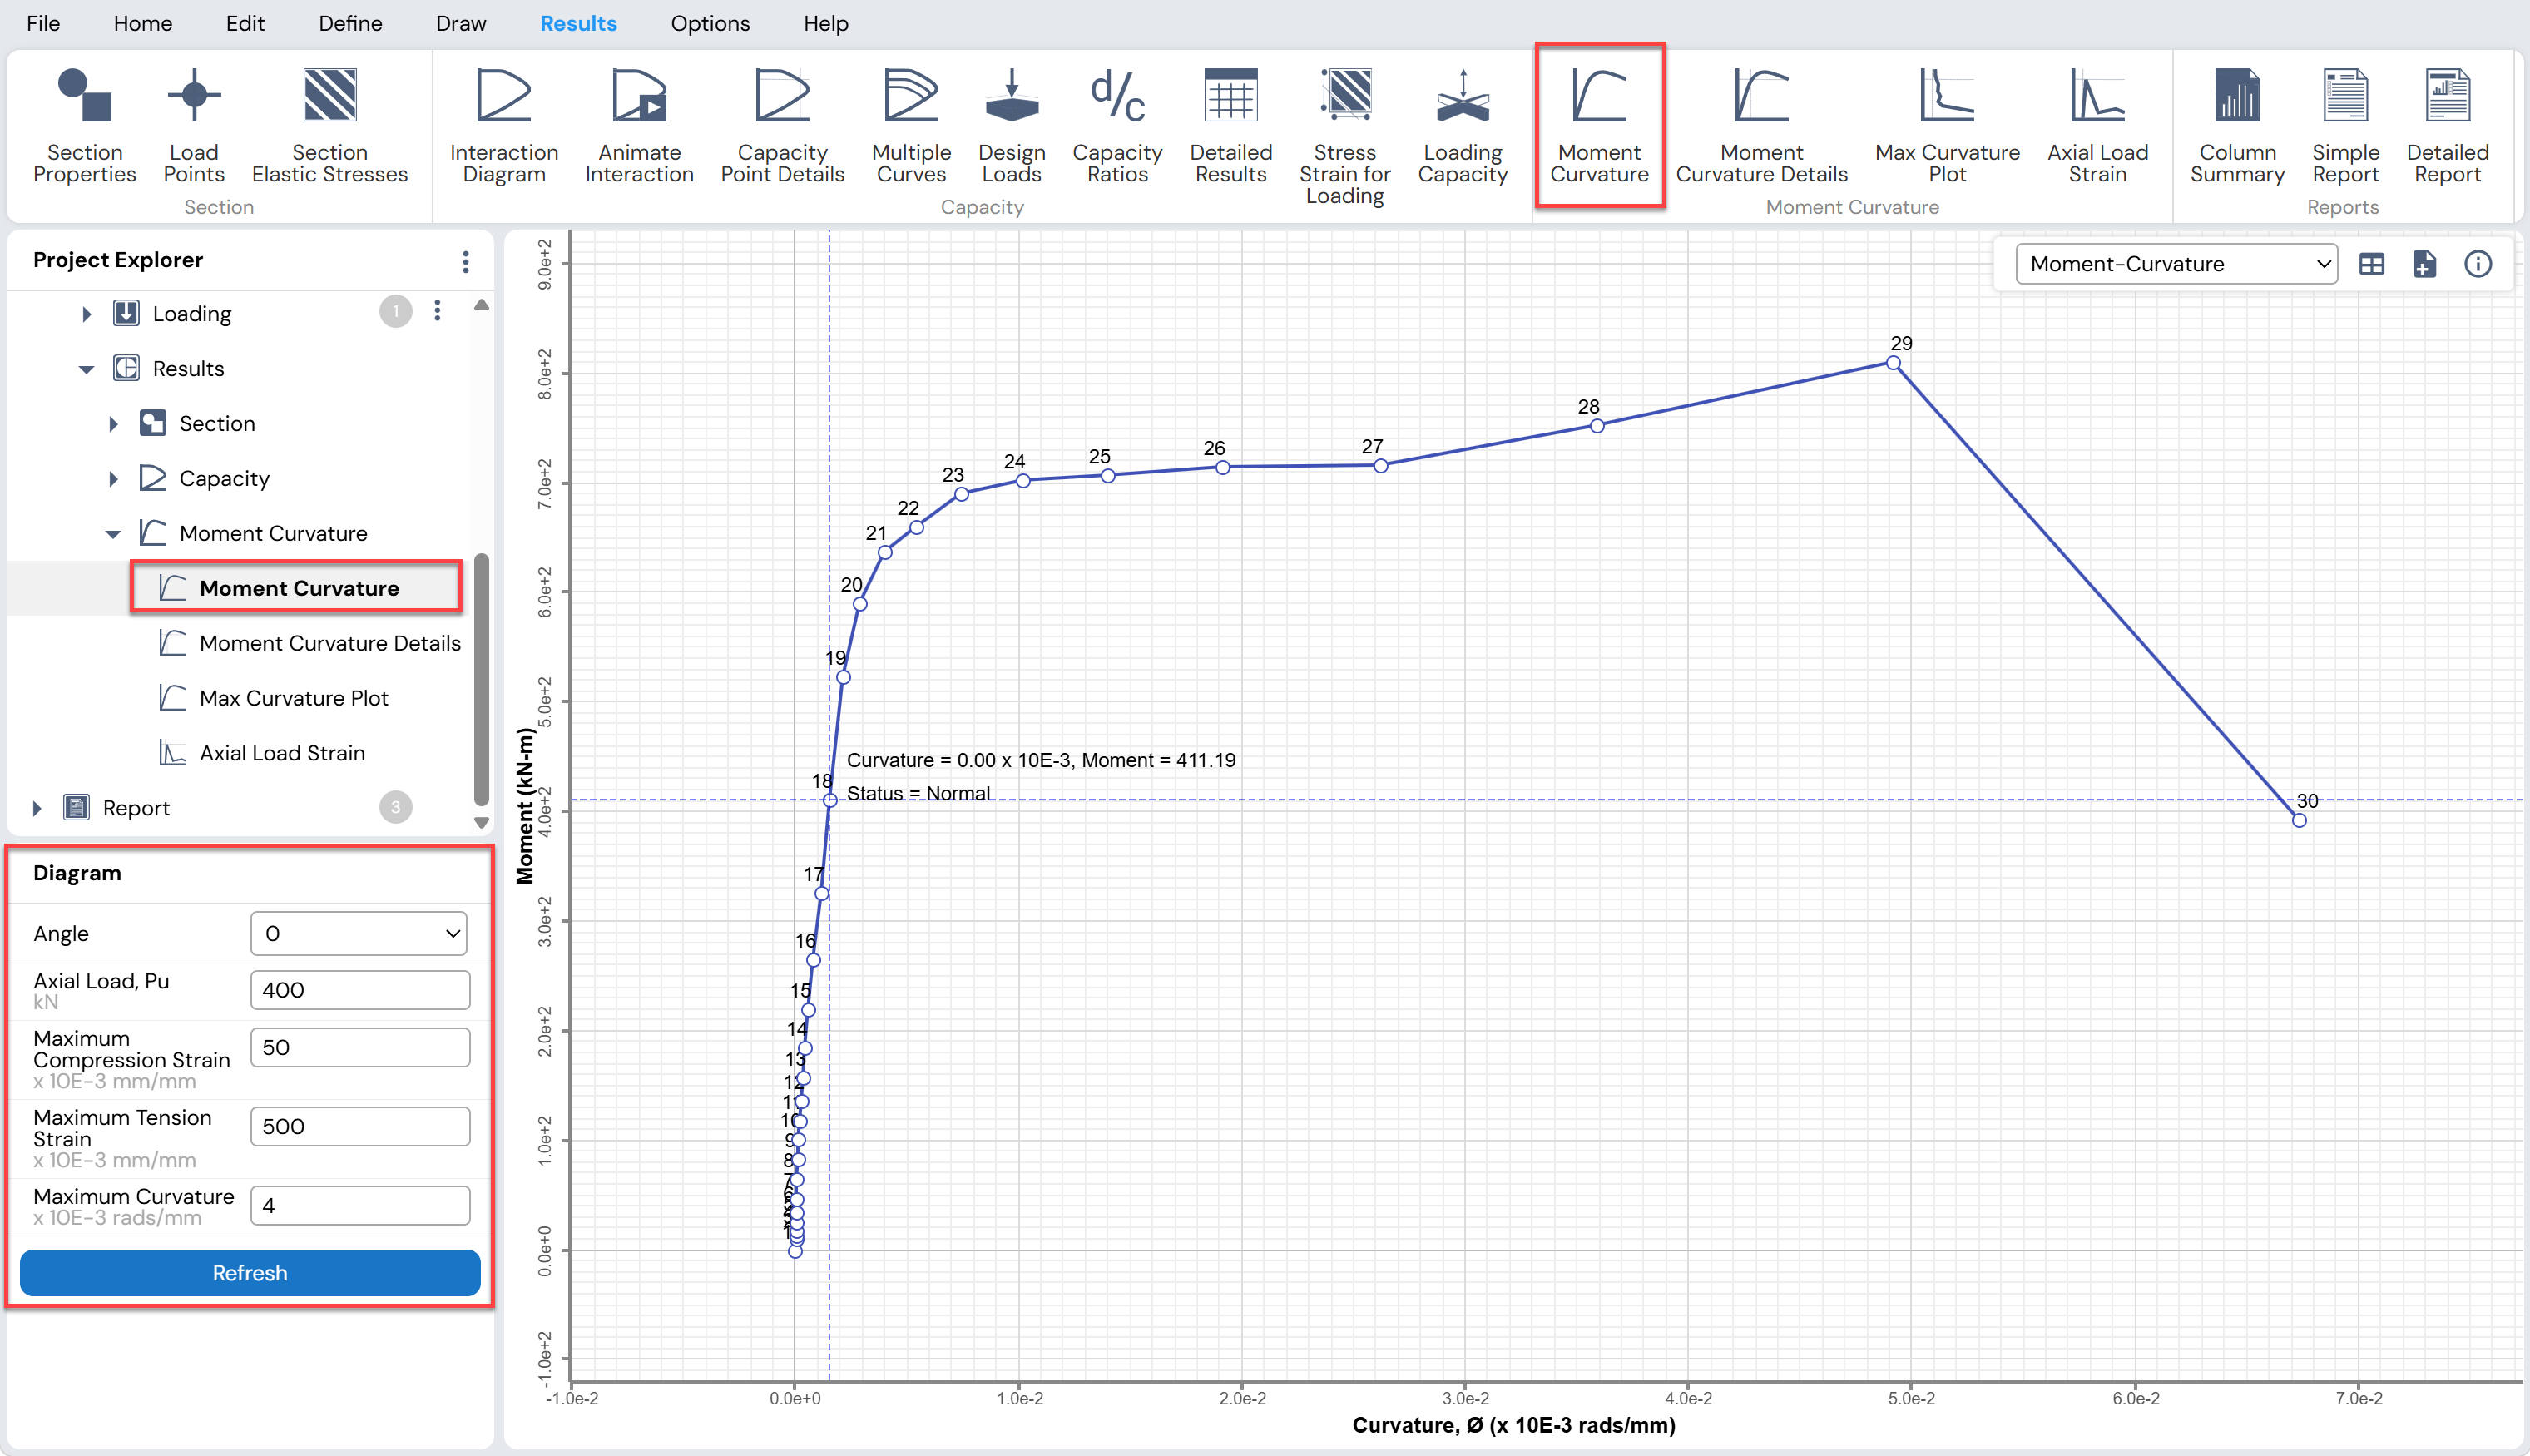
Figure: Moment Curvature Diagram
Diagram Settings
Activating the Moment Curvature command opens the Diagram Grid in the context-sensitive area. This grid allows the user to control the parameters used for generating the diagram, including:
Neutral axis angle
Axial load
Maximum compression strain
Maximum tension strain
Maximum curvature
Number of curve points
After modifying the desired parameters, click the Refresh button to update the diagram.
Toolbar Options
The Moment Curvature toolbar provides the following options:
Curve Type Drop-Down List
Select the type of curve to be displayed. Available options include:
Moment vs Curvature
Compressive Steel Force vs Curvature
Concrete Force vs Curvature
Maximum Steel Strain vs Curvature
Maximum Concrete Strain vs Curvature
Neutral Axis vs Curvature
Sign Convention Option
For the following curve types:
Compressive Steel Force vs Curvature
Concrete Force vs Curvature
Maximum Steel Strain vs Curvature
Maximum Concrete Strain vs Curvature
an additional toolbar option is available to modify the sign convention.
- Change Sign Convention Button
Click the +ve or −ve button to treat compression as positive or negative, respectively.
Note: Column Designer considers compression as positive by default; this option is provided for user preference in plotting moment–curvature diagrams.
Neutral Axis Reference Option
For the Neutral Axis vs Curvature diagram, an additional toolbar option allows selection of the reference point for neutral axis depth:
Neutral Axis Depth Button

YNA: Measures neutral axis depth from the centroid of the section
NA: Measures neutral axis depth from the top of the section
Output and Reporting Tools
Tabulated Output Button
Displays the numerical data corresponding to the currently displayed curve. The data can be:Exported to Excel using the Export button
Copied to the clipboard using the Copy button
Add to Report Button
Adds the moment–curvature diagram to the detailed report.Curve Details Button
Opens the Curve Details form, which displays key parameters such as:Cross-section angle
Axial load capacity
Initial stiffness
Ductility ratio
Note
Moment–curvature curves are primarily intended for:
Reinforced concrete sections, and
Composite sections (concrete sections with embedded steel)
Moment Curvature Details
Use the Results Menu → Moment Curvature → Moment Curvature Details button or
Project Explorer → Columns → Results → Moment Curvature → Moment Curvature Details
to view detailed moment–curvature information at multiple points along the curve.
Overview
The working area is divided into two sections with associated toolbars:
Left Section – Moment Curvature Curve
Right Section – Stress/Strain Contour
As the cursor is moved along points on the moment–curvature curve, the following information is displayed in the context-sensitive grid:
Point status
Force components
Moment and curvature values
Strain values
Neutral axis depth
Stiffness values
Simultaneously, the neutral axis location and corresponding stress/strain contours are displayed in the stress/strain contour section.
Moment Curvature Toolbar Options
Curve Type Drop-Down List 
Use this drop-down list to select the type of curve to be displayed. Available options include:
Moment vs Curvature
Compressive Steel Force vs Curvature
Concrete Force vs Curvature
Maximum Steel Strain vs Curvature
Maximum Concrete Strain vs Curvature
Neutral Axis vs Curvature
Sign Convention Option
For the following curve types:
Compressive Steel Force vs Curvature
Concrete Force vs Curvature
Maximum Steel Strain vs Curvature
Maximum Concrete Strain vs Curvature
an additional toolbar option is available to change the sign convention.
- Change Sign Convention Button
Click the +ve or −ve button to treat compression as positive or negative, respectively.
Note: Column Designer considers compression as positive by default. This option is provided to allow flexibility in graphical interpretation.
Neutral Axis Reference Option
For the Neutral Axis vs Curvature diagram, an additional toolbar option allows the reference point for neutral axis depth to be selected:
Neutral Axis Depth Button
YNA: Neutral axis depth measured from the centroid of the section
NA: Neutral axis depth measured from the top of the section
Axial Load and Neutral Axis Controls
Value of Pu Edit Box
Displays the axial load level for the currently displayed curve.
Enter the desired axial load (Pu) and click Refresh.Angle Drop-Down List
Displays the neutral axis angle for the currently displayed curve.
Select the desired angle and click Refresh.Refresh Button

Updates the displayed curve after changes to axial load or neutral axis angle.
Output and Reporting Tools
Tabulated Output Button
Displays numerical values for the curve currently shown.
The output can be:Exported to Excel using the Export button
Copied to the clipboard using the Copy button
Add to Report Button
Adds the moment–curvature details to the detailed report.Curve Details Button
Opens the Curve Details form, displaying:Cross-section angle
Axial load capacity
Initial stiffness
Ductility ratio
Stress/Strain Contour Toolbar Options
The toolbar associated with the stress/strain contour section includes:
2D Button
Displays the stress/strain contour in 2D view.3D Button
Displays the stress/strain contour in 3D view.Type of Contour Drop-Down List
Select the contour type to display:Concrete stress
Bar stress
Concrete strain
Bar strain
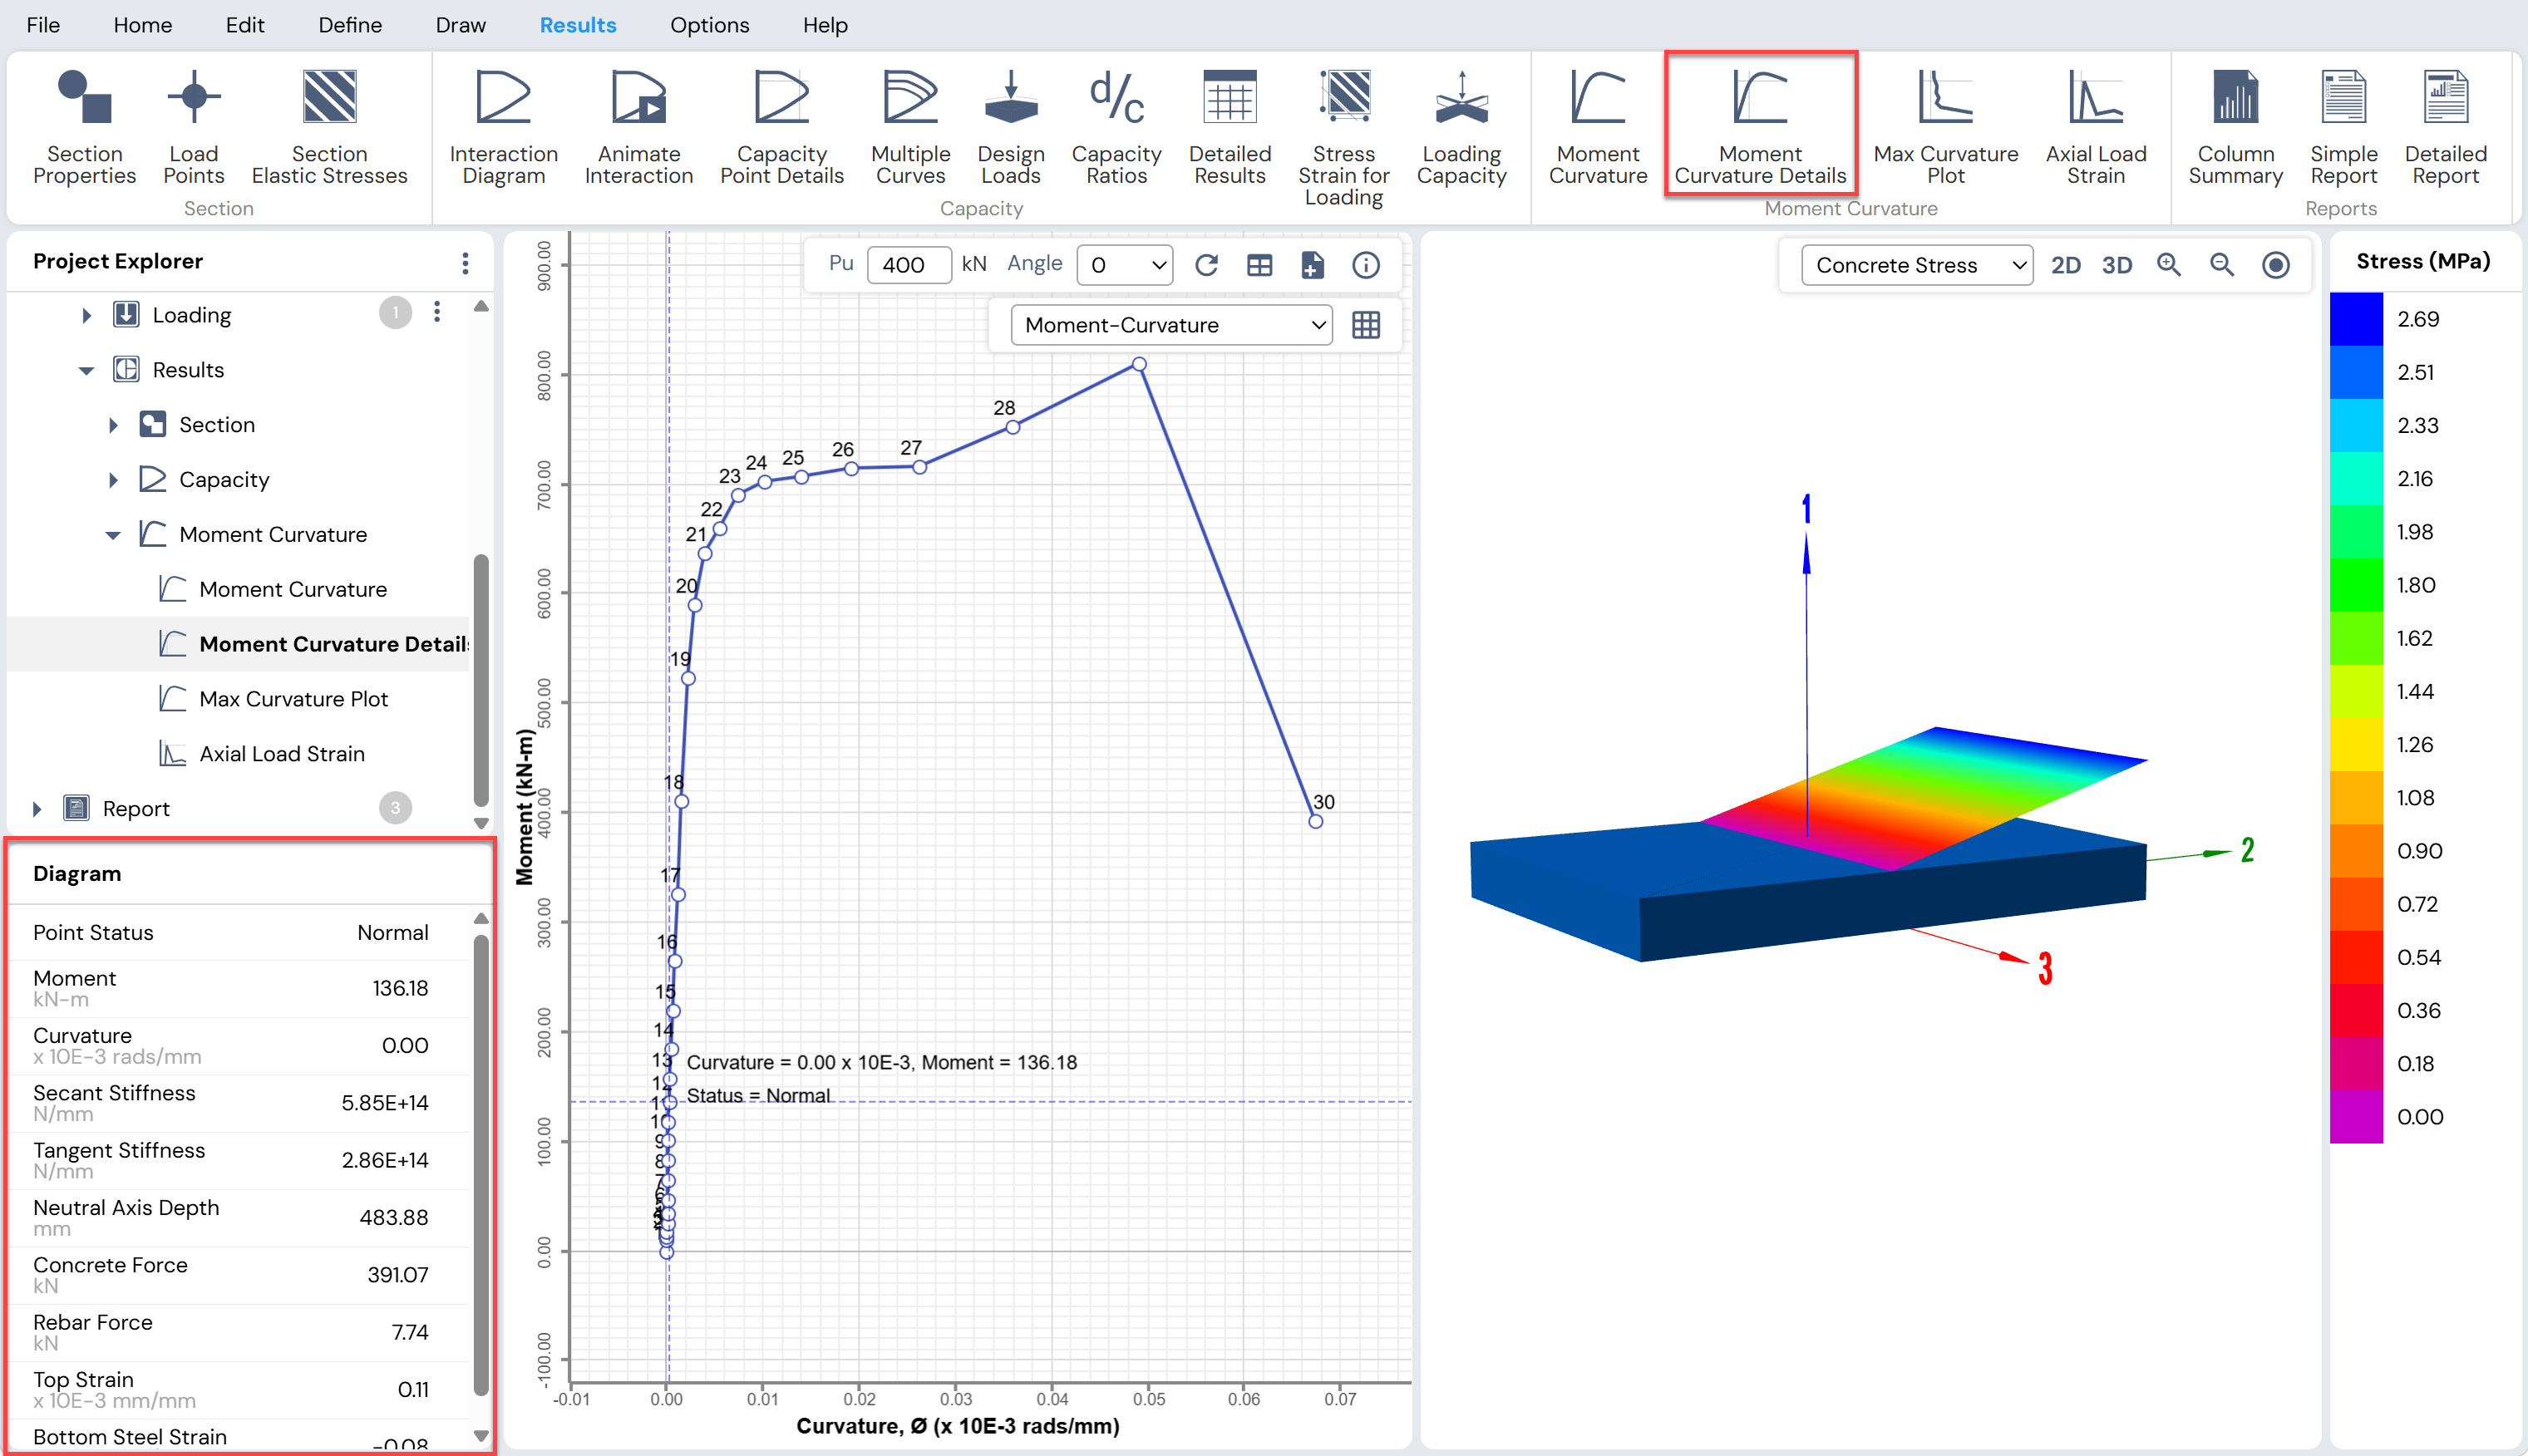
Figure: Moment Curvature Details View
Max Curvature Plot
Use the Results Menu → Moment Curvature → Max Curvature Plot button or
Project Explorer → Columns → Results → Moment Curvature → Max Curvature Plot
to view the Maximum Curvature Plot.
Clicking this button activates the Diagram Grid in the context-sensitive area, where various parameters controlling the maximum curvature plot can be adjusted, including:
Maximum compression strain
Maximum tension strain
Maximum curvature
Maximum curvature factor
Number of curve points
After making the required changes in the Diagram Grid, click the Refresh button to update the plots.
Display Layout
The working area is divided into three sections, each with its own associated toolbar. These sections are described below.
Maximum Curvature Surface
This section displays the Maximum Curvature Surface as a color-coded 3D plot.
The three governing parameters of the surface are:
Axial load
Curvature about local 2-axis
Curvature about local 3-axis
Axial load is plotted along the vertical axis, while the two curvatures are plotted along orthogonal horizontal axes.
The surface provides an overall visualization of how the maximum curvature capacity varies with axial load and bending direction for the selected column section.
A color-coded legend is displayed at the extreme right of the section to assist in interpreting axial load values.
Axial Load vs Curvature Curve
This section displays the variation of axial load with curvature for a selected neutral axis angle.
Associated Toolbar Options
Angle Drop-Down List
Displays the neutral axis angle for the currently displayed curve.
Select a different neutral axis angle to update the curve automatically.
Hover the cursor over the curve to read values at any point.Tabulated Output Button
Displays the numerical data for the currently displayed curve.
The data can be:Exported to Excel using the Export button
Copied to the clipboard using the Copy button
Add to Report Button
Adds the axial load versus curvature diagram to the detailed report.
Curvature–Curvature Curve
This section shows the variation of curvature about the two principal axes for a specified axial load, considering multiple neutral axis orientations.
Associated Toolbar Options
Value of Pu Edit Box

Displays the axial load level corresponding to the currently displayed curvature–curvature curve.
Enter a new axial load value (Pu) to update the curve automatically.Tabulated Output Button
Displays the numerical values for the displayed curvature–curvature curve.
The output can be:Exported to Excel using the Export button
Copied to the clipboard using the Copy button
Add to Report Button
Adds the curvature–curvature diagram to the detailed report.
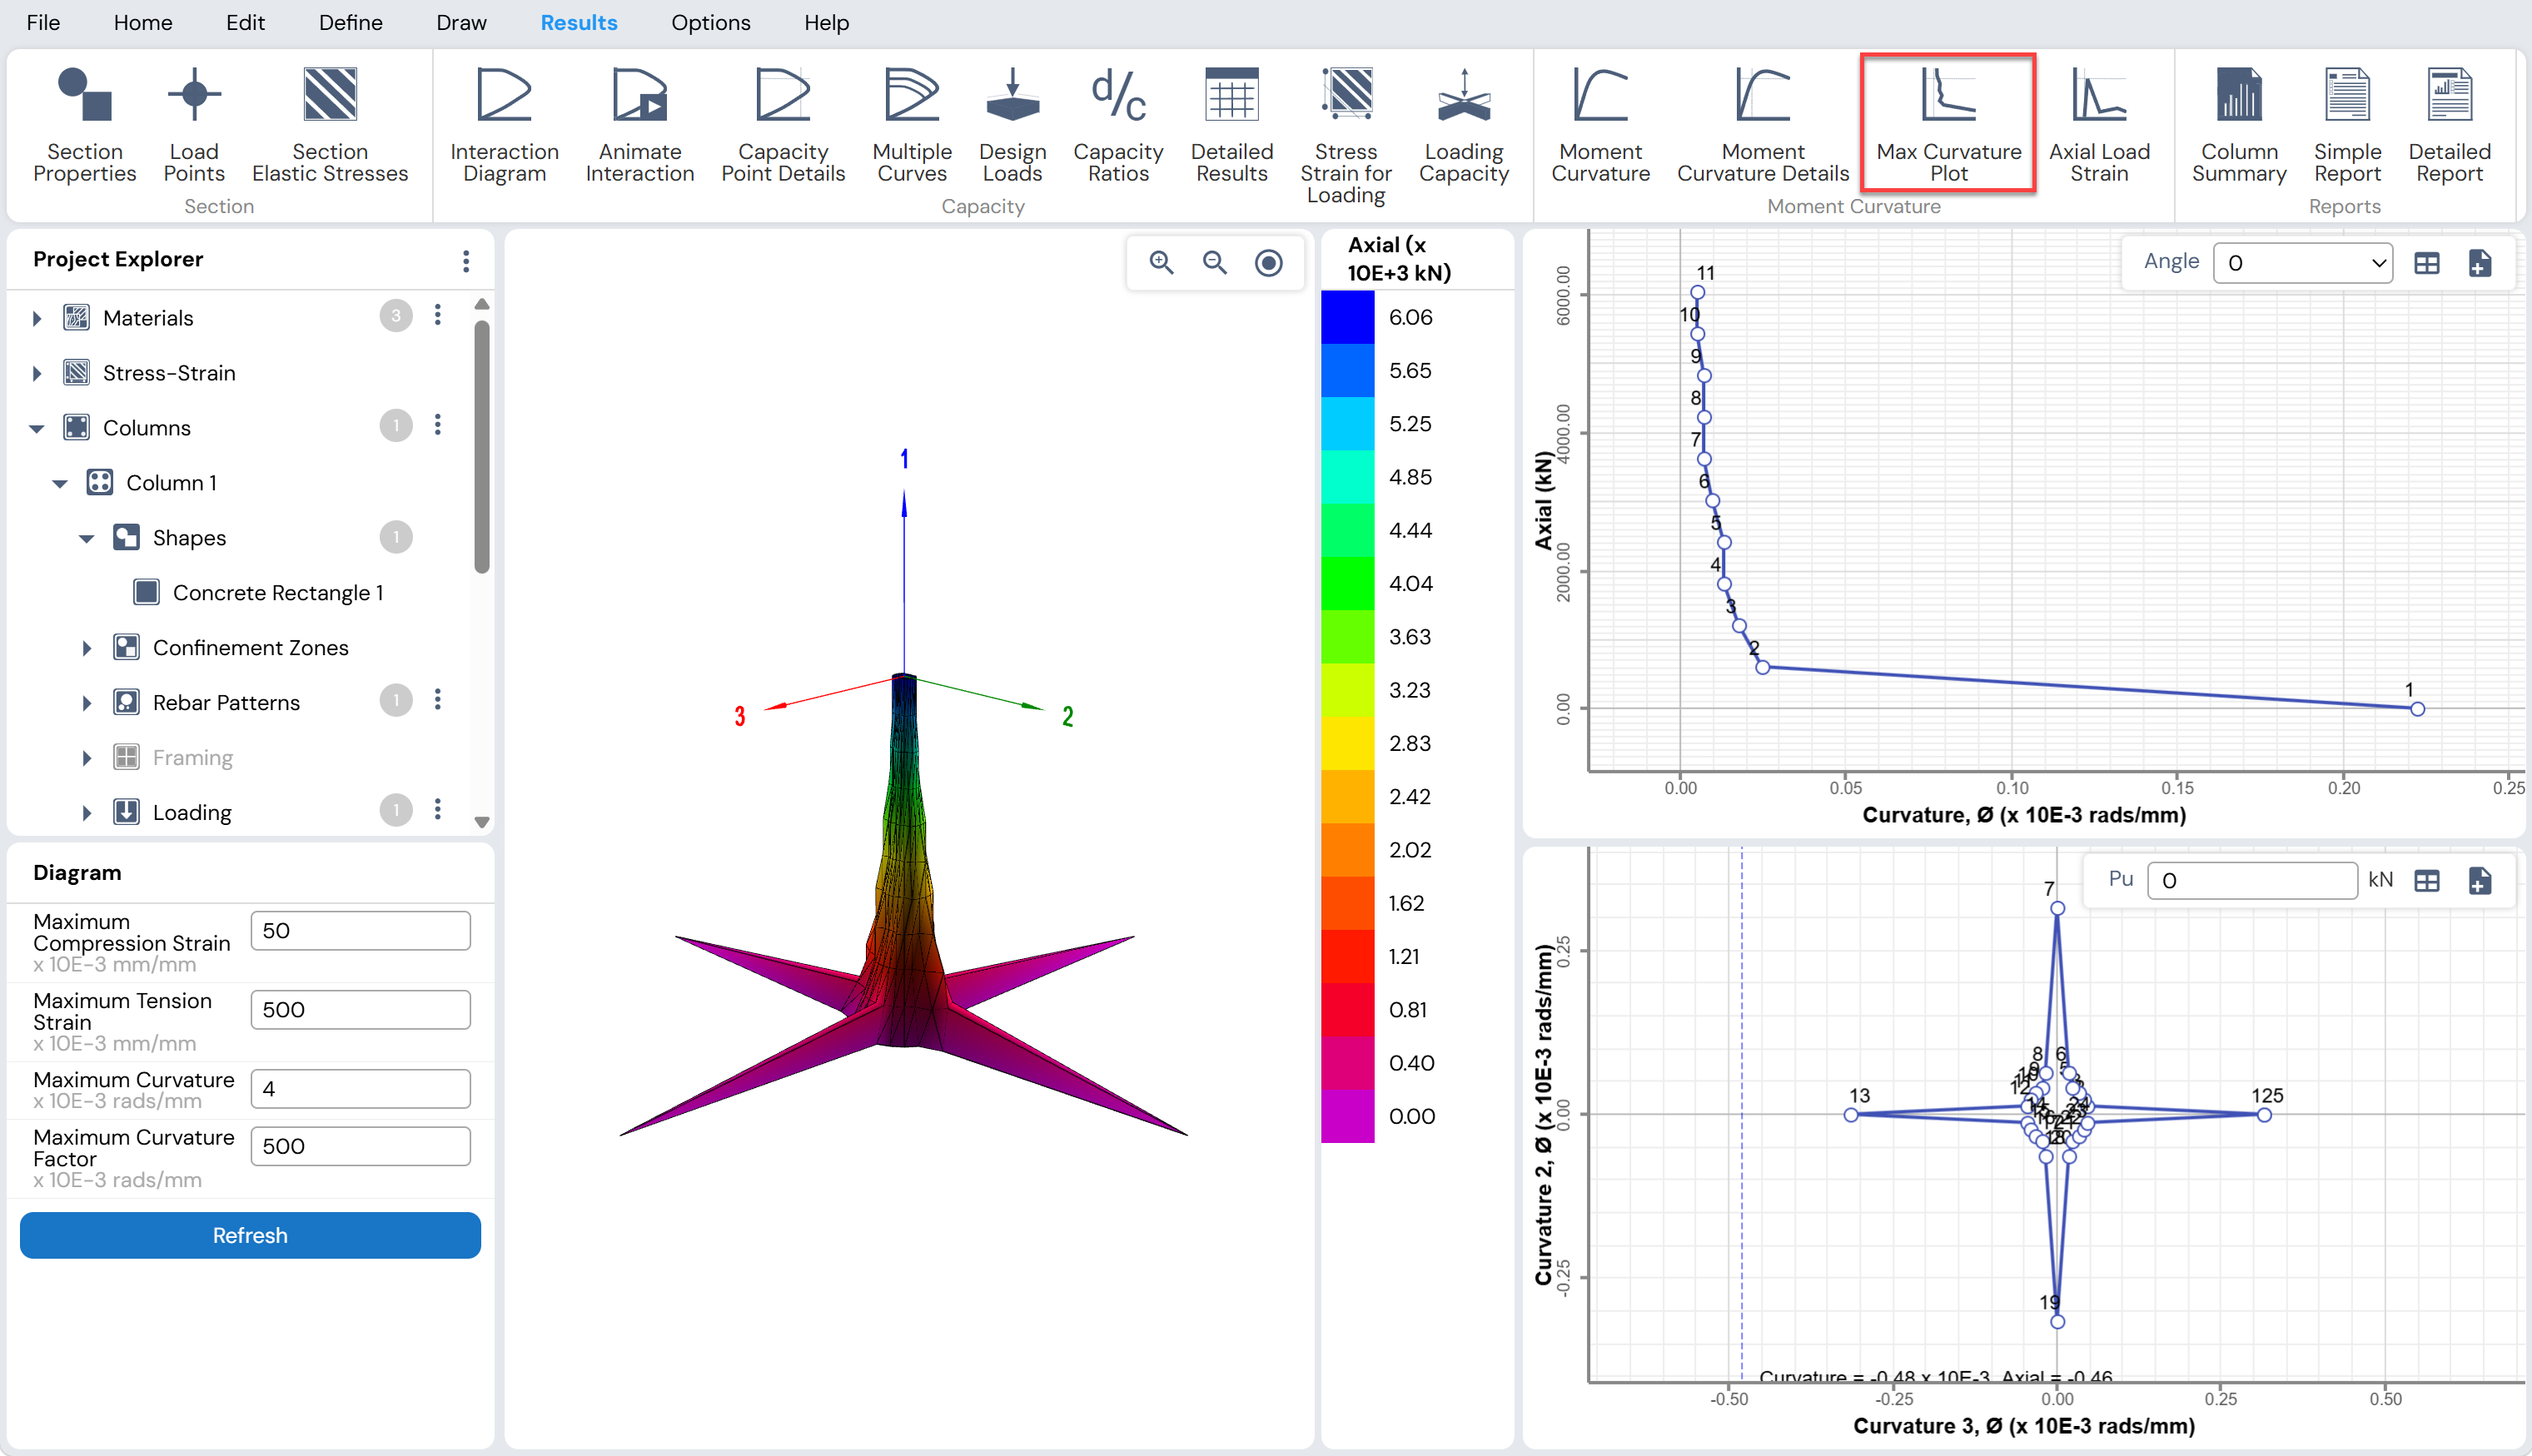
Figure: Maximum Curvature Plot
Axial Load–Strain Plot
Use the Results Menu → Moment Curvature → Axial Load Strain button or
Project Explorer → Columns → Results → Moment Curvature → Axial Load Strain
to plot the Axial Load vs Strain relationship for the selected column section.
Clicking this button activates the Diagram Grid in the context-sensitive area, where various parameters controlling the axial load–strain diagram can be specified, including:
Maximum compressive strain
Maximum tensile strain
Number of curve points
After making the necessary changes in the Diagram Grid, click the Refresh button to update the diagram.
Interpretation of Axial Load–Strain Diagram
The Axial Load–Strain plot illustrates the variation of axial load capacity with respect to axial strain in the column section. This relationship provides valuable insight into:
Axial stiffness characteristics of the section
Compression and tension capacity limits
Transition between elastic and inelastic axial behavior
Ductility characteristics under axial loading
The curve is a fundamental section property and is independent of member length or framing conditions.
Associated Toolbar Options
The following toolbar option is available for the Axial Load–Strain plot:
- Add to Report Button
Click this button to add the Axial Load vs Strain diagram to the detailed report.
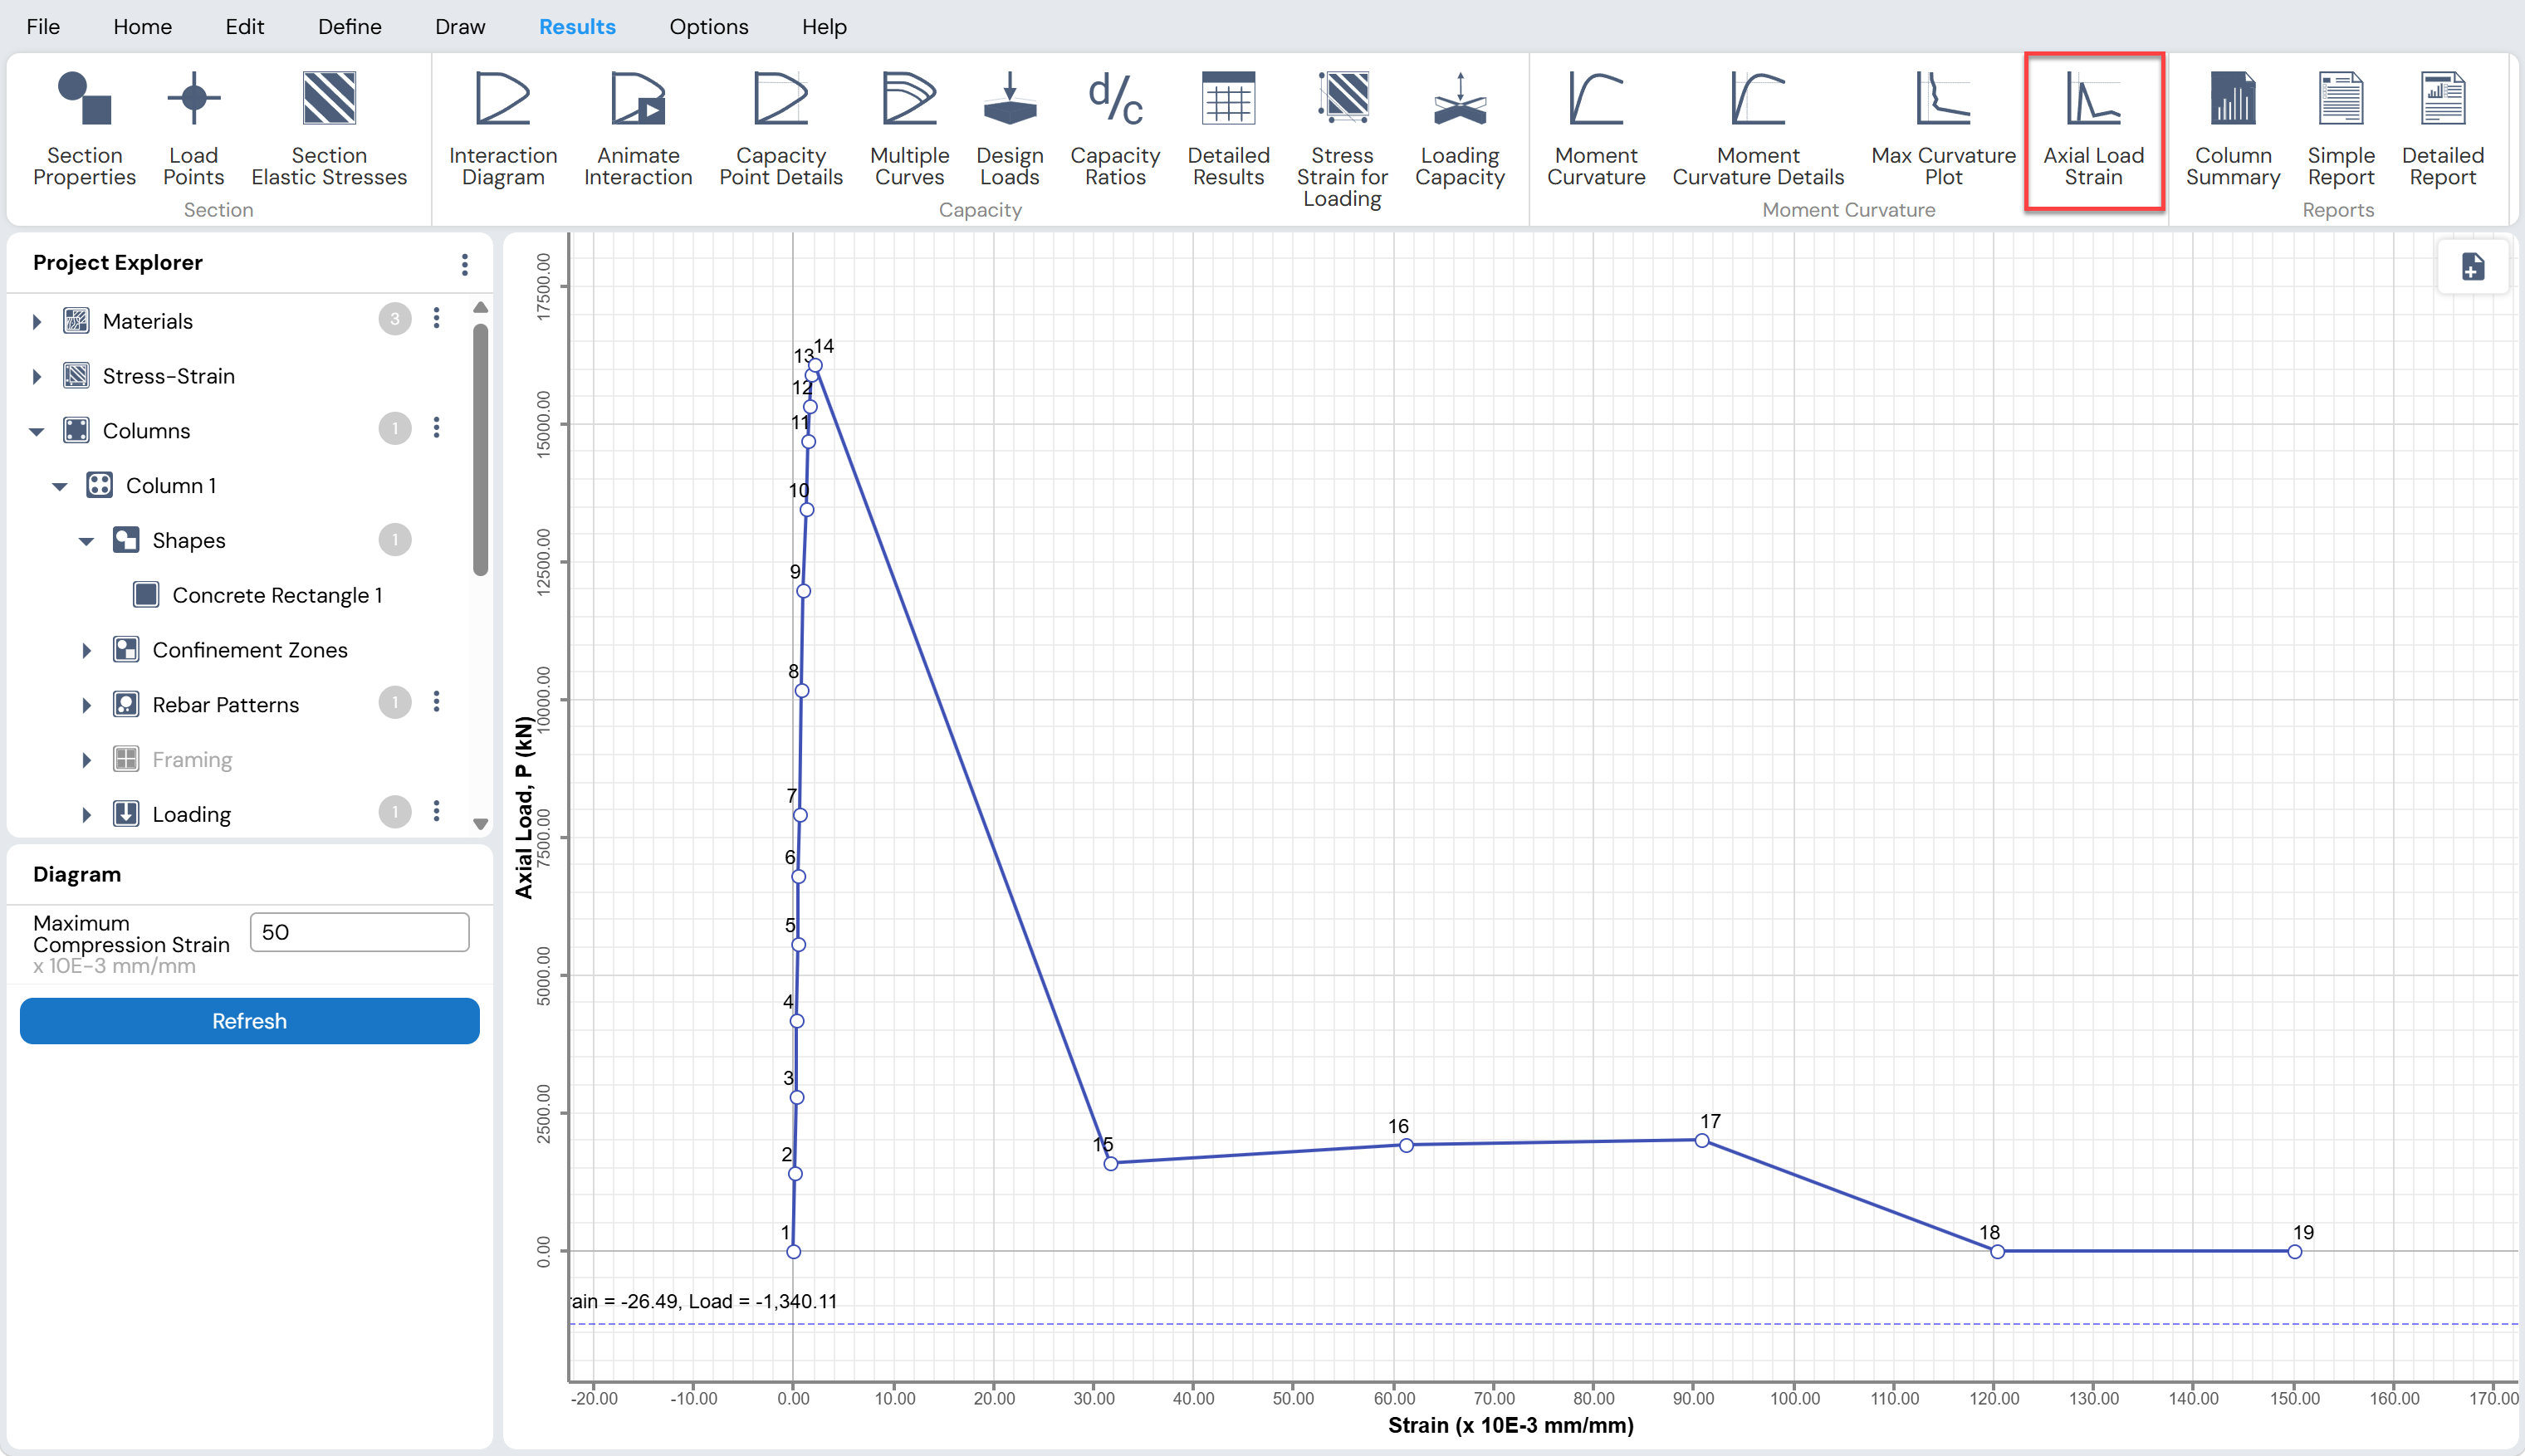
Figure: Axial Load – Strain diagram
Generate a Report
Overview
This section describes the procedure for viewing and printing reports in Column Designer.
The report automatically takes into consideration the currently selected design code and updates the reported results accordingly. Therefore, while the content of the report may differ for various design codes, the procedure for viewing and printing the report remains unchanged.
Viewing Report
Reports can be viewed by selecting any of the available report options under:
Project Explorer → Report, or
Results Menu → Reports
The following three types of reports are available:
Column Summary
Simple Report
Detailed Report
Column Summary
Use the Results Menu → Reports → Column Summary button or
Project Explorer → Report → Column Summary
to access the Column Summary Form.The Column Summary Form (Figure 6.1) provides a concise overview of critical information for all columns in the Project File, including:
Governing load combination
Rebar configuration
Rebar ratio
Corresponding demand-to-capacity (D/C) ratio
This summary allows the user to quickly identify controlling cases and assess the adequacy of columns within the project.
Figure: Column Summary Form
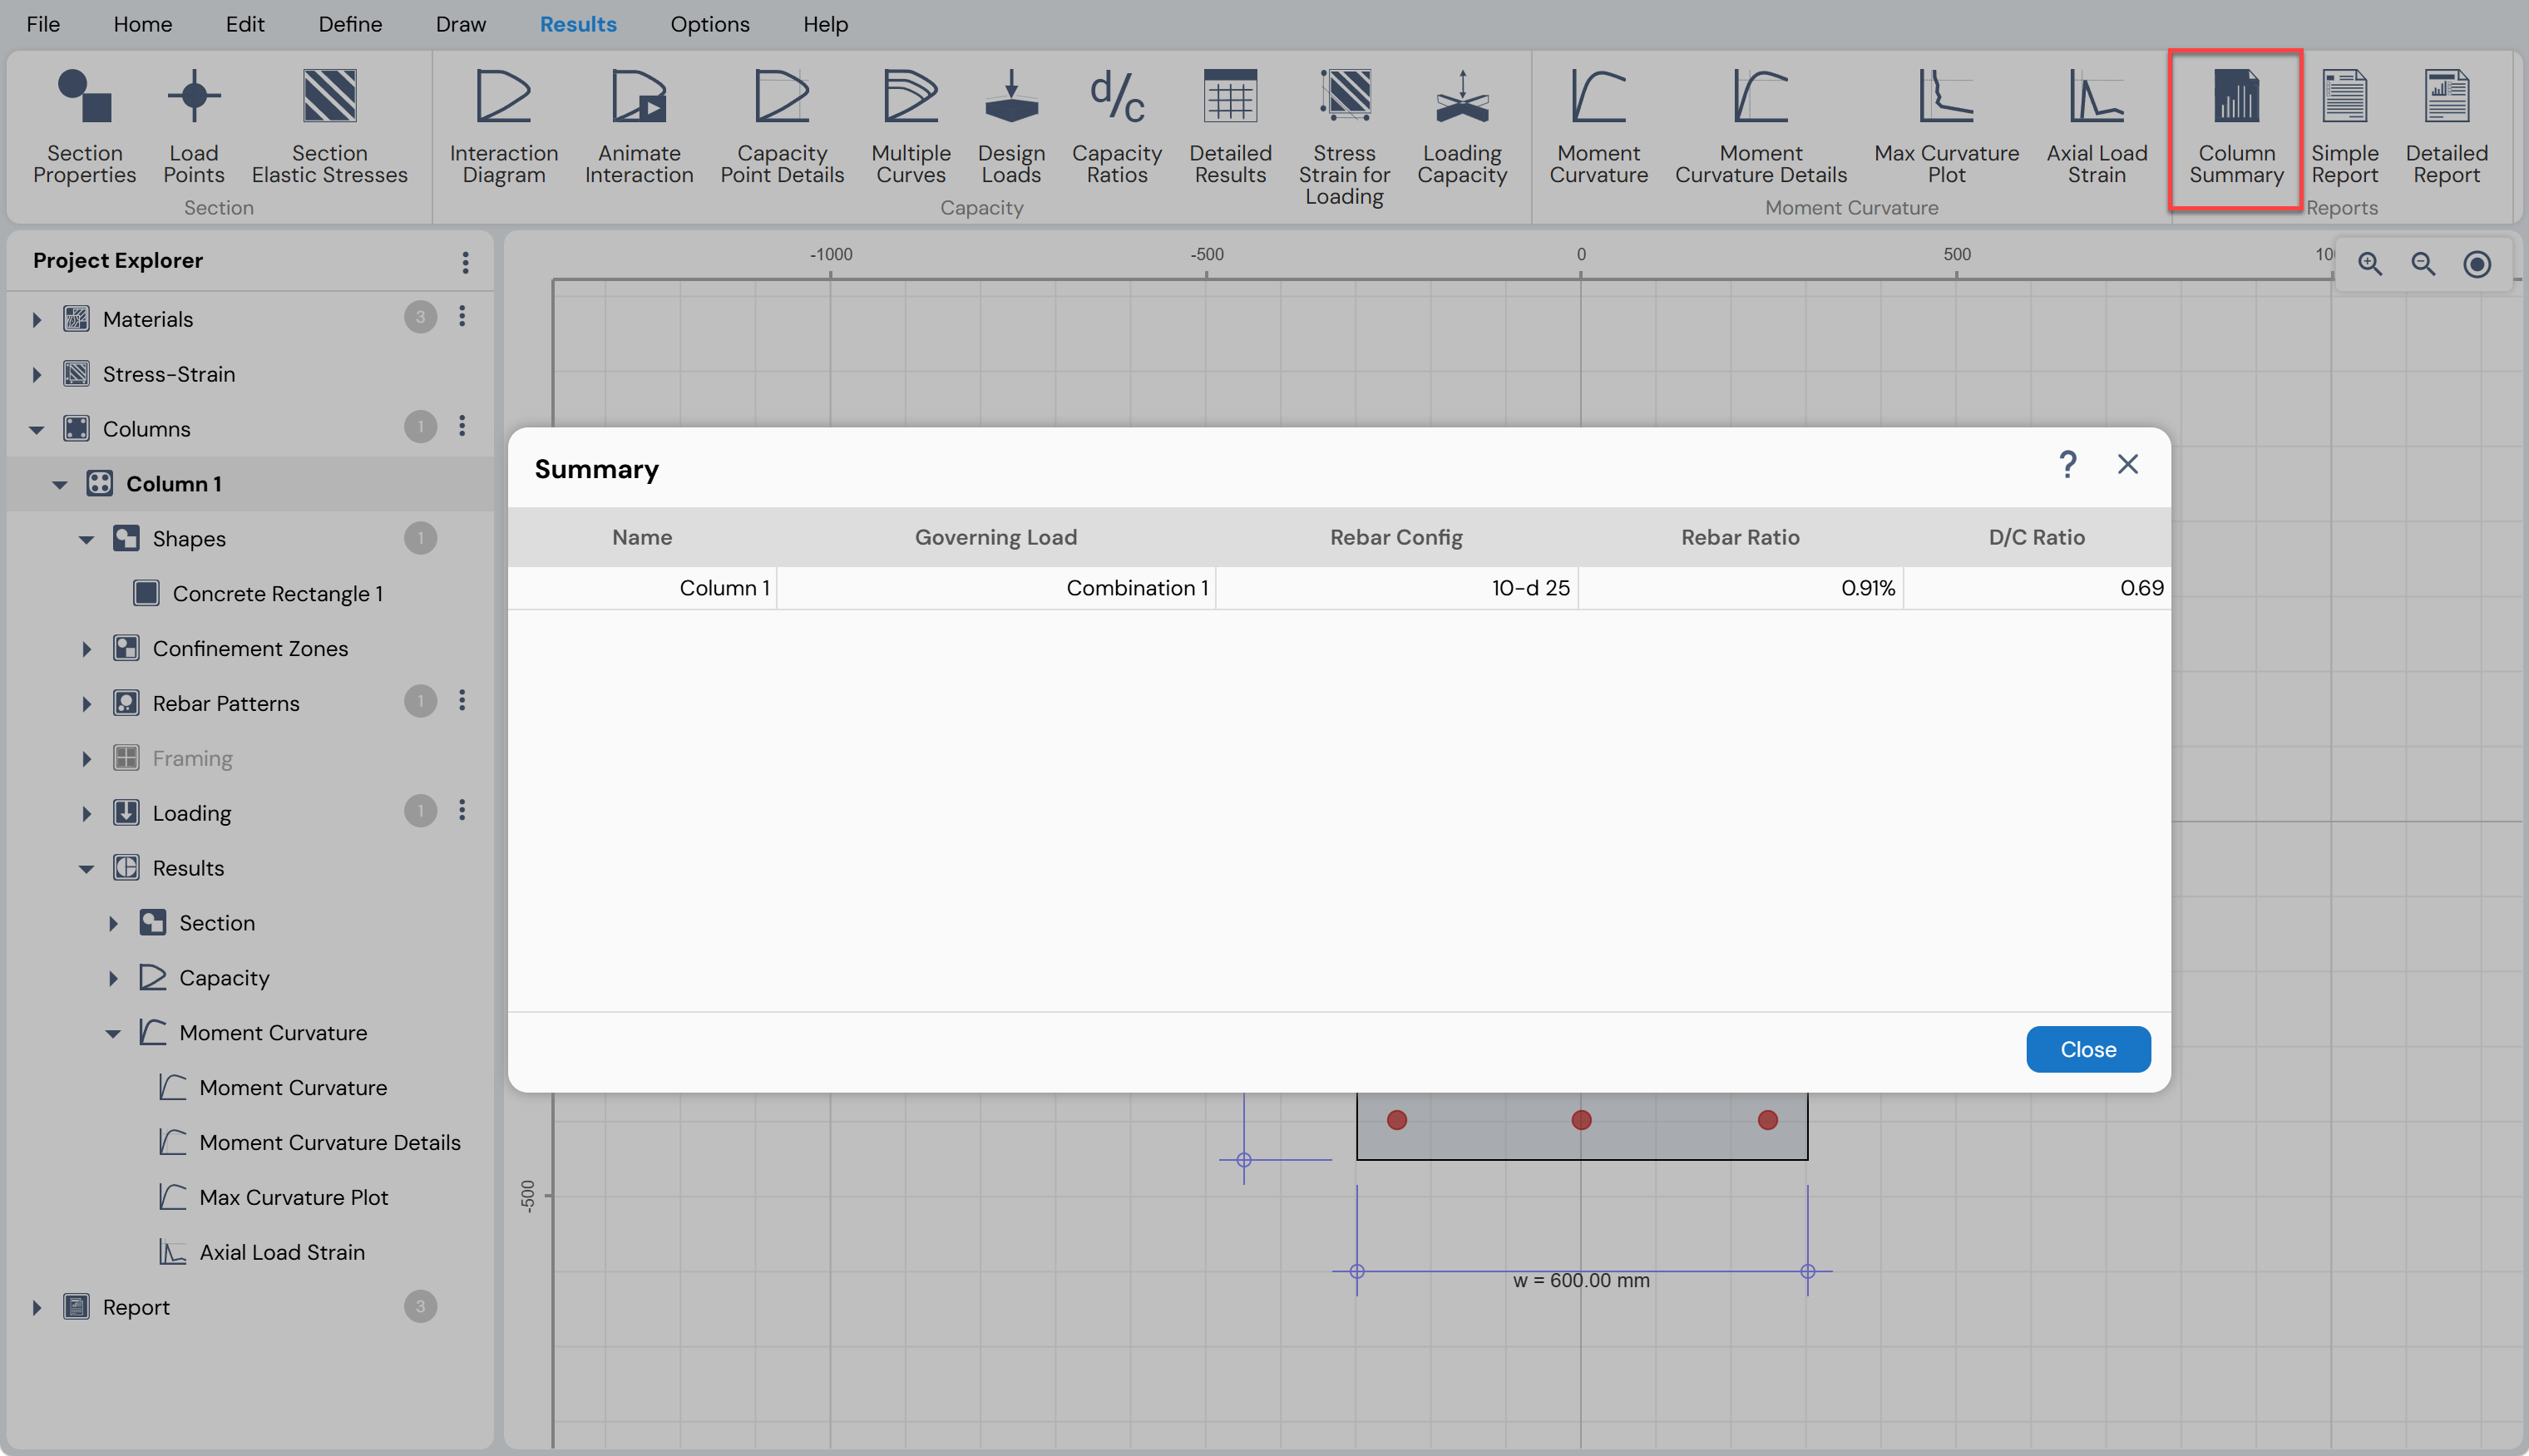
Simple Report
Use the Results Menu → Reports → Simple Report button or
Project Explorer → Report → Simple Report
to generate a one-page report for each column in the Project File.
The Simple Report provides a concise, printable summary of essential column design information, including:
Section geometric properties
Material properties
Rebar configuration and details
Governing load combination
P–M interaction diagram
M–M interaction diagram
This report is intended for quick review, documentation, and sharing of column design results without the level of detail provided in the Detailed Report.
Simple Report Toolbar Options
The following options are available in the context-sensitive toolbar of the Simple Report:
Zoom Level Drop-Down List

Select a predefined zoom level to view the report at the desired scale.Zoom In Button
Zoom in to enlarge the report view.Zoom Out Button

Zoom out to reduce the report view.Reset and Refresh View Button
Restore the original default display of the report.Print Button

Print the currently displayed Simple Report.
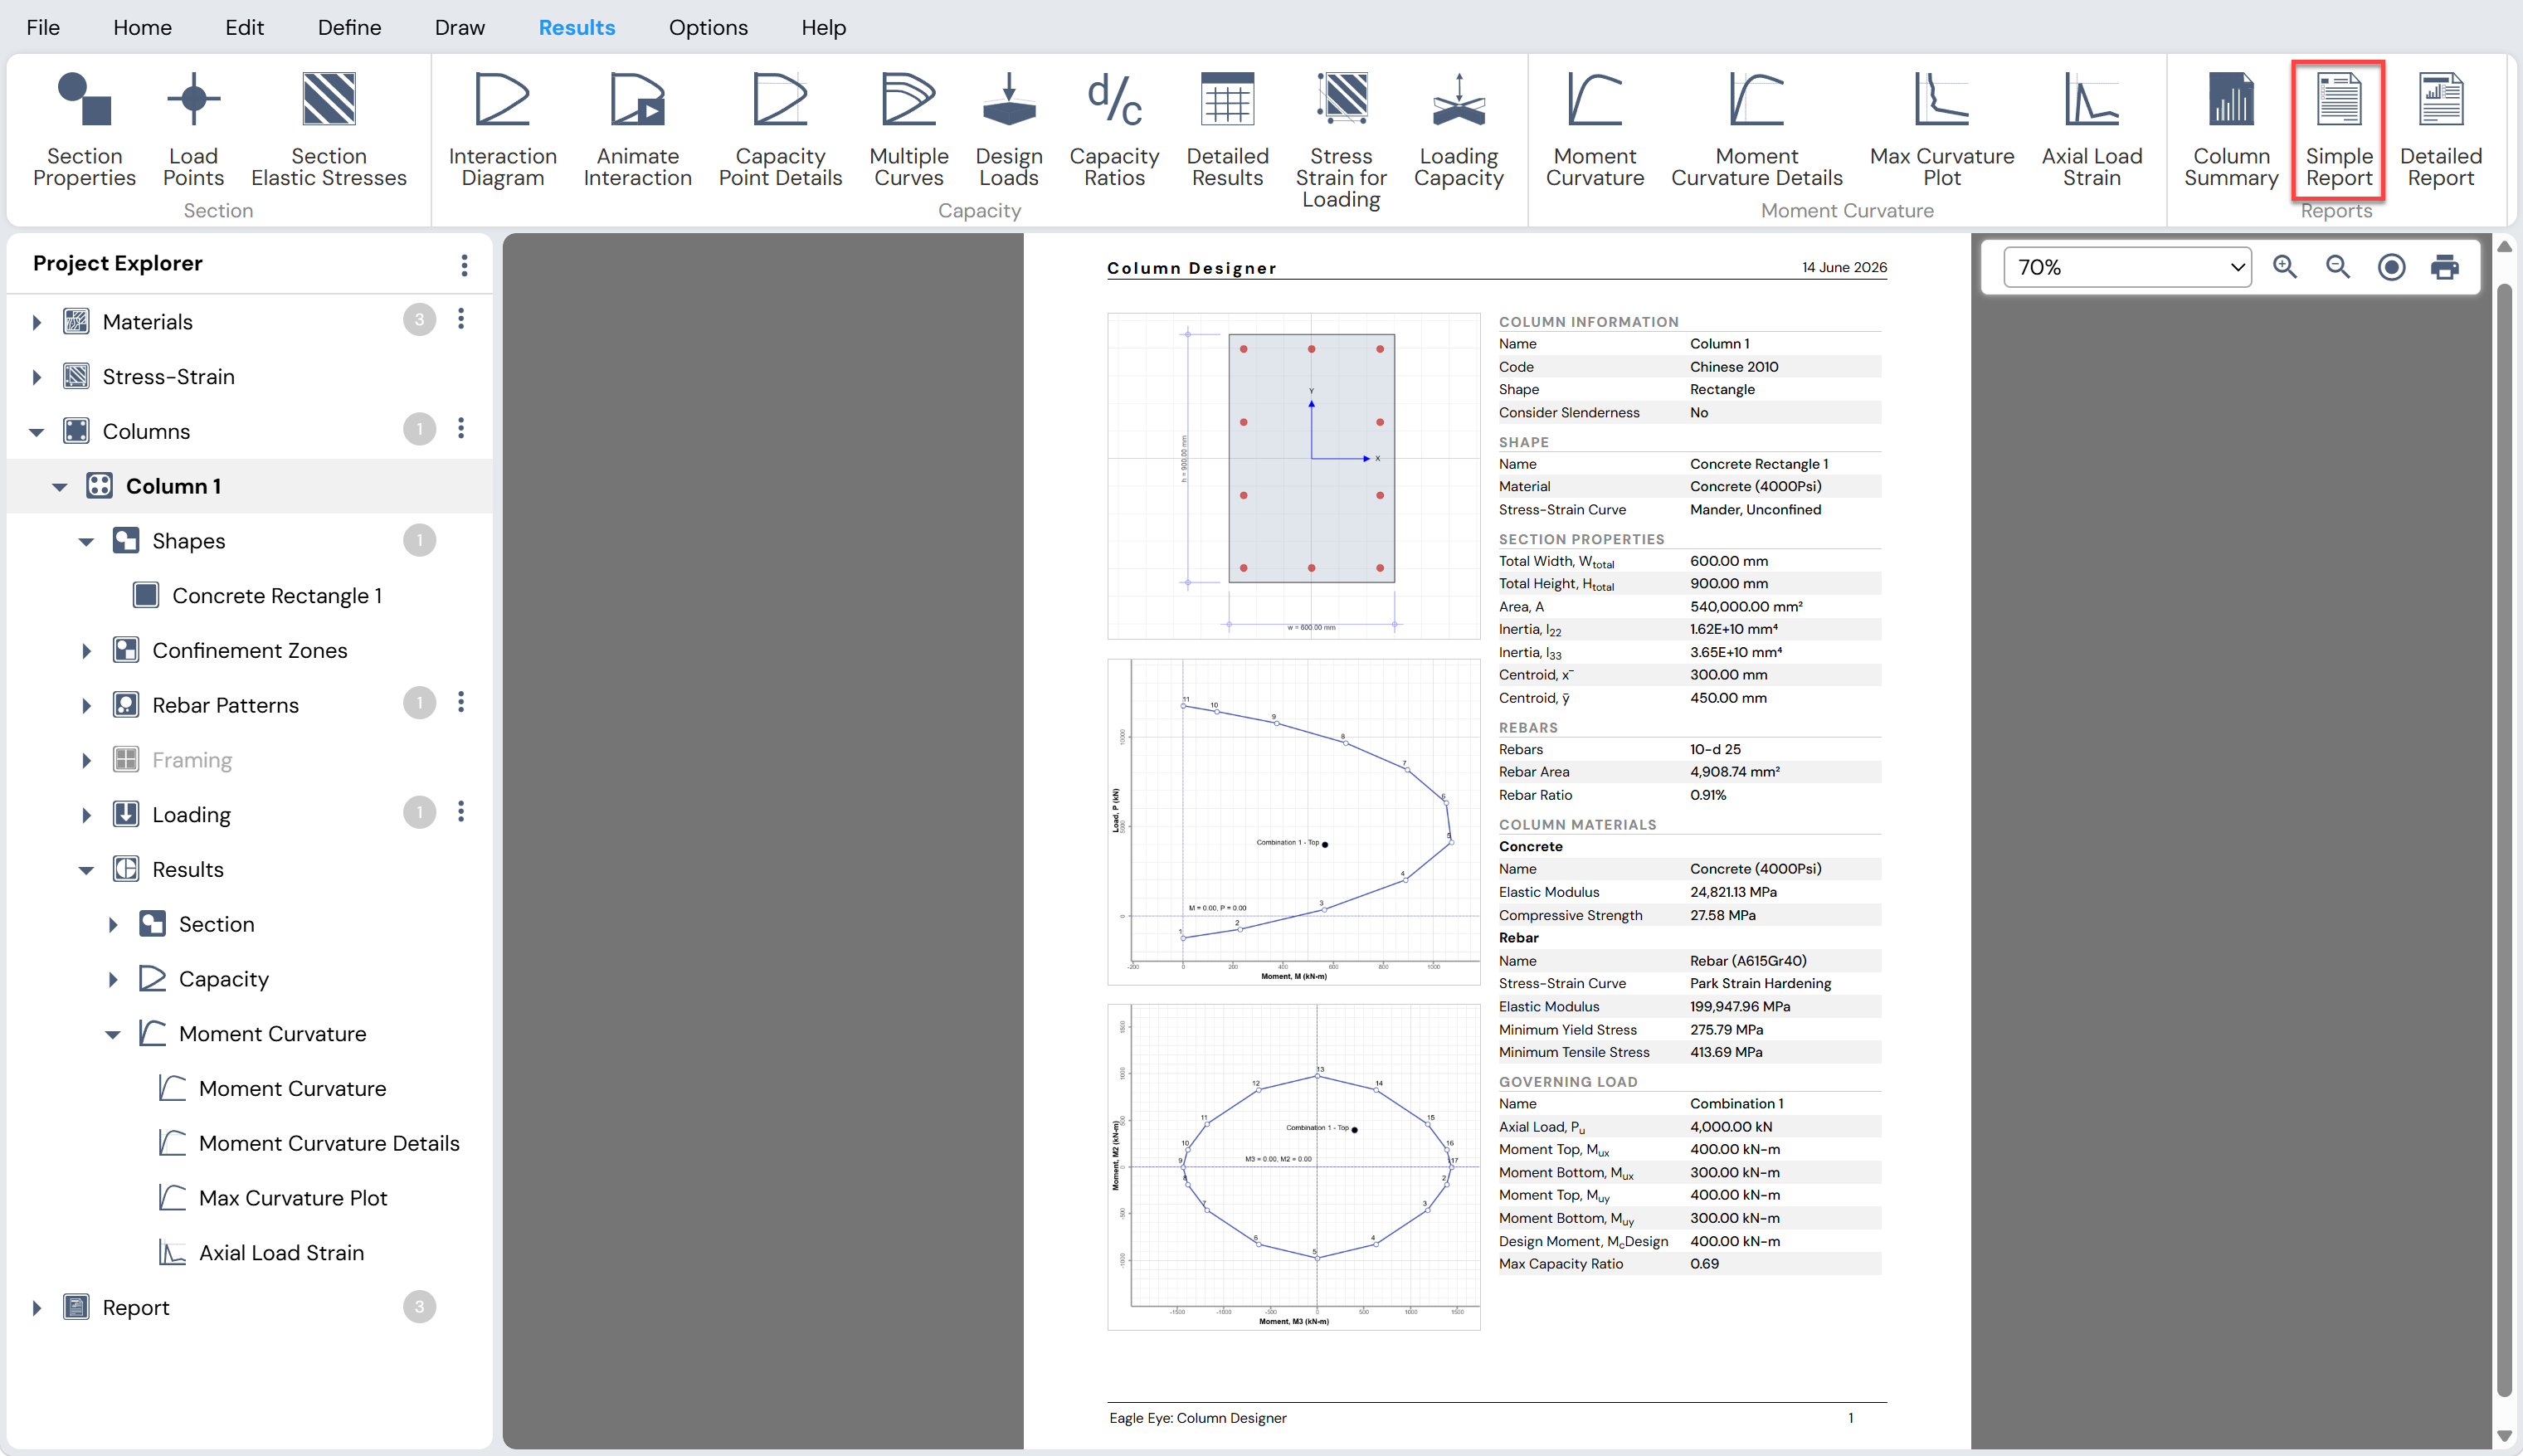
Figure: Simple One Page Report View
Detailed Report
Use the Results Menu → Reports → Detailed Report button or
Project Explorer → Report → Detailed Report
to access the Detailed Report for all columns in the Project File.
The Detailed Report provides a comprehensive, code-aware documentation of the column design and analysis results. The report content automatically adapts to the currently selected design code.
Contents of the Detailed Report
The Detailed Report includes the following information for each column:
Project Information
Column section diagrams
Material properties
Stress–strain model parameters
Rebar properties and layouts
Section geometric properties
Framing information (for slender columns)
Loading details
Design checks and capacity results
This report is intended for formal design documentation, peer review, and regulatory submission.
Detailed Report Toolbar Options
The following options are available in the context-sensitive toolbar of the Detailed Report:
Zoom Level Drop-Down List
Select a predefined zoom level to view the report at the desired scale.Zoom In Button
Zoom in to enlarge the report view.Zoom Out Button
Zoom out to reduce the report view.Reset and Refresh View Button
Restore the original default display of the report.Print Button
Print the Detailed Report
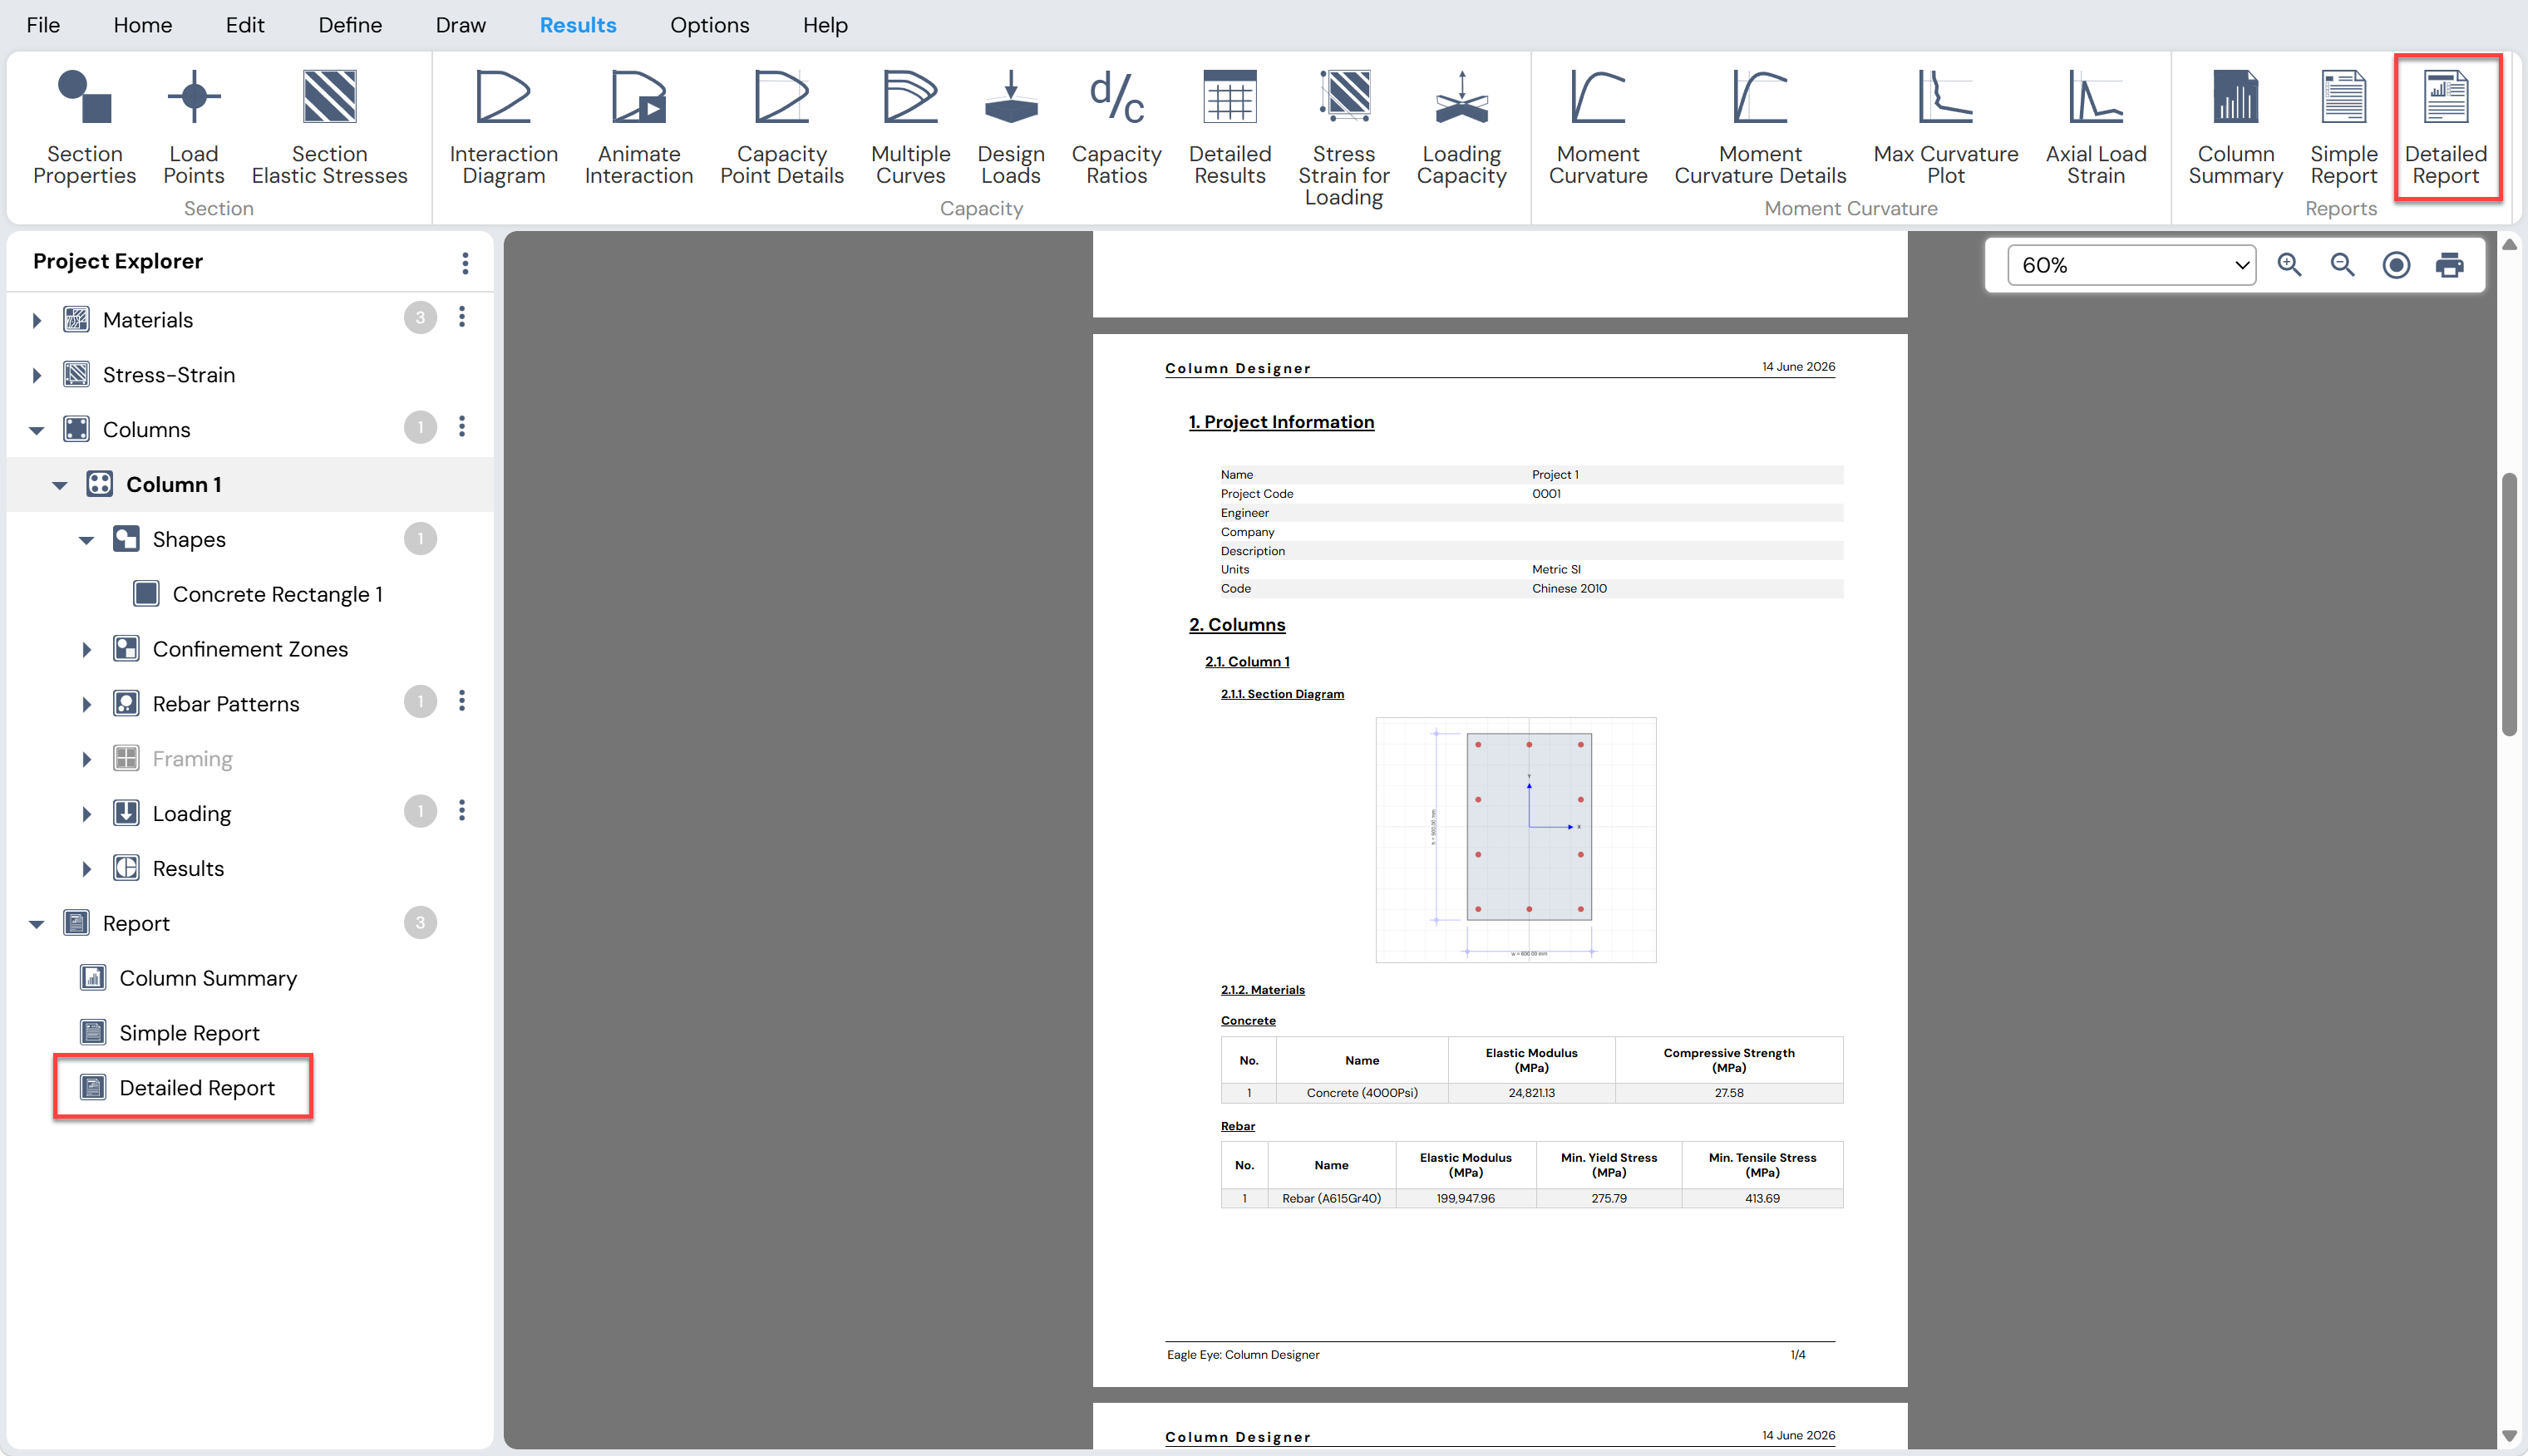
Figure: Detailed Report
Adding Content to the Detailed Report
Additional graphics can be included in the Detailed Report at any time before printing.
To add graphics:
- Click the Add to Report button available in the context-sensitive toolbar of any diagram under the Results Menu (e.g., interaction diagrams, stress contours, moment-curvature plots).
All added graphics will automatically appear in the Detailed Report in the order they are added.
Printing or Saving Reports
Both the Simple Report and the Detailed Report can be printed by clicking the Print button in their respective toolbars.
To save a report:
- Print the report to PDF format using a PDF printer.
This allows the reports to be archived, shared electronically, or submitted for review.