


Quick Design Wizard
Worked Example
Introduction
Eagle Eye Column Designer is a web-based structural engineering platform for designing, analyzing, and investigating reinforced concrete and composite columns. It is accessible at column.eaglei.tech and supports multiple international design codes, including ACI 318-19, AASHTO LRFD, Eurocode 2, and others.
The Quick Design Wizard is the recommended starting point for new users. It provides a step-by-step checklist that guides you through every phase of column design from project setup and material definition to section geometry, loading, results viewing, and report generation.
What This Tutorial Covers
This guide walks through a complete example using the Quick Design Wizard to design a 24 × 24 in rectangular tied column with 12-#8 rebars, subjected to an axial load of 1,000 kip, under ACI 318-19. You will learn to:
Create a new project and configure design code and units
Define concrete and rebar material properties
Define the column cross-section shape and reinforcement layout
Enter factored load combinations
Review capacity ratios, interaction diagrams, and moment-curvature plots
Generate a PDF or on-screen report
Launching the Quick Design Wizard
Opening the Application
In Column Designer home screen Quick Design Wizard banner is displayed at the top, followed by pre-built templates (Building Frame Column, Bridge Pier, Shear Wall, Retrofit Assessment) and column type options (From ETABS®, Rectangular, Circular, Blank).
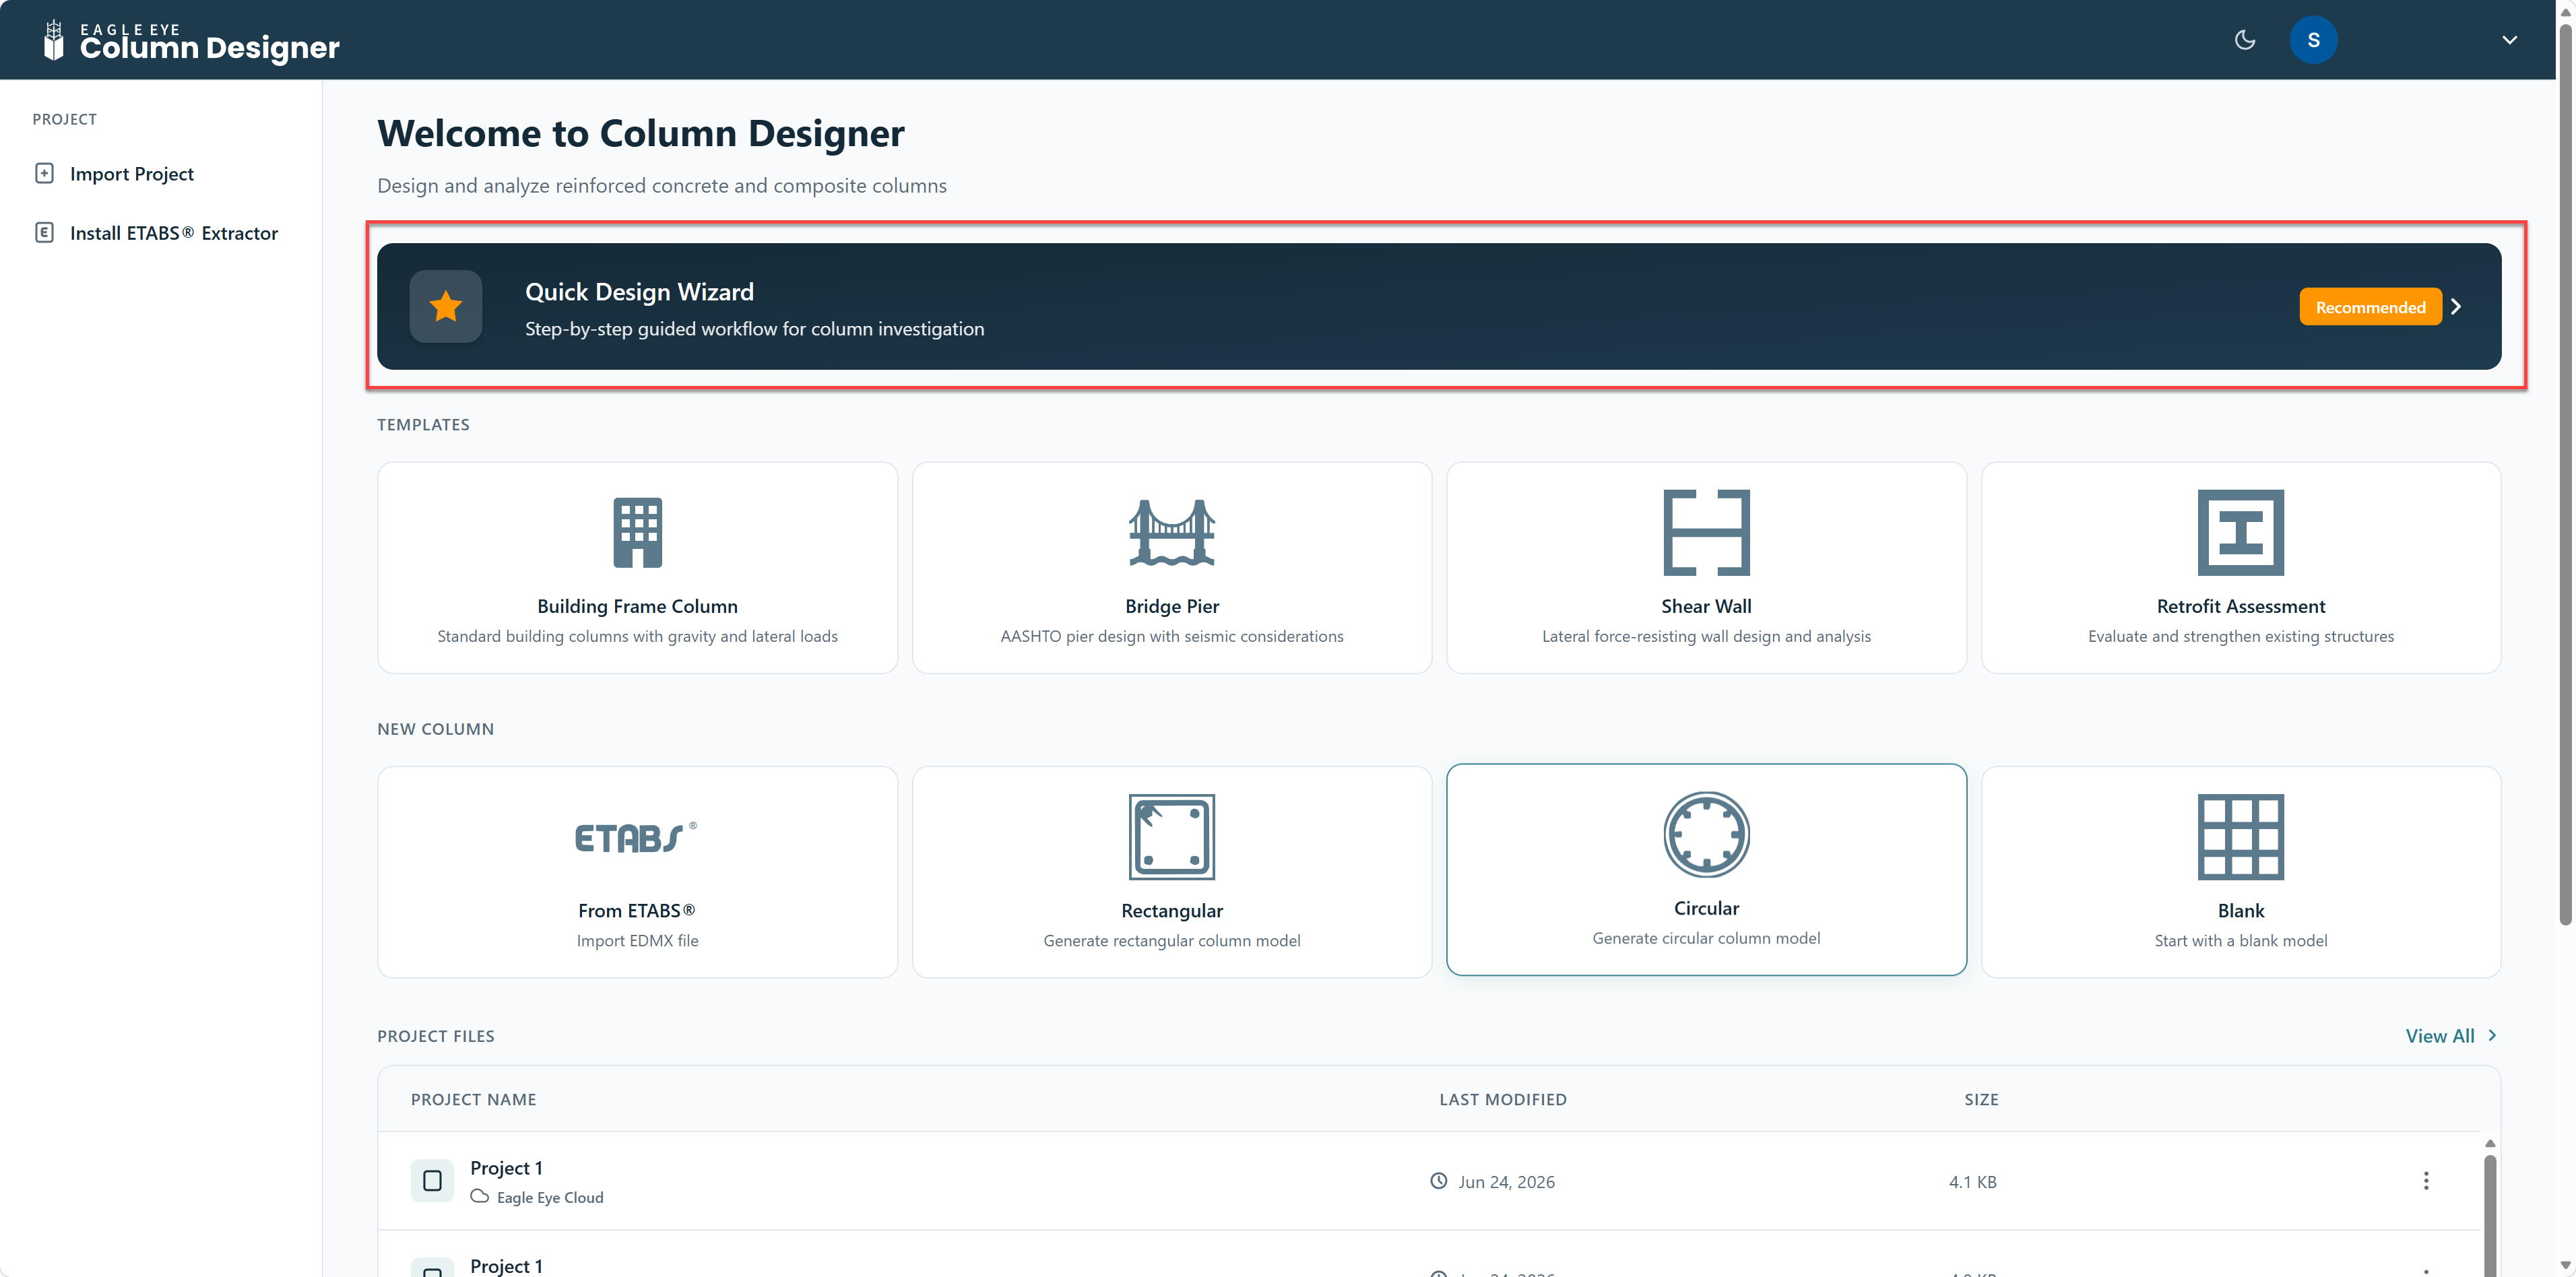
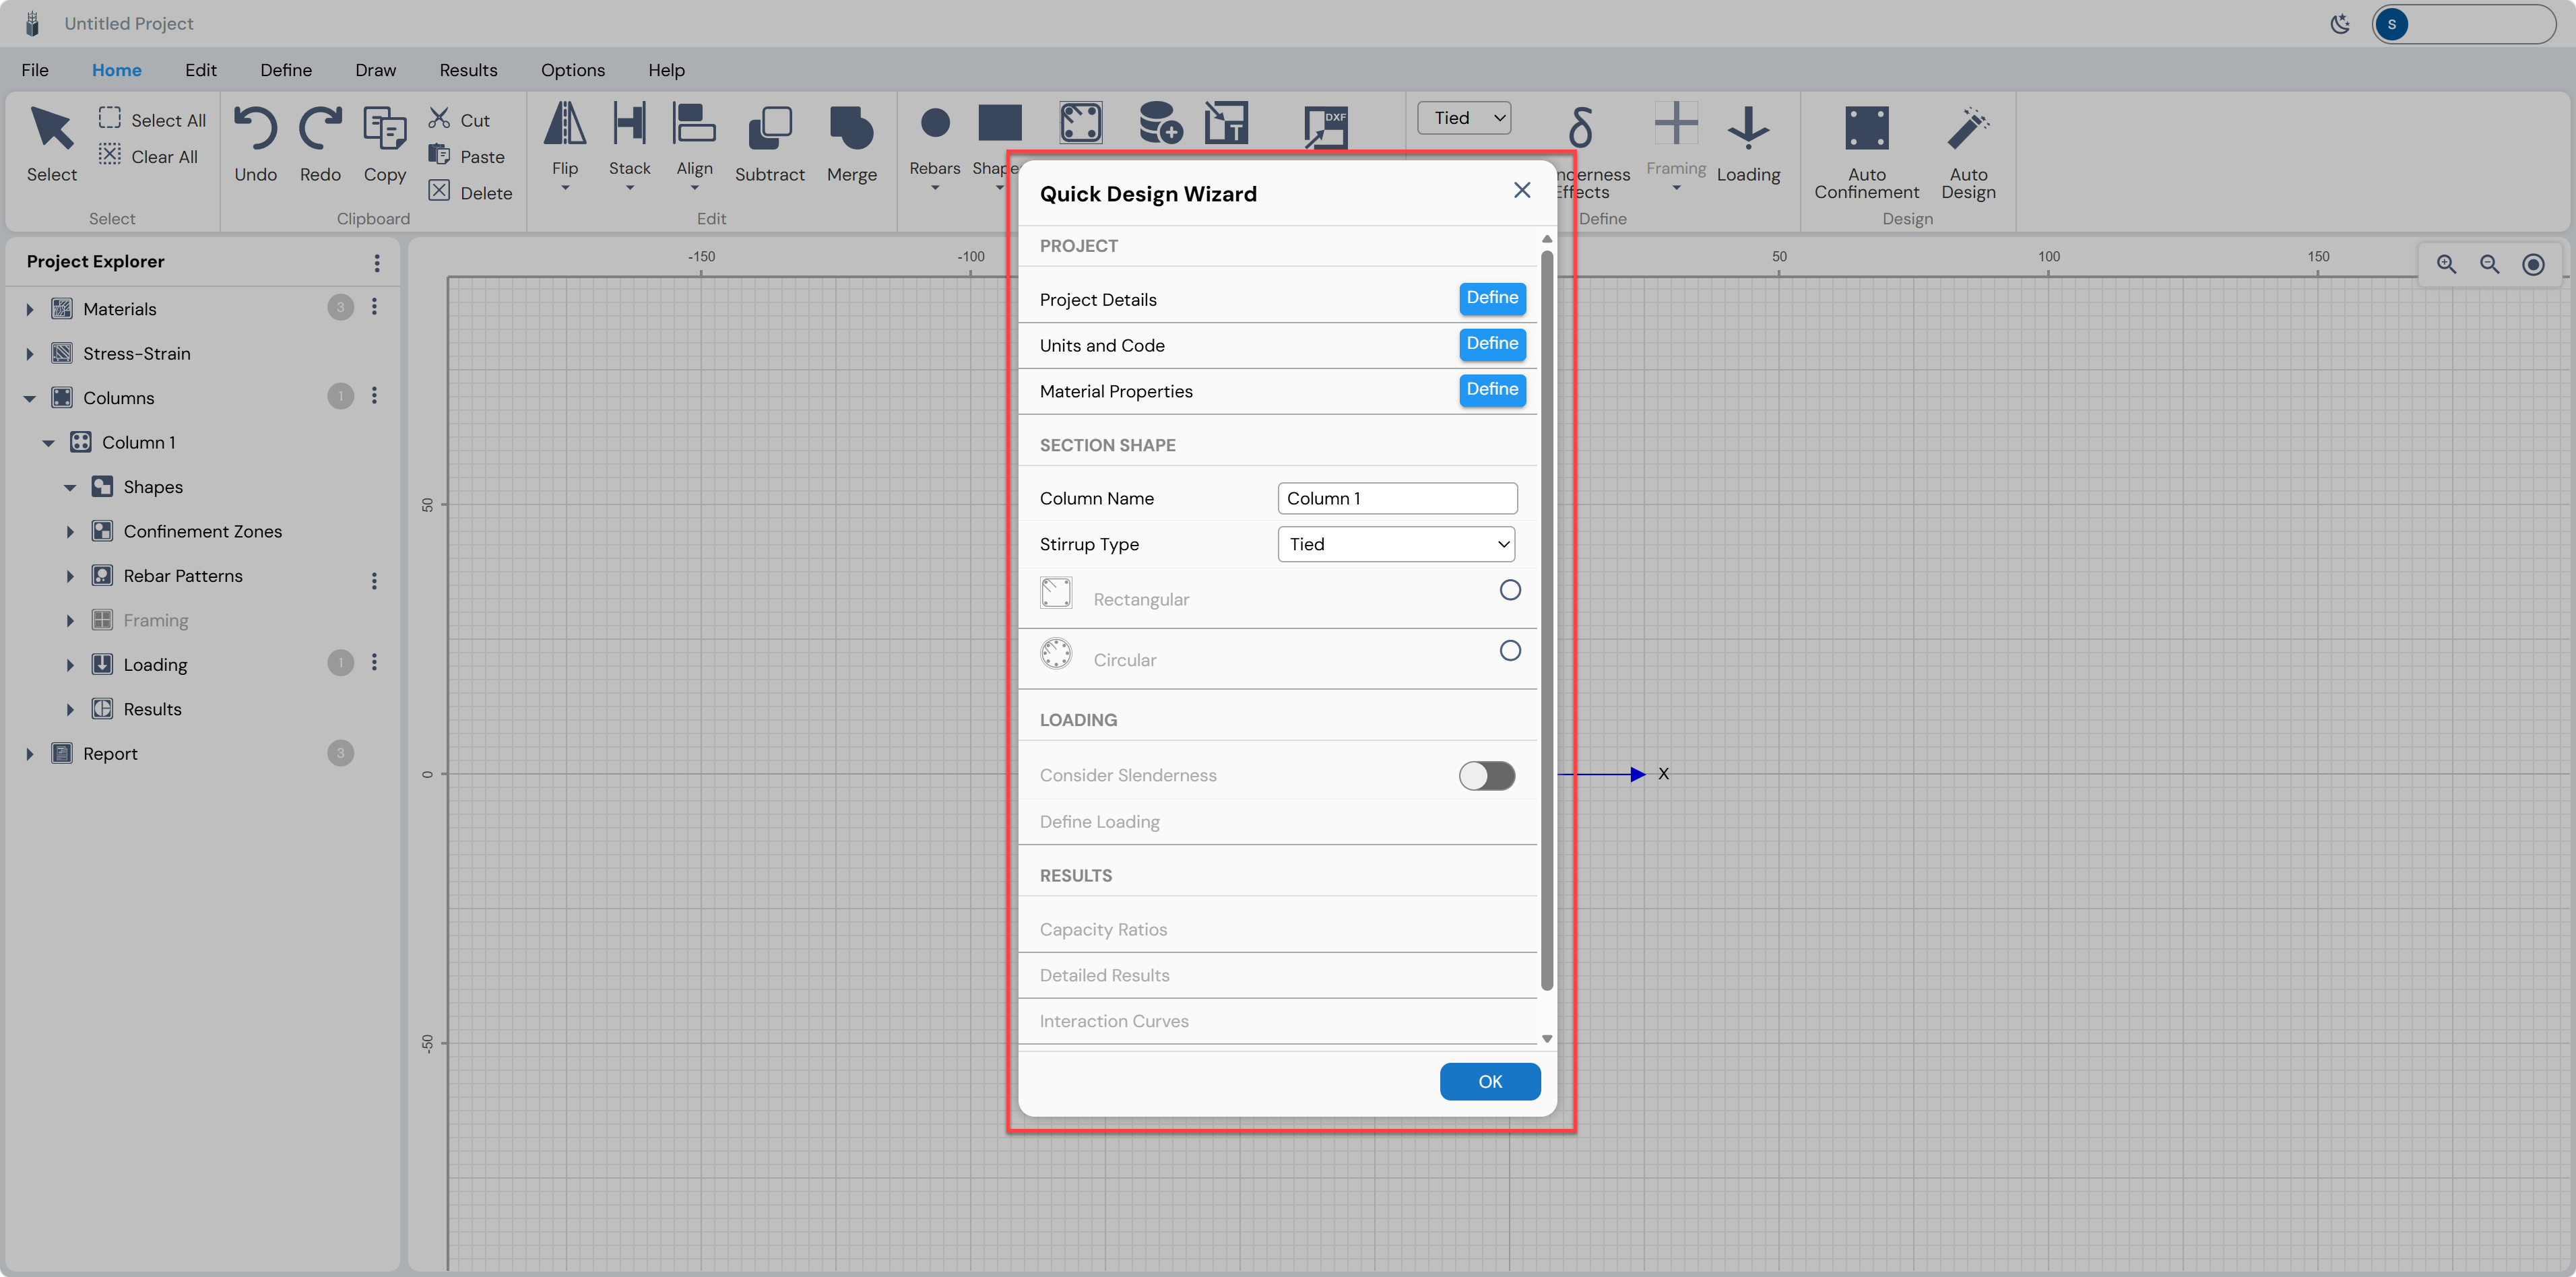
Click the Quick Design Wizard banner or button to open the wizard dialog. The wizard will open inside the main canvas workspace.
Project Configuration
The wizard’s PROJECT section contains three items that must be configured before proceeding: Project Details, Units and Code, and Material Properties.
Project Details
Click the Define button next to Project Details. A Project Information dialog will open. Fill in the fields.
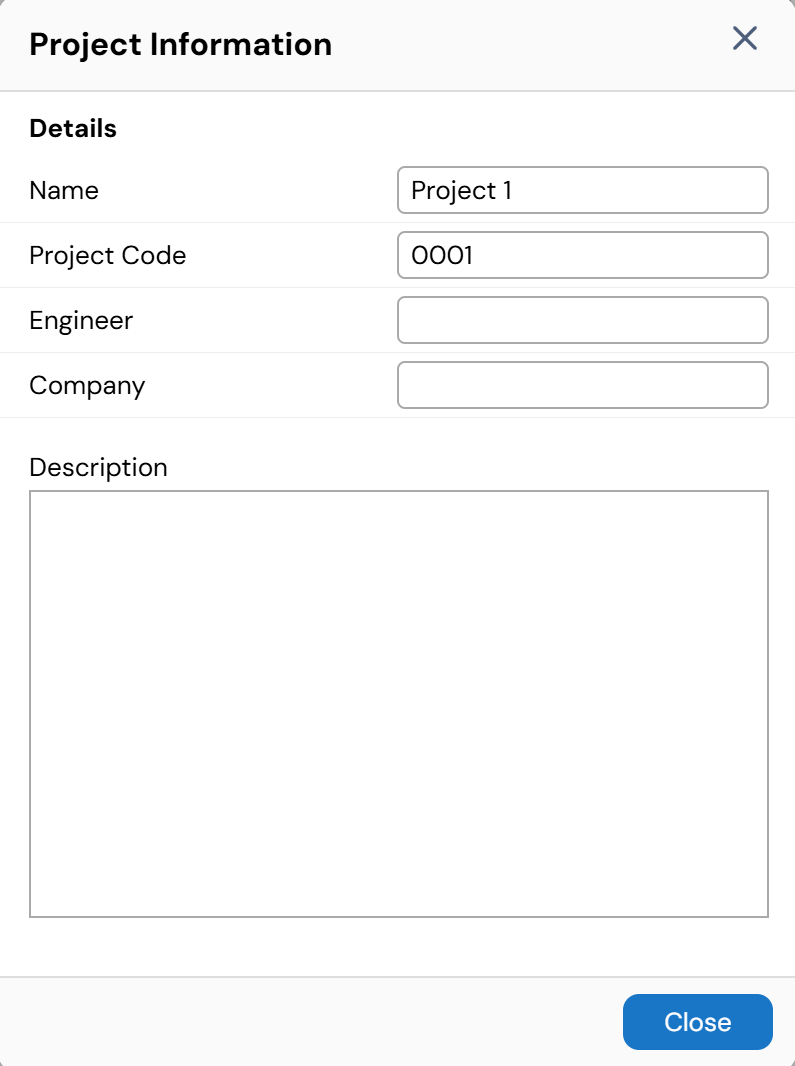
Click Close when done. The Project Details row in the wizard will display a blue checkmark (✓) confirming completion.
Units and Code
Click the Define button next to Units and Code. The Options dialog opens, showing settings for the General section.
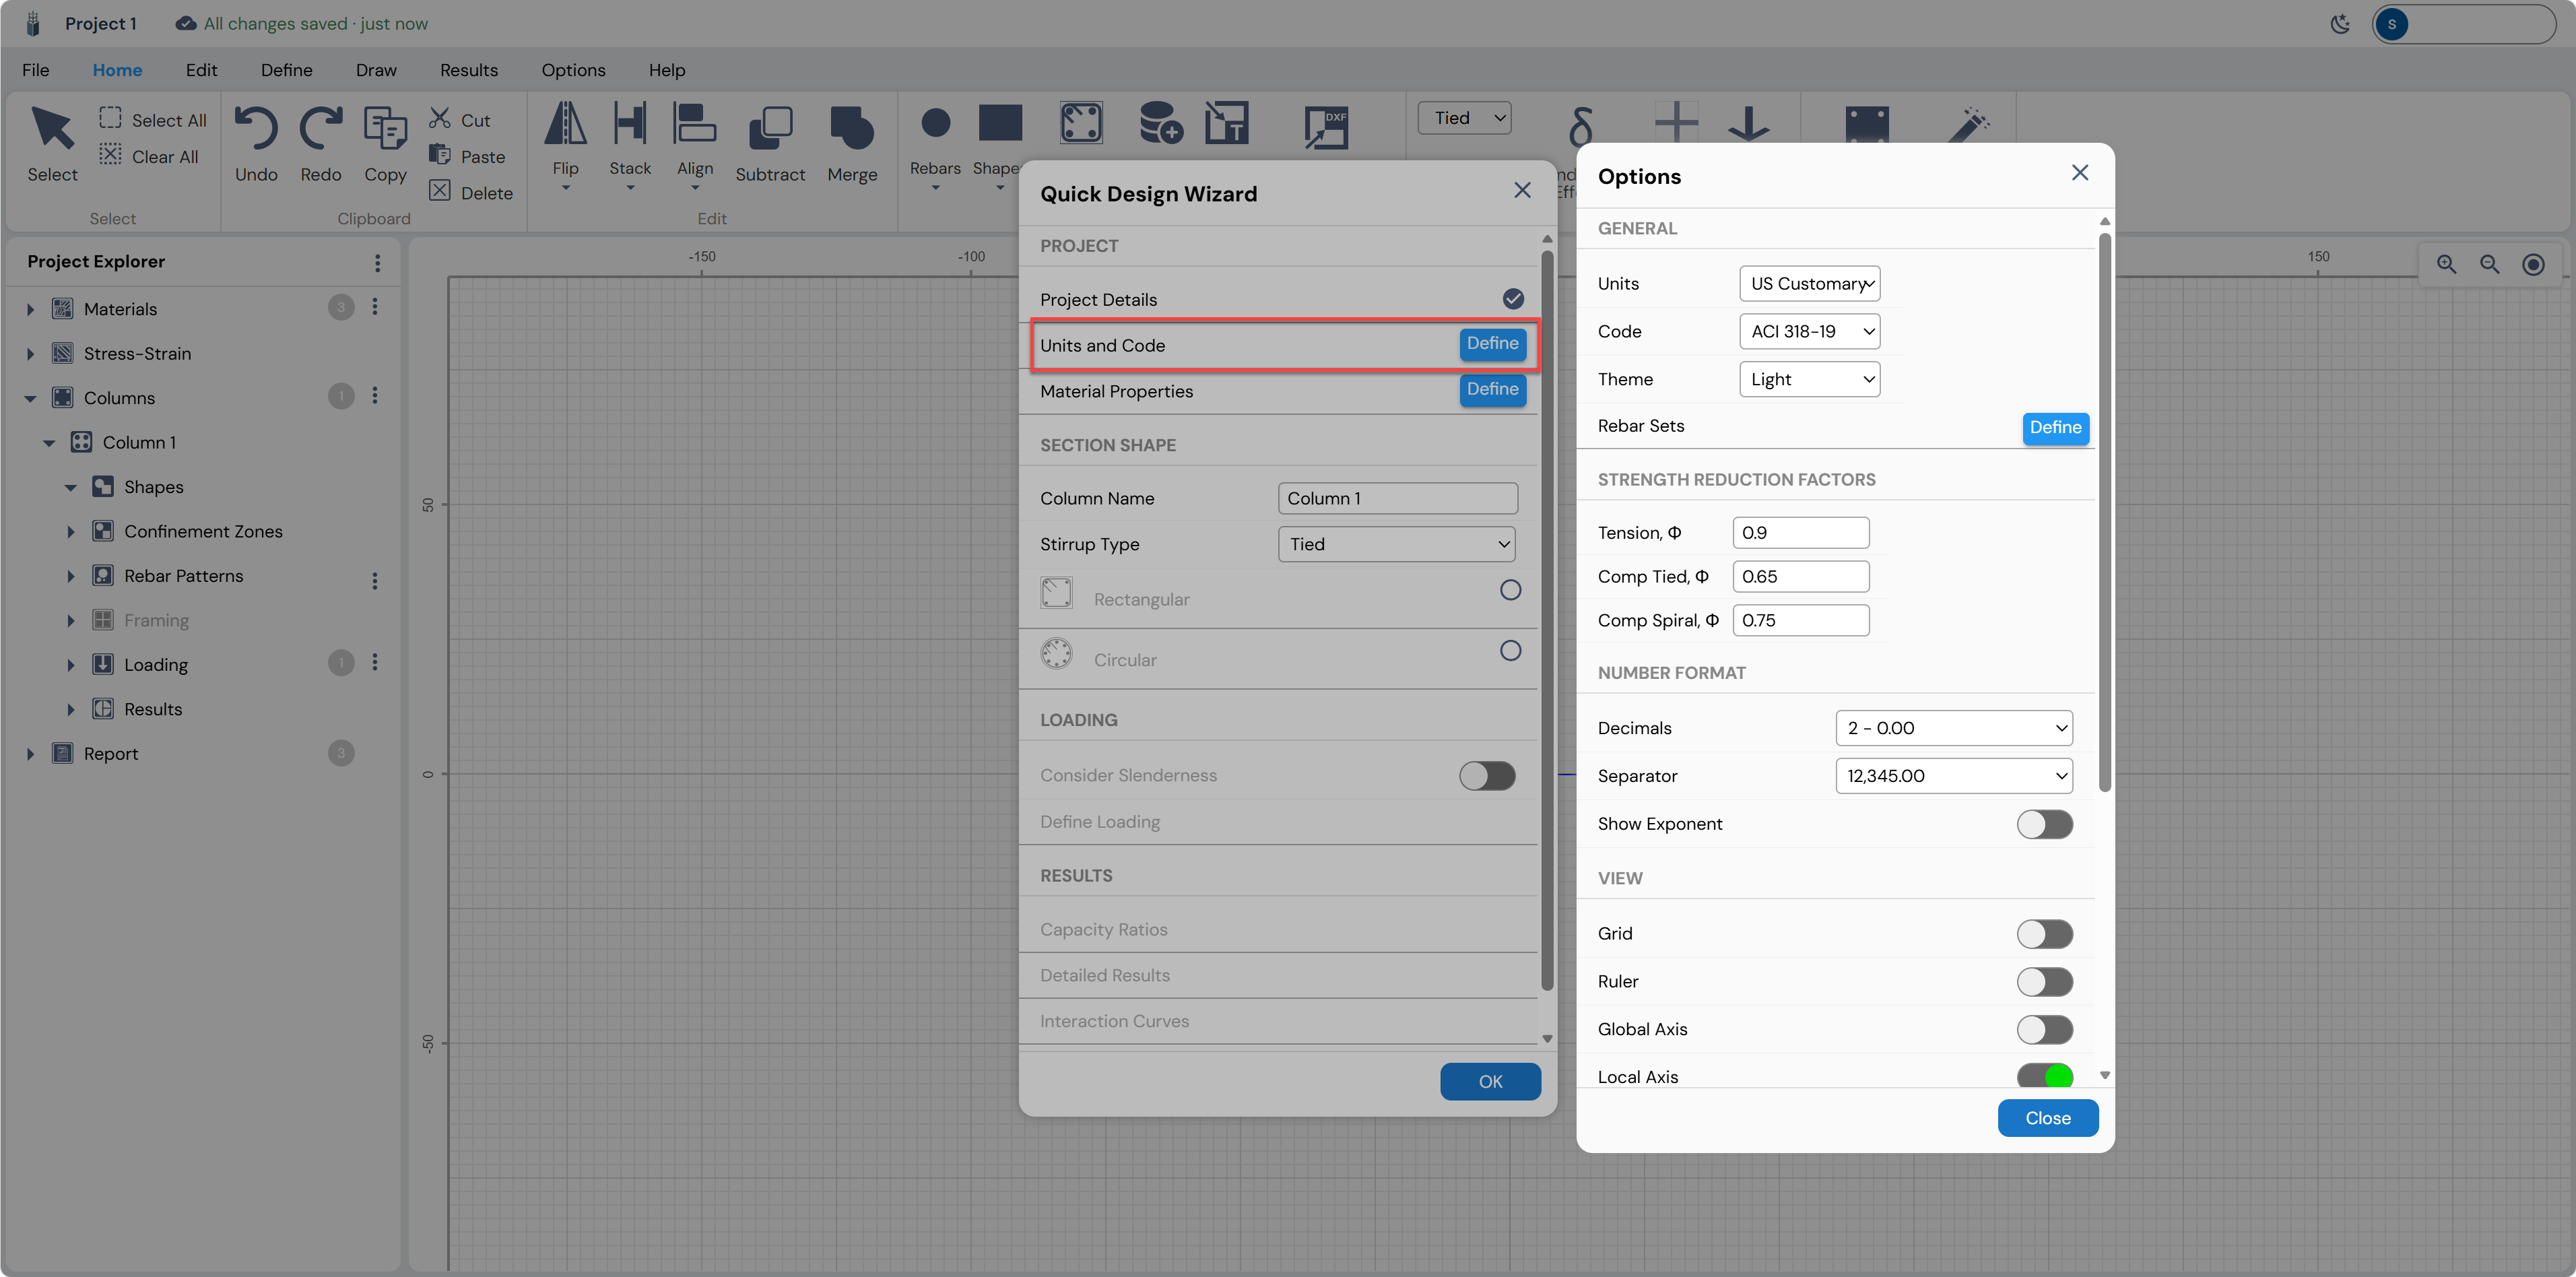
Units
Use the Units dropdown to select your preferred unit system. Available options include US Customary and SI (metric). For this tutorial, US Customary is selected.
Design Code
Open the Code dropdown to select the governing design standard. Eagle Eye supports a wide range of international codes. For this tutorial, select ACI 318-19.
Theme
The Theme dropdown allows switching between Light, Dark, and System appearance modes. This tutorial uses the Light theme.
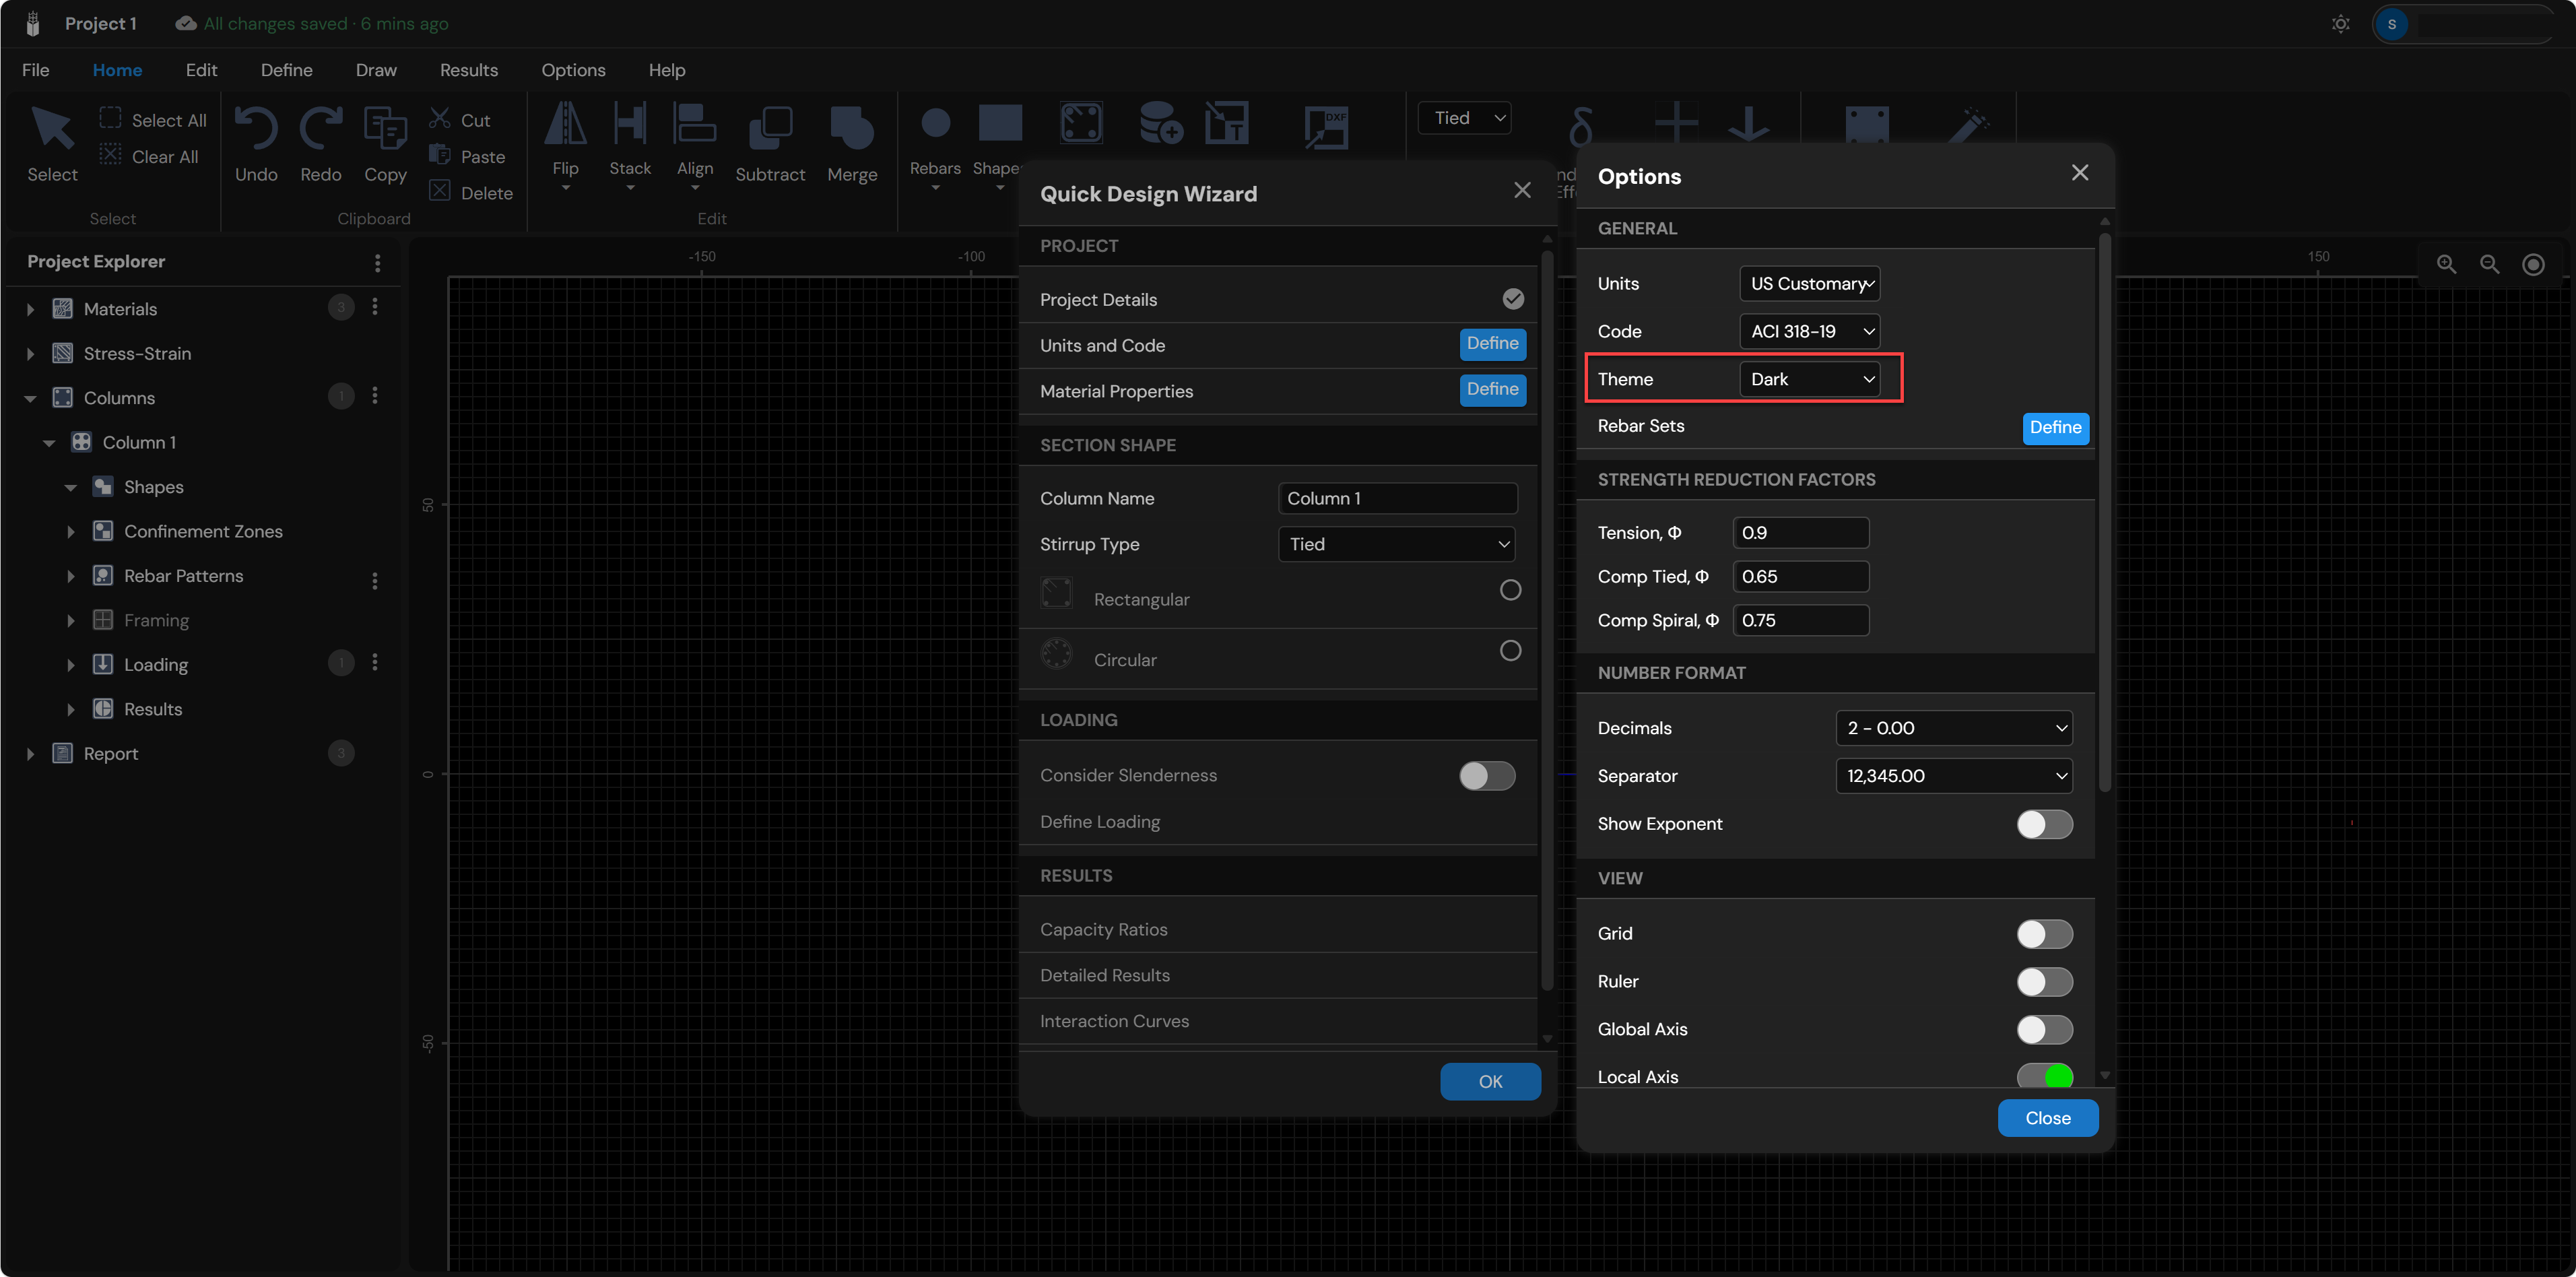
Rebar Sets
Click the Define button next to Rebar Sets to view and manage the available rebar sizes. Column Designer includes a standard set of ASTM bars (#2 through #18). Other rebar sets can be added using the Add button.
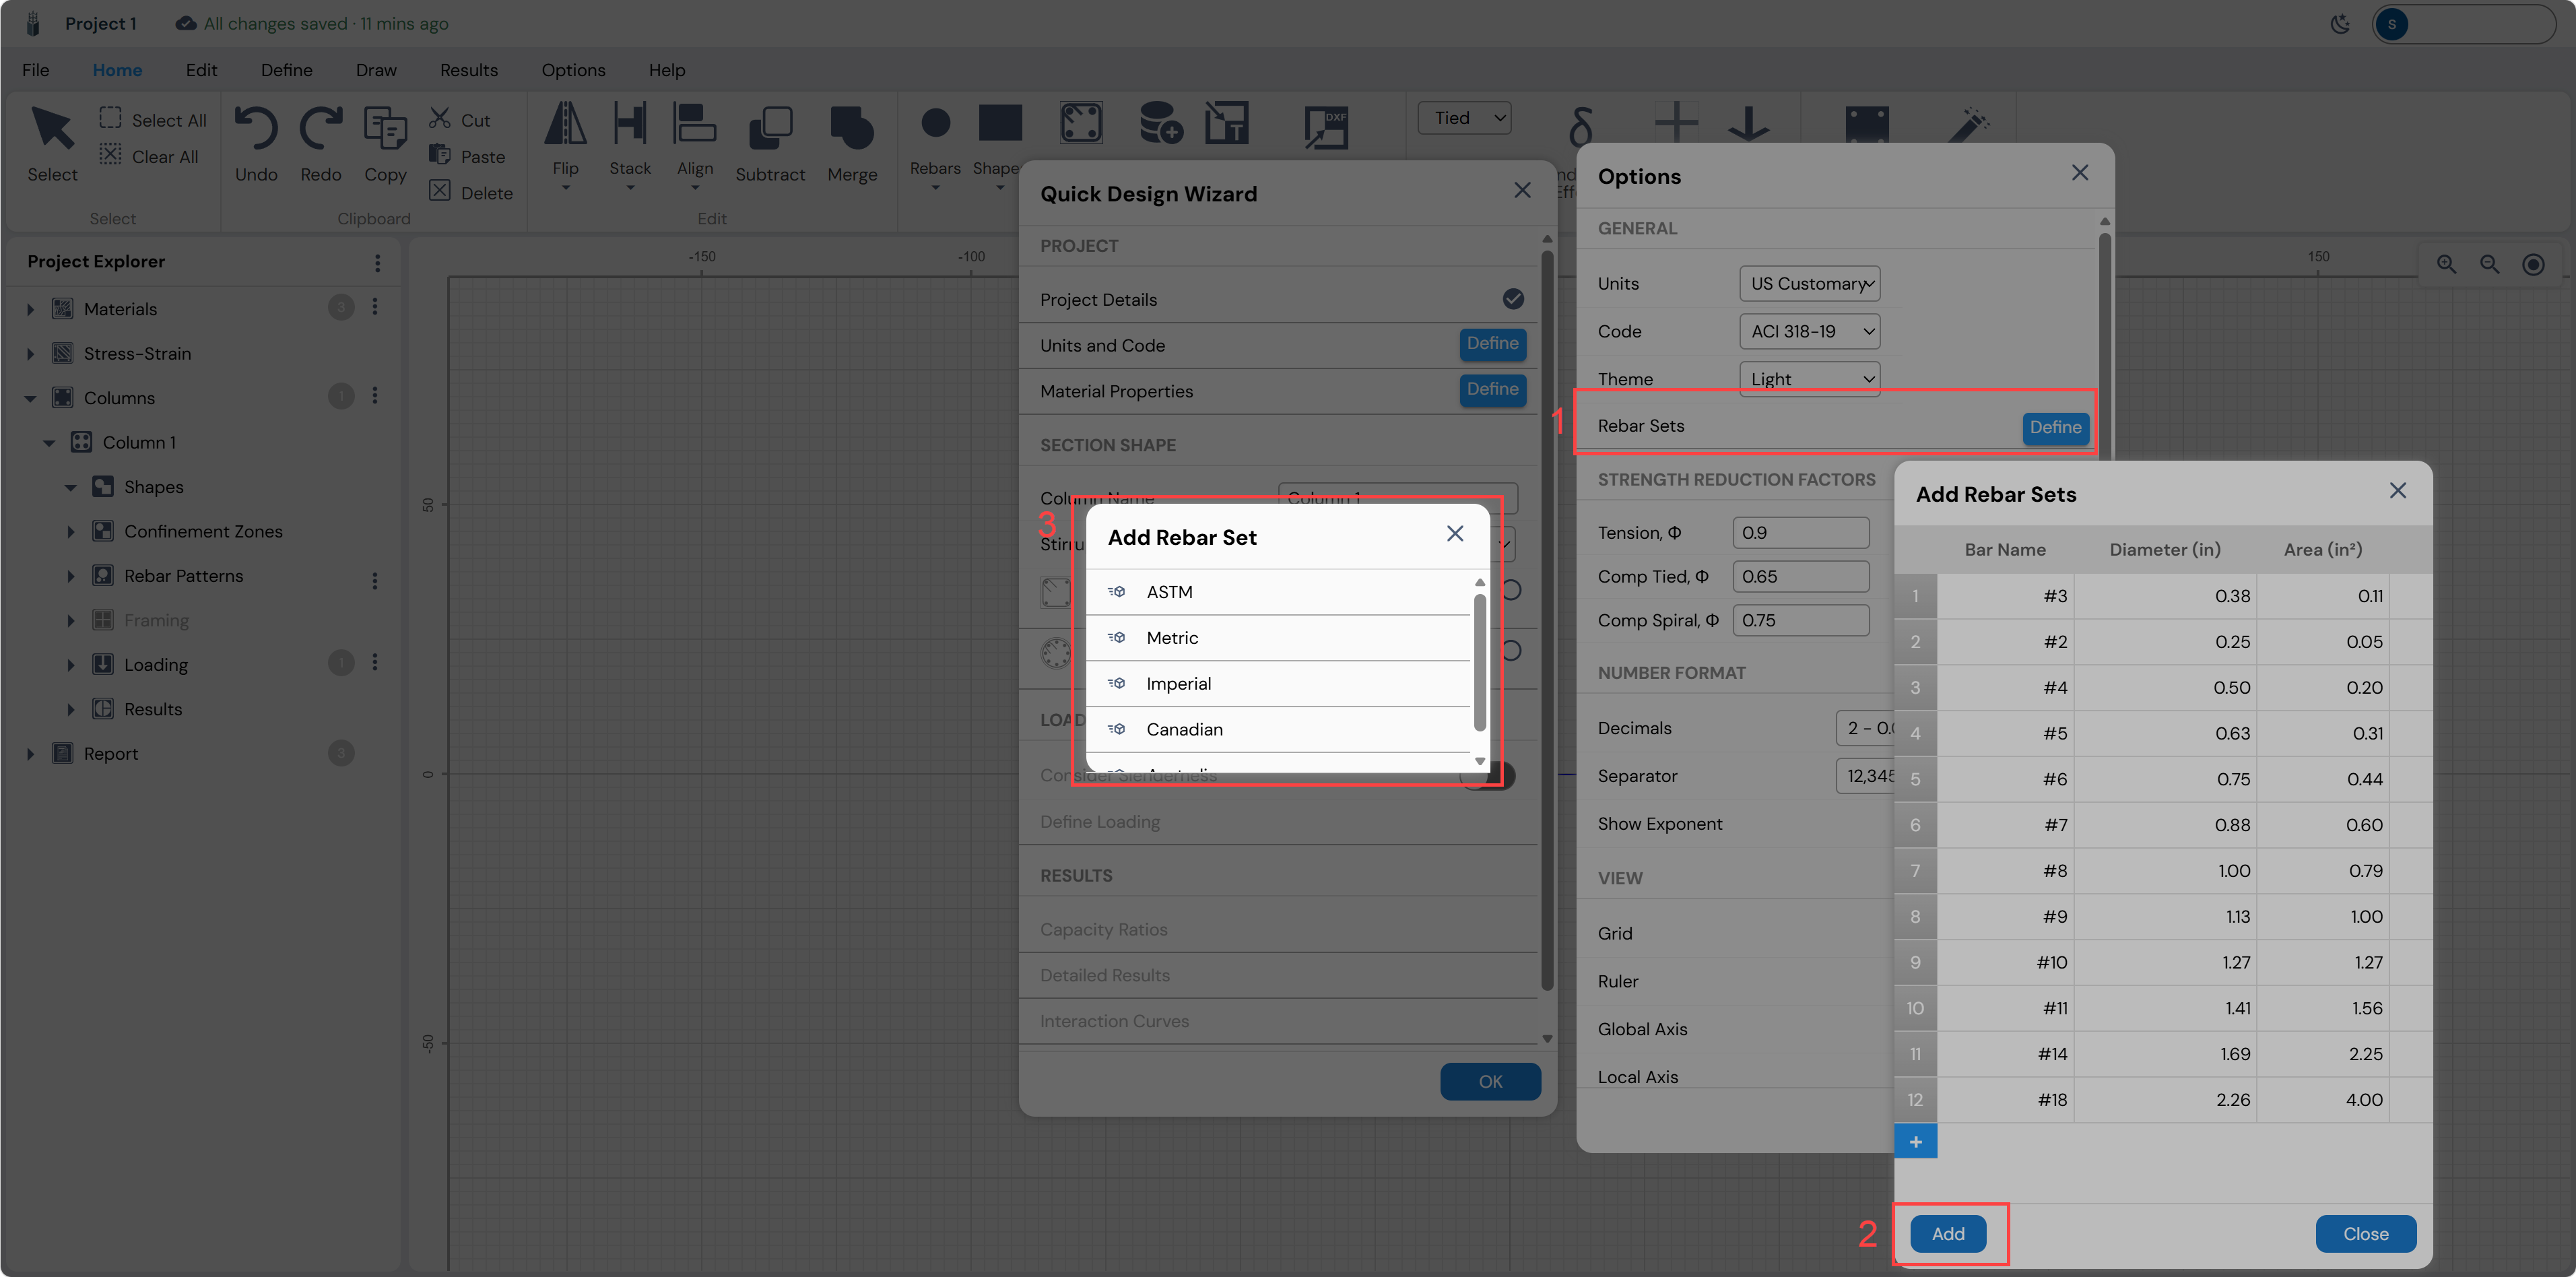
No modifications are needed for this tutorial. Close the Rebar Sets dialog.
Strength Reduction Factors
Scroll down in the Options dialog to review the Strength Reduction Factors (phi factors) defined by ACI 318-19:
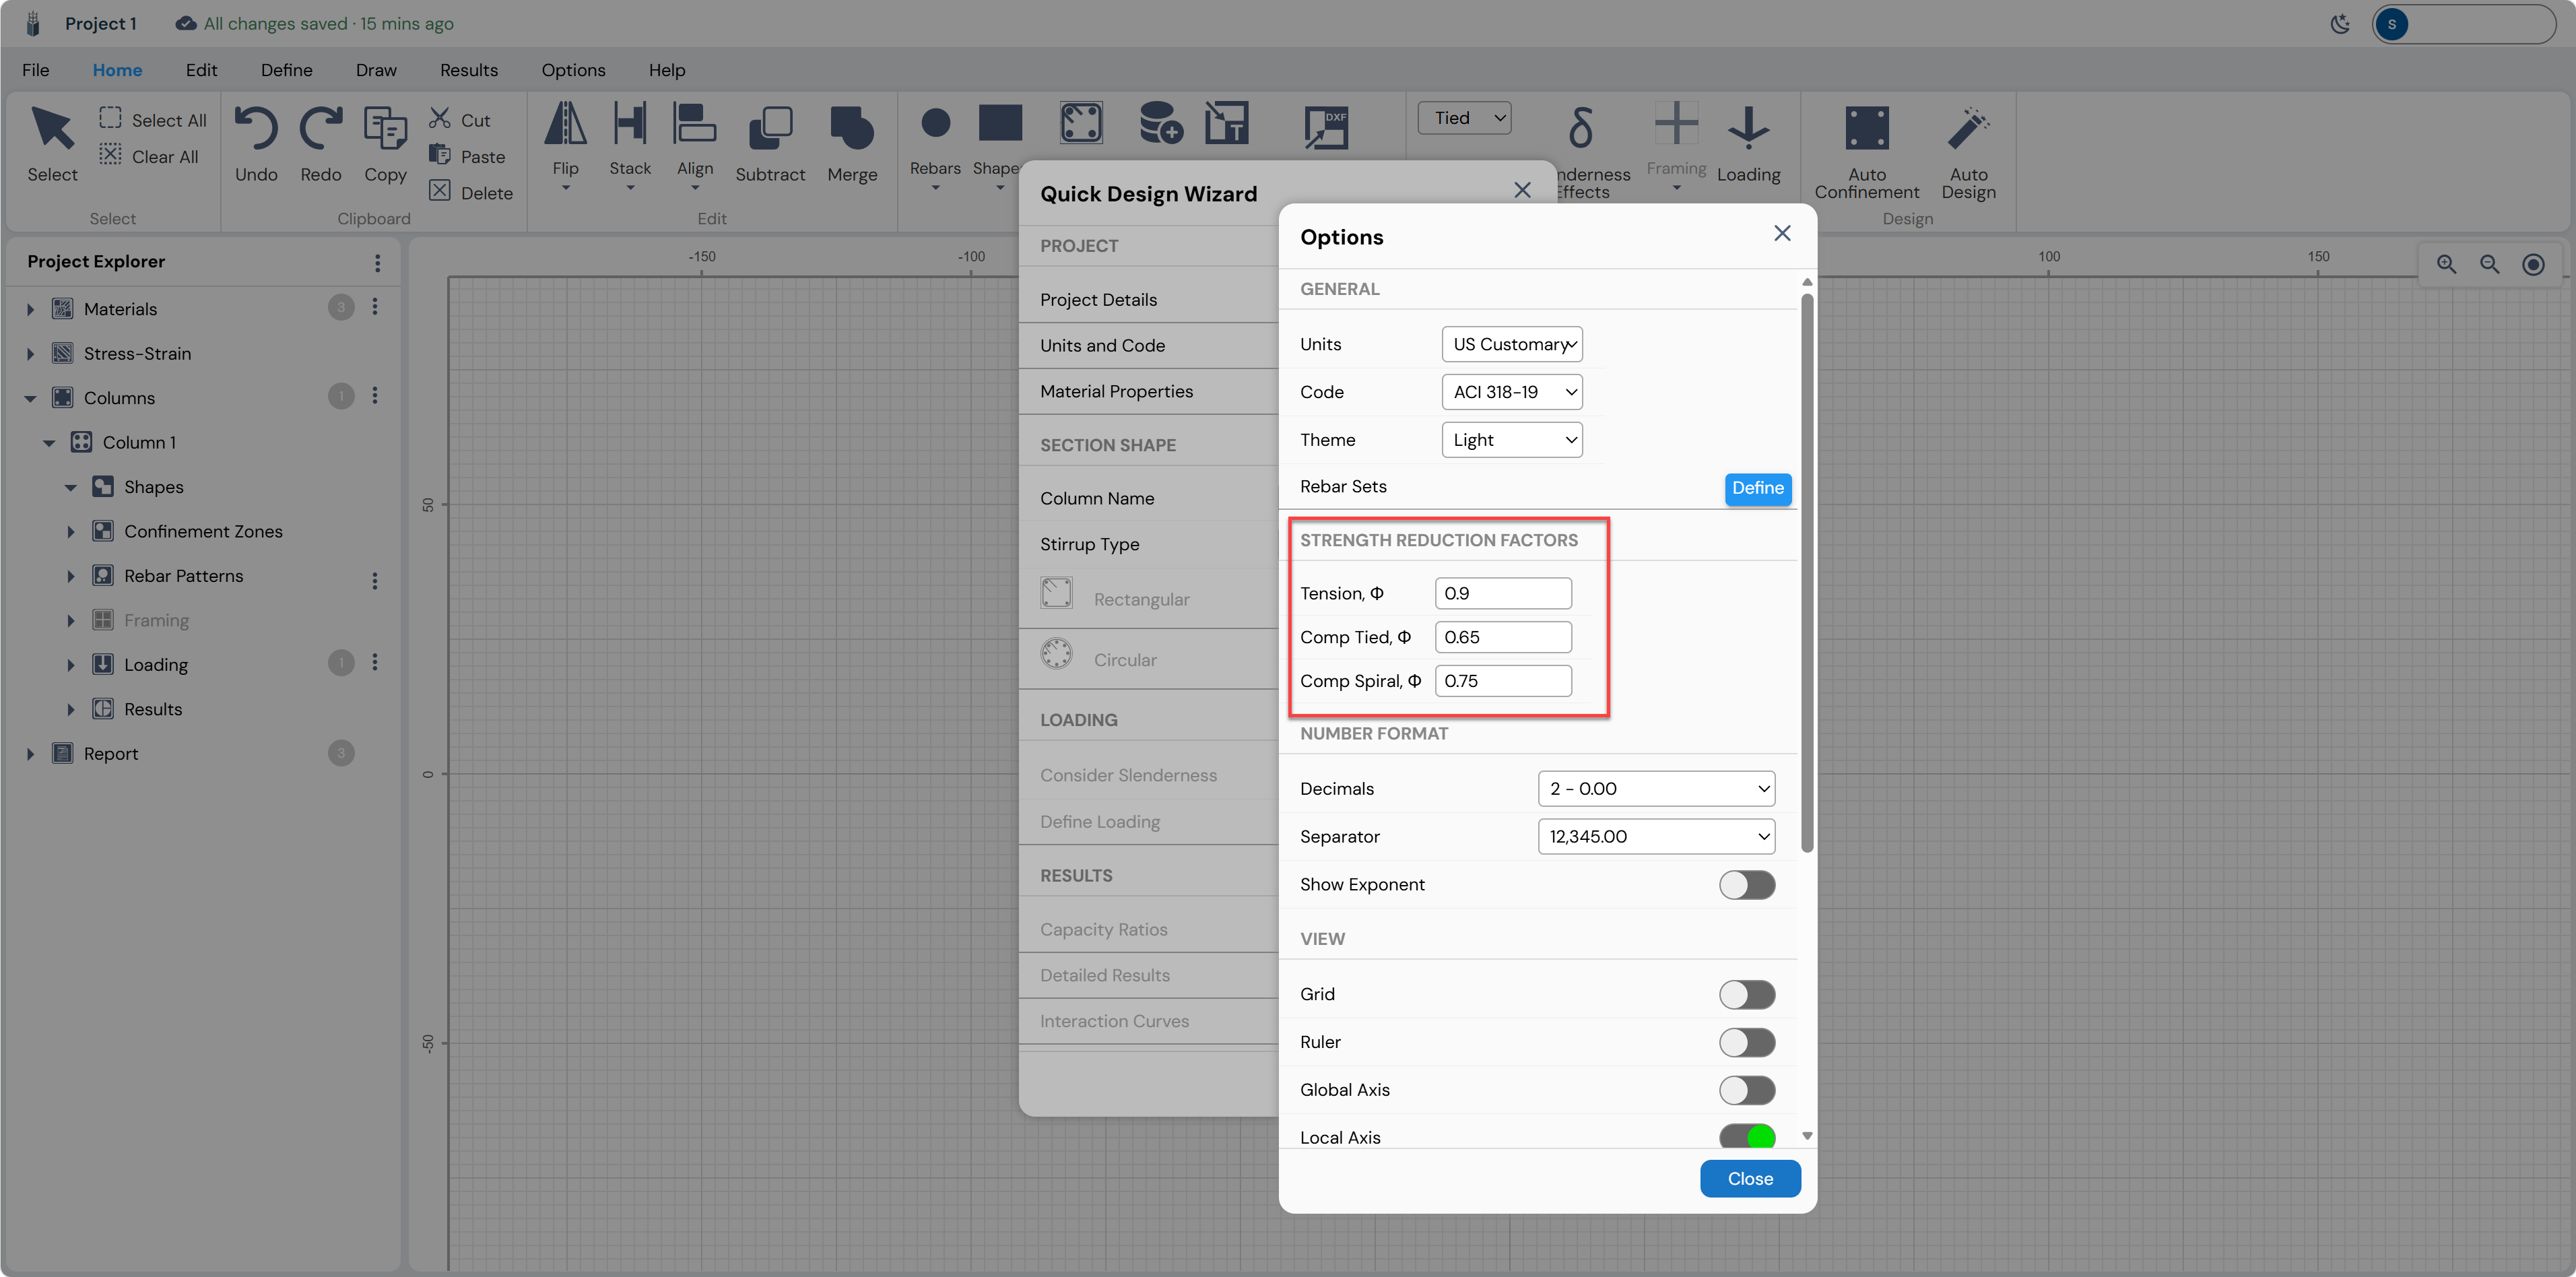
View and Diagram Options
The lower portion of the Options dialog controls display preferences including Grid, Ruler, Global/Local Axis visibility, interaction diagram resolution (Curves and Points), and Show Dimensioning. These can be adjusted at any time and do not affect calculation results. Enable Grid and Ruler for a cleaner drafting environment.
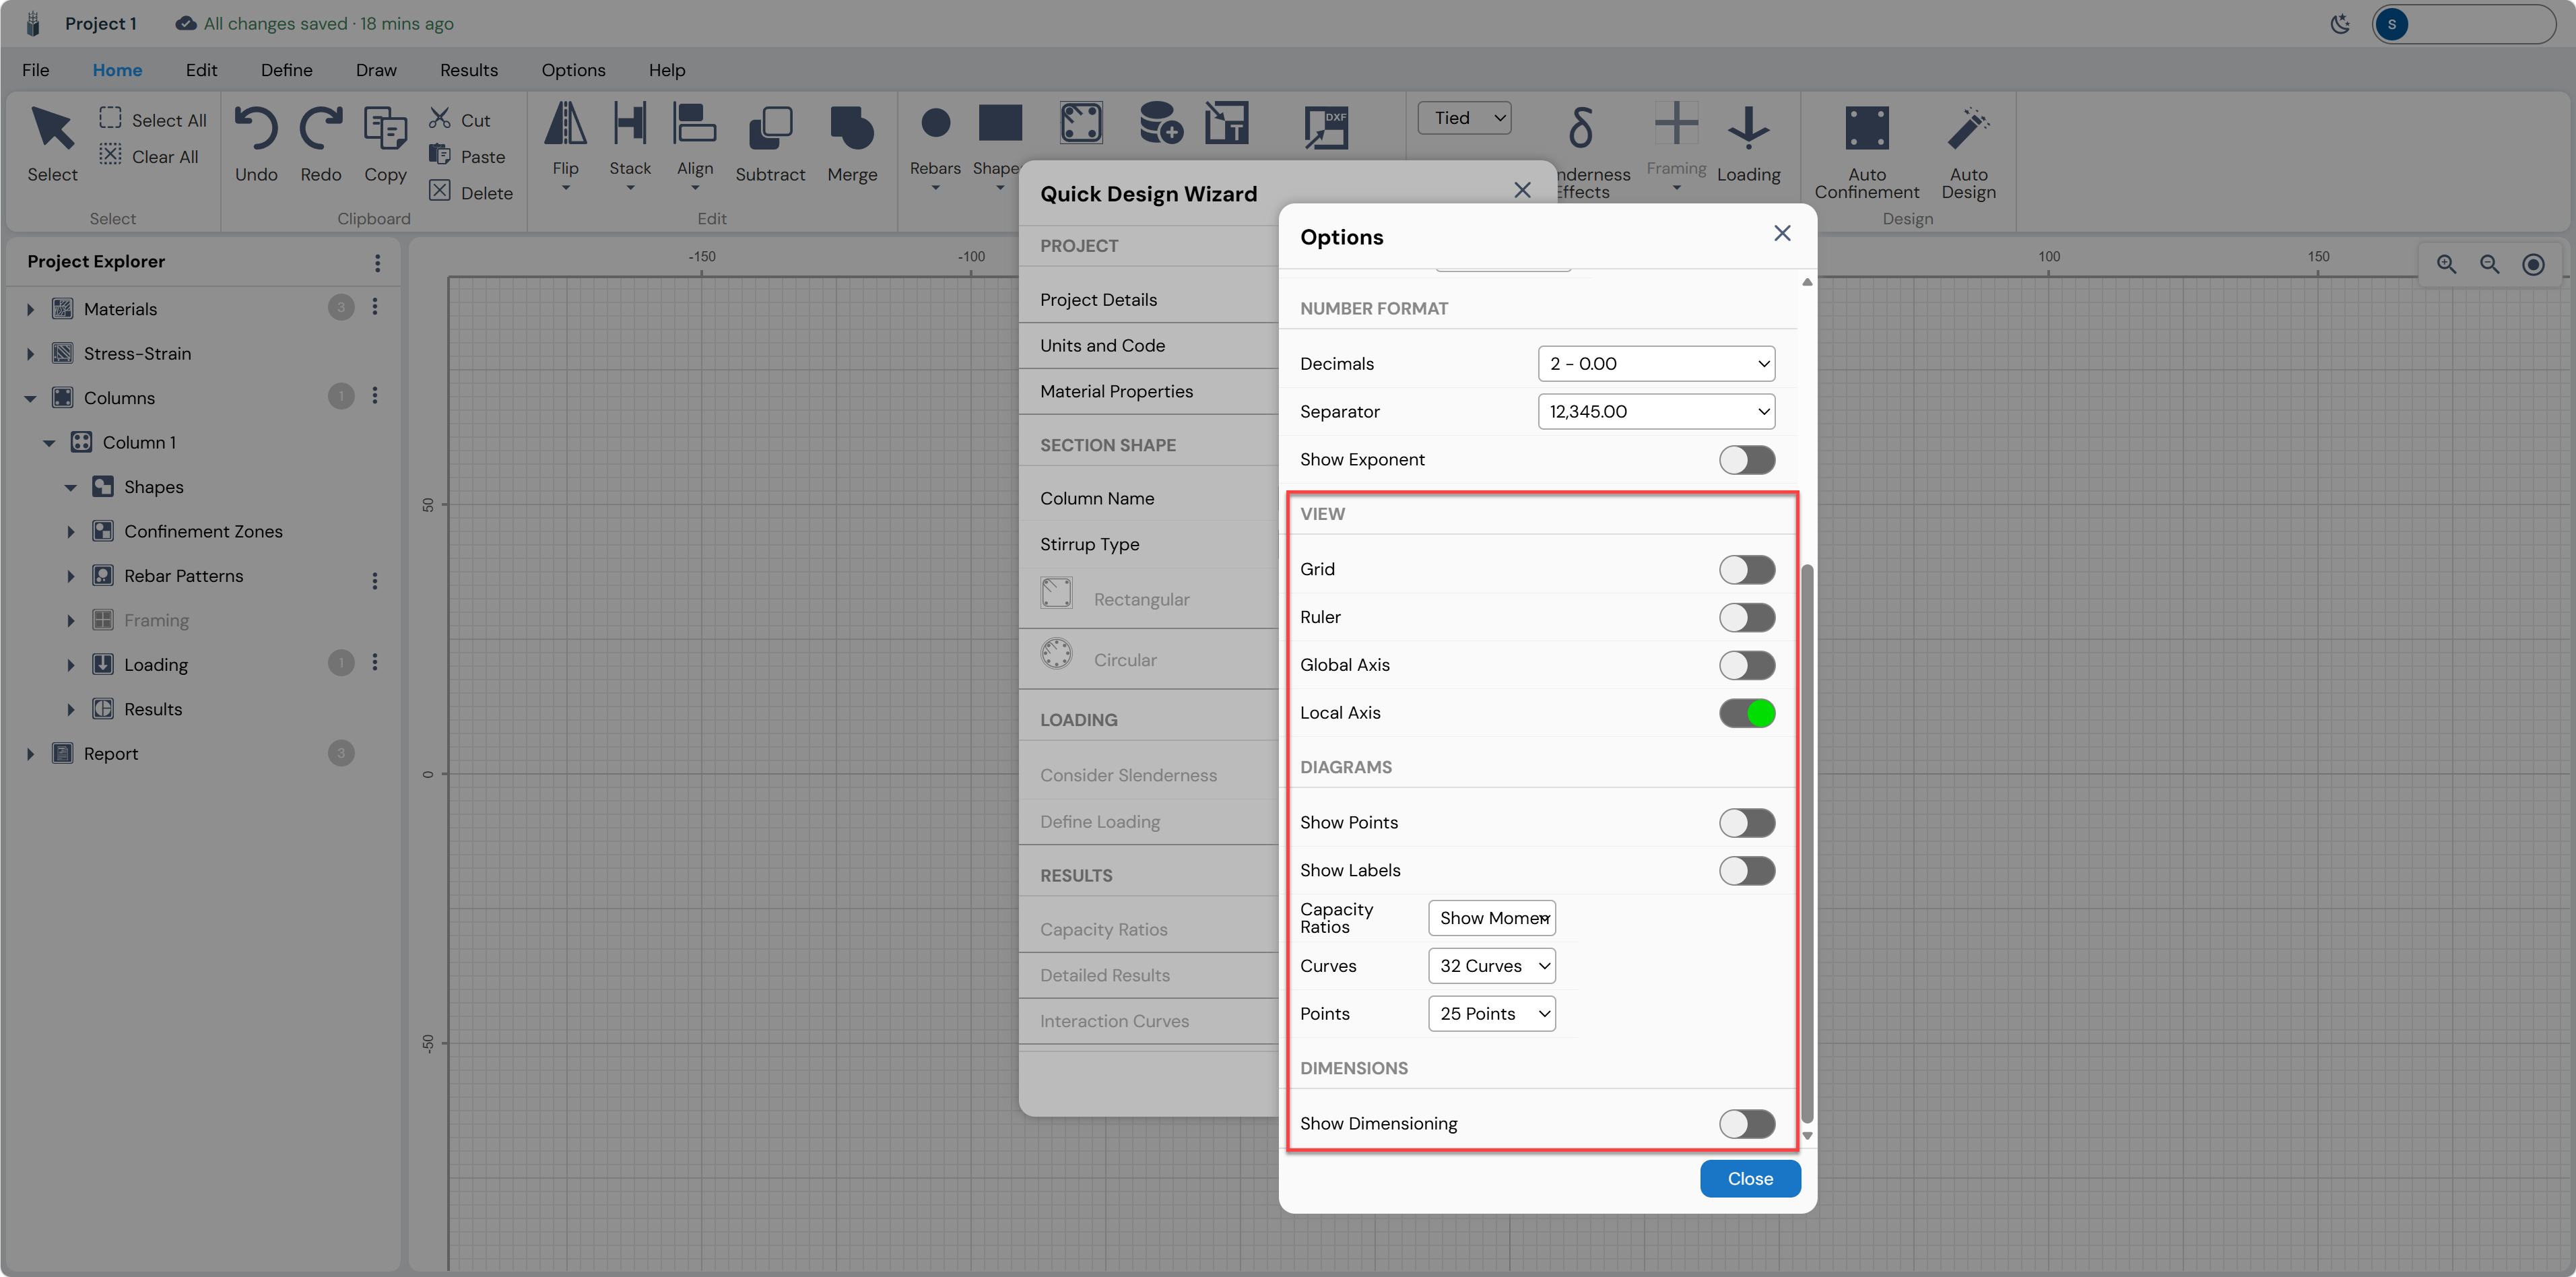
Click Close when done. The Units and Code row will show a blue checkmark (✓).
Material Properties
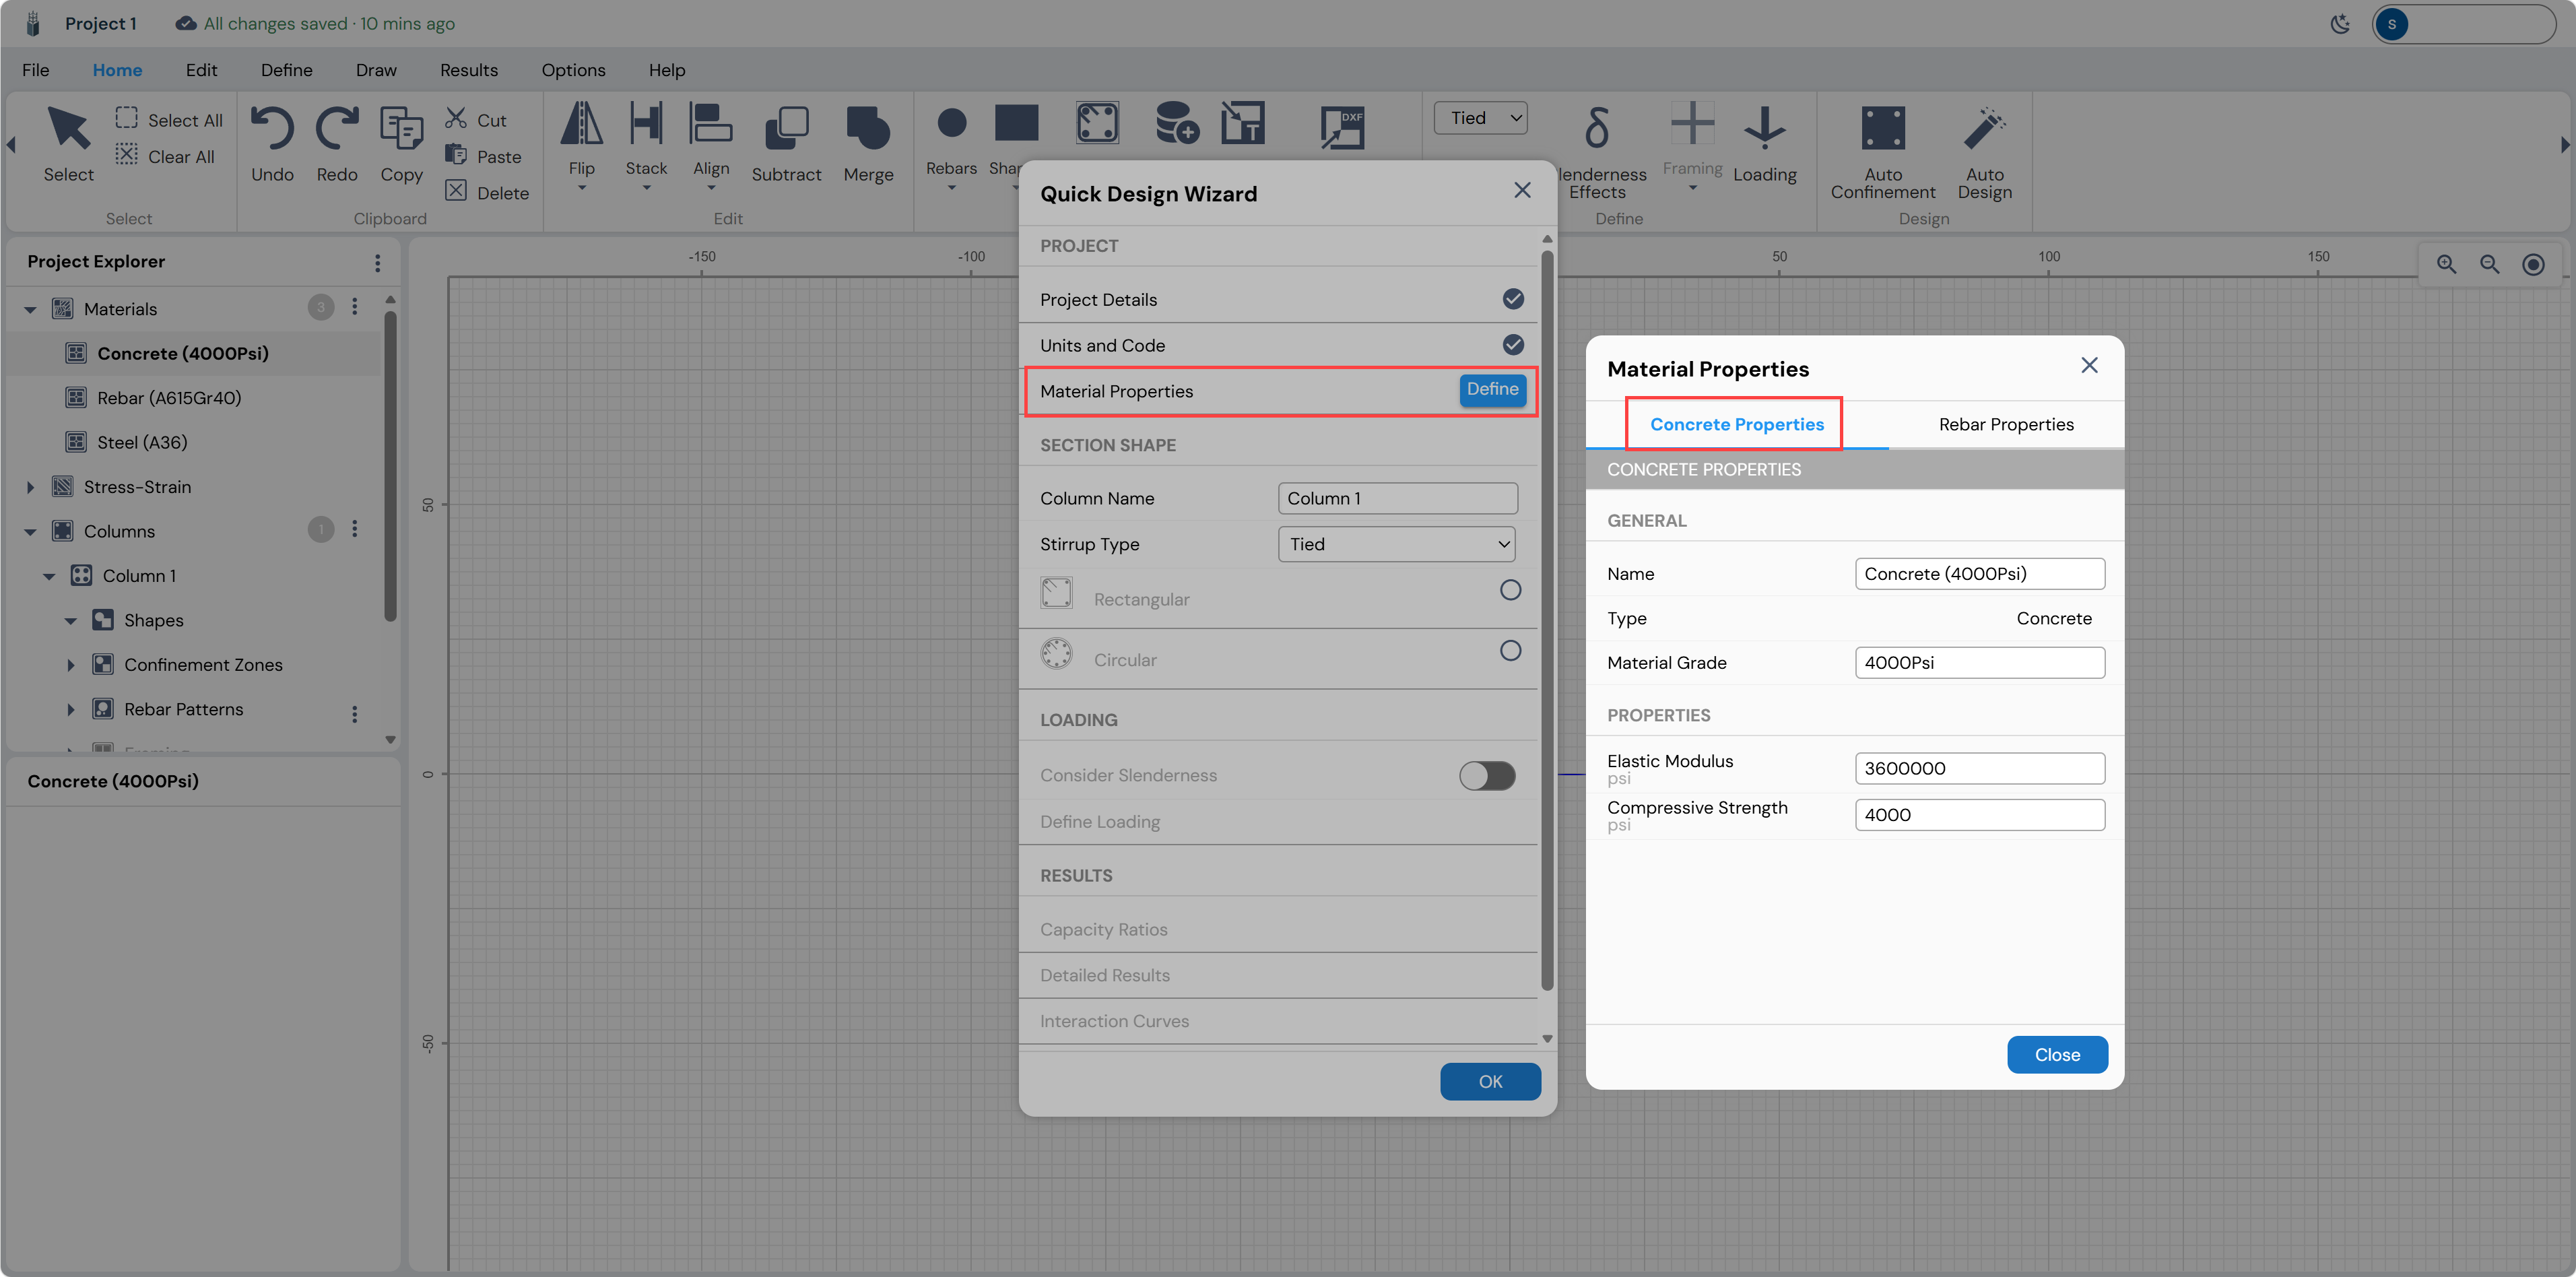
Click the Define button next to Material Properties. The Material Properties dialog opens with two tabs: Concrete Properties and Rebar Properties.
Concrete Properties
The Elastic Modulus is auto-calculated from the compressive strength using the ACI formula E = 57,000√f’c. Verify the values and proceed to the Rebar Properties tab.
Rebar Properties
Click the Rebar Properties tab.
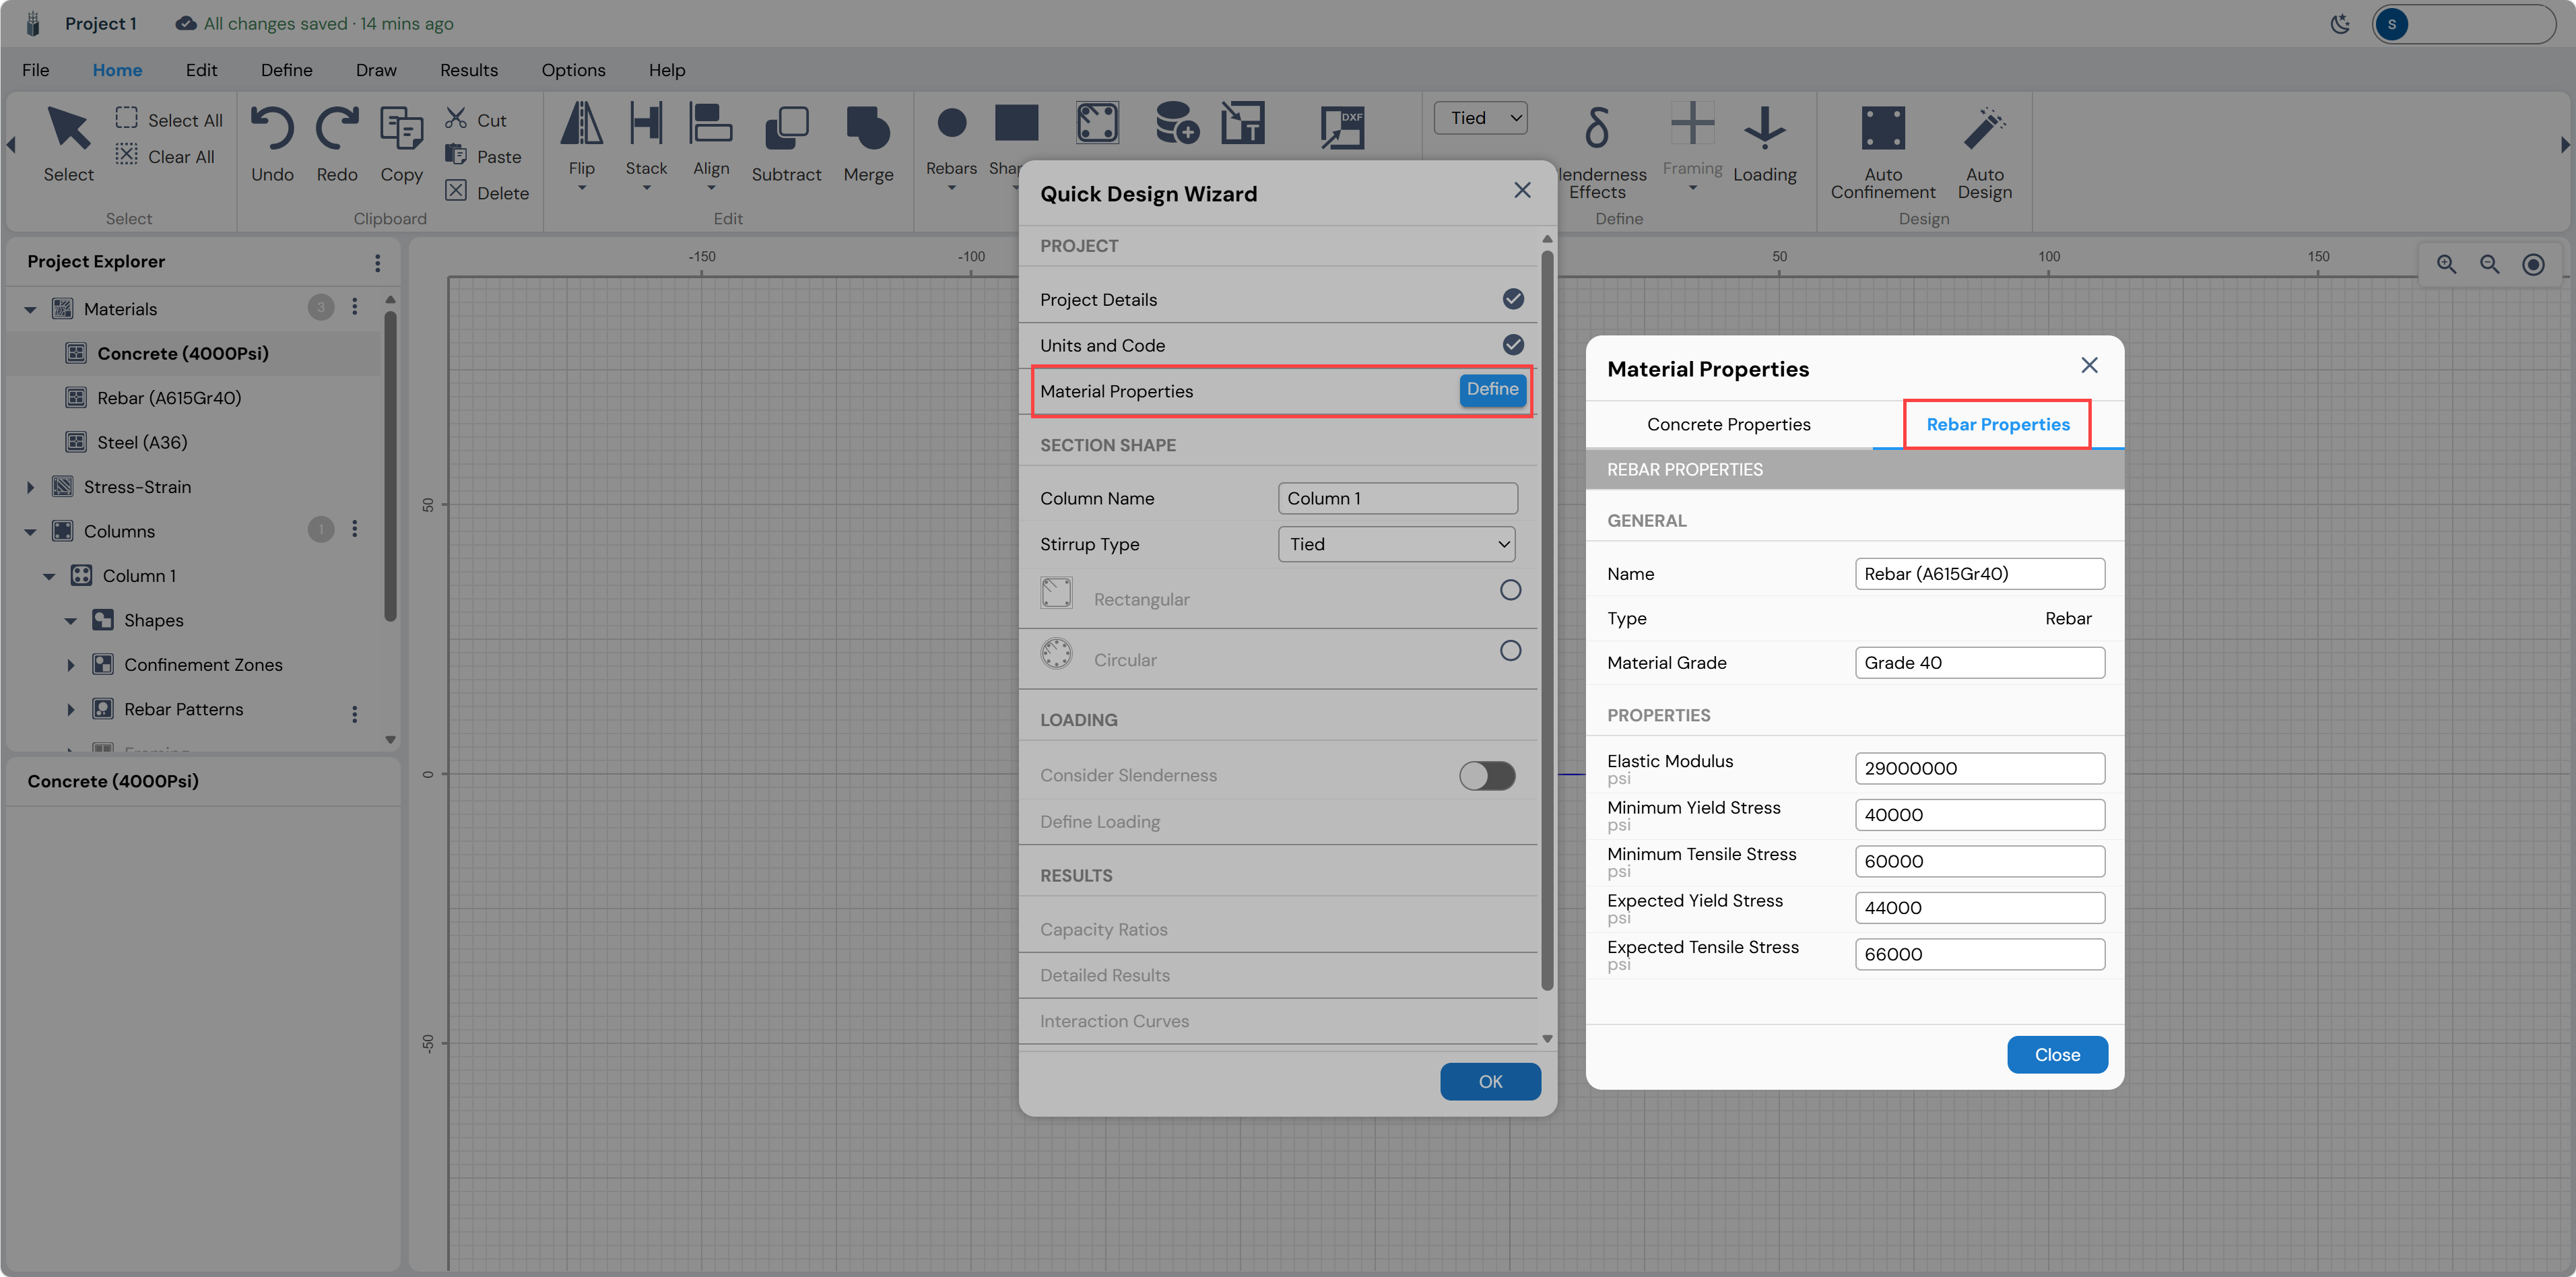
Click Close when done. The Material Properties row will show a blue checkmark (✓). The Project Explorer panel on the left side will now list the defined materials: Concrete (4000Psi), Rebar (A615Gr40), and Steel (A36).
Section Shape Definition
With all three PROJECT items checked, the SECTION SHAPE section of the wizard becomes active. Here you name the column, select the stirrup type, and choose the cross-section geometry.
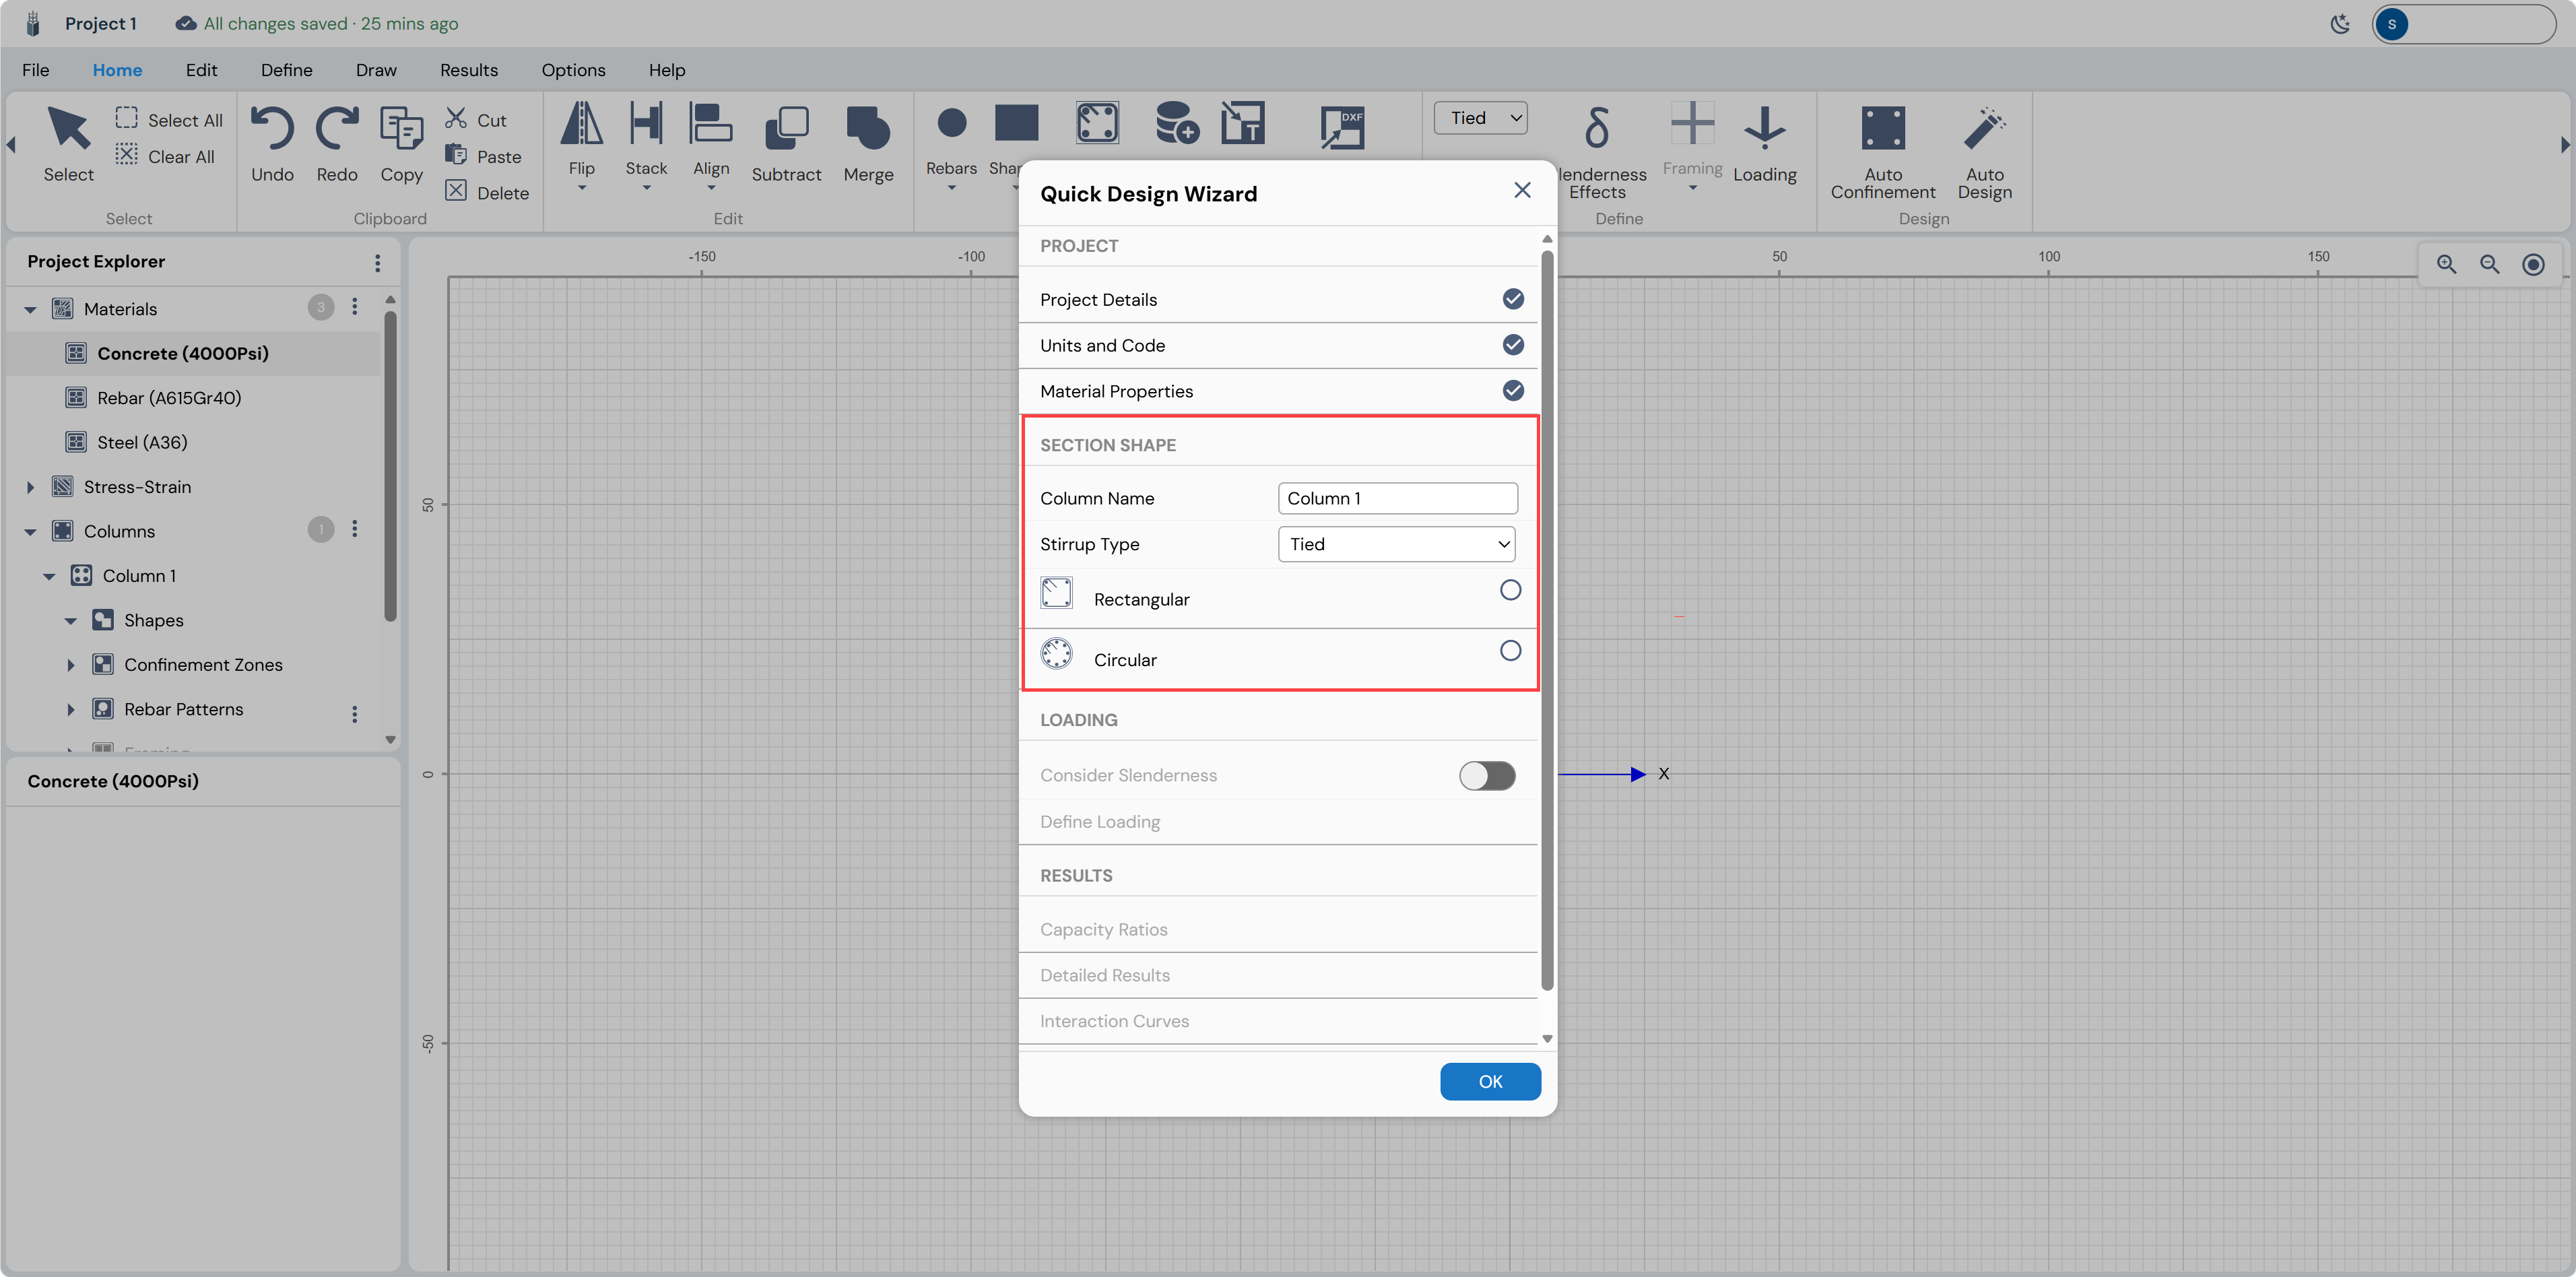
| Field | Option / Value | Notes |
|---|---|---|
| Column Name | Column 1 | Identifier used in reports and the Project Explorer |
| Stirrup Type | Tied | Alternative: Spiral (for circular columns with spiral reinforcement) |
| Shape | Rectangular | Click the Rectangular button; the shape icon activates |
Rectangular Column Dialog
Click the Rectangular shape icon to open the Rectangular Column dialog. A cross-section preview is shown on the right, updating as you change parameters.
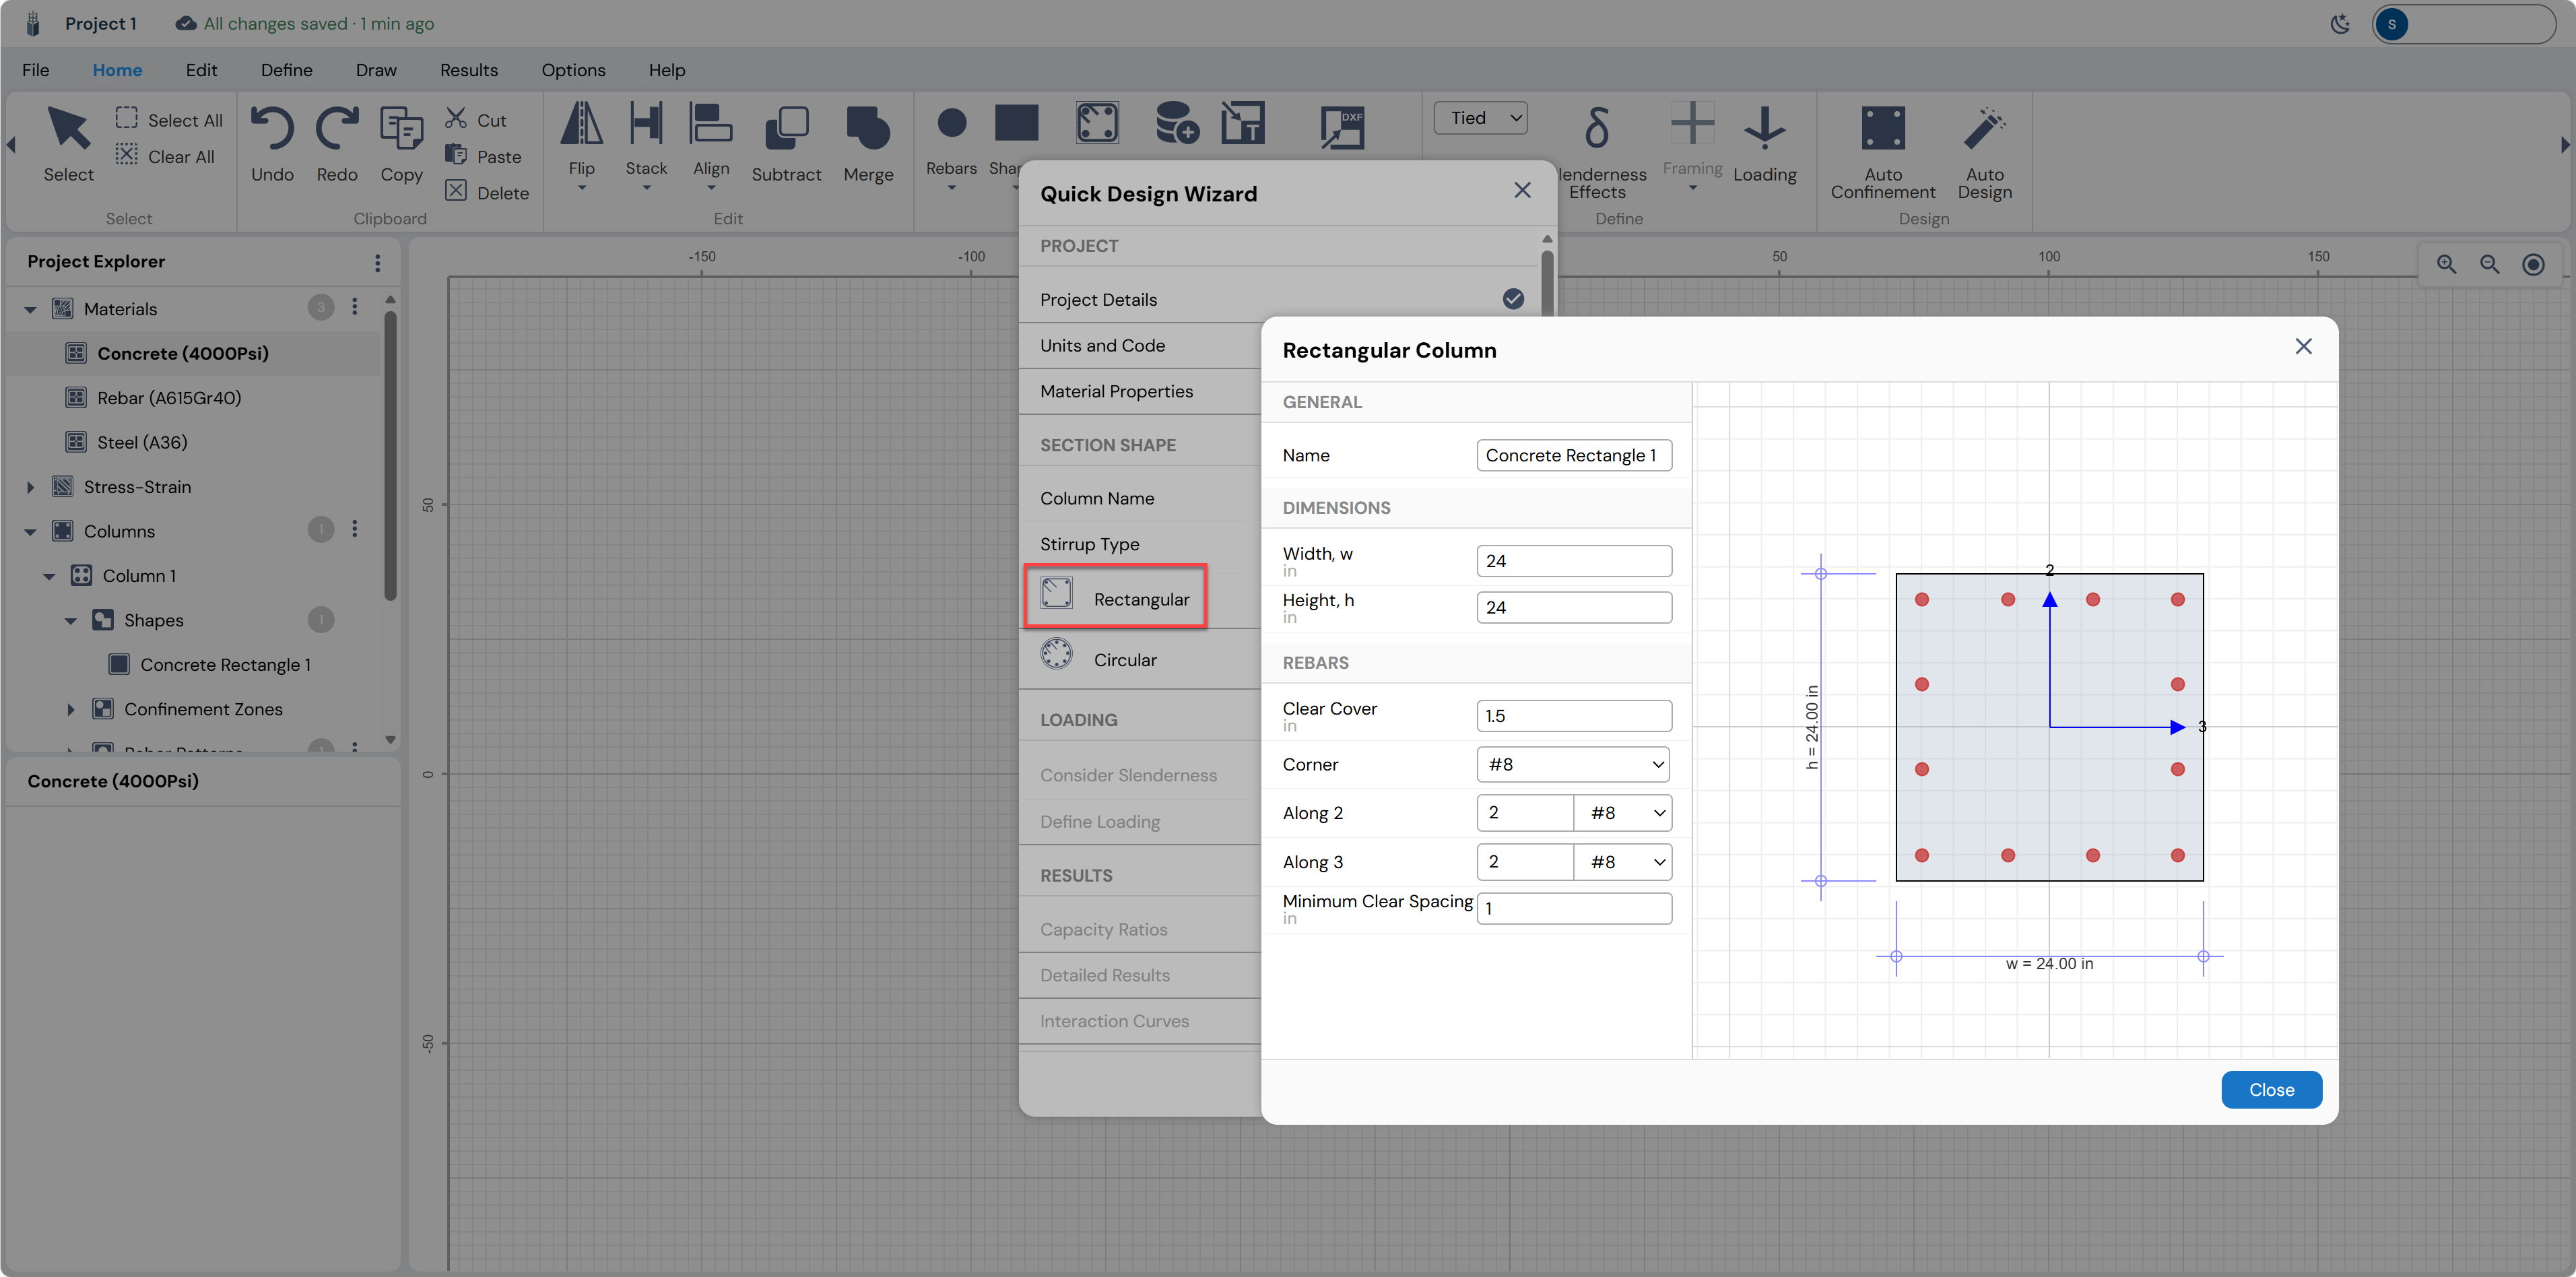
Dimensions
| Parameter | Value | Units | Description |
|---|---|---|---|
| Width, w | 24 | in | Cross-section width (horizontal dimension) |
| Height, h | 24 | in | Cross-section height (vertical dimension) |
Reinforcement (Rebars)
The rebar layout is defined using four parameters:
| Parameter | Value | Description |
|---|---|---|
| Clear Cover | 1.5 in | Clear distance from concrete face to outer stirrup face |
| Corner | #8 | Bar size placed at the four corners of the cross-section |
| Along 2 | 2 × #8 | Number and size of bars along the width (axis 2 face) |
| Along 3 | 2 × #8 | Number and size of bars along the height (axis 3 face) |
| Minimum Clear Spacing | 1 in | Minimum clear gap between adjacent bars (ACI minimum: 1.5× bar dia.) |
Click Close to confirm the section definition. The Rectangular row in the wizard will activate with a checkmark.
Loading
The LOADING section of the wizard allows you to consider slenderness effects and define factored load combinations. For most short RC columns, slenderness can be neglected.
Consider Slenderness
The Consider Slenderness toggle is off by default. For stocky columns with small slenderness ratio, leaving this toggle off is appropriate. Enabling it will activate slenderness effect calculations per selected design code.
Define Loading
Click Define Loading. The Define Loading dialog opens, showing a table where you enter factored load combinations. Each row corresponds to one load combination.
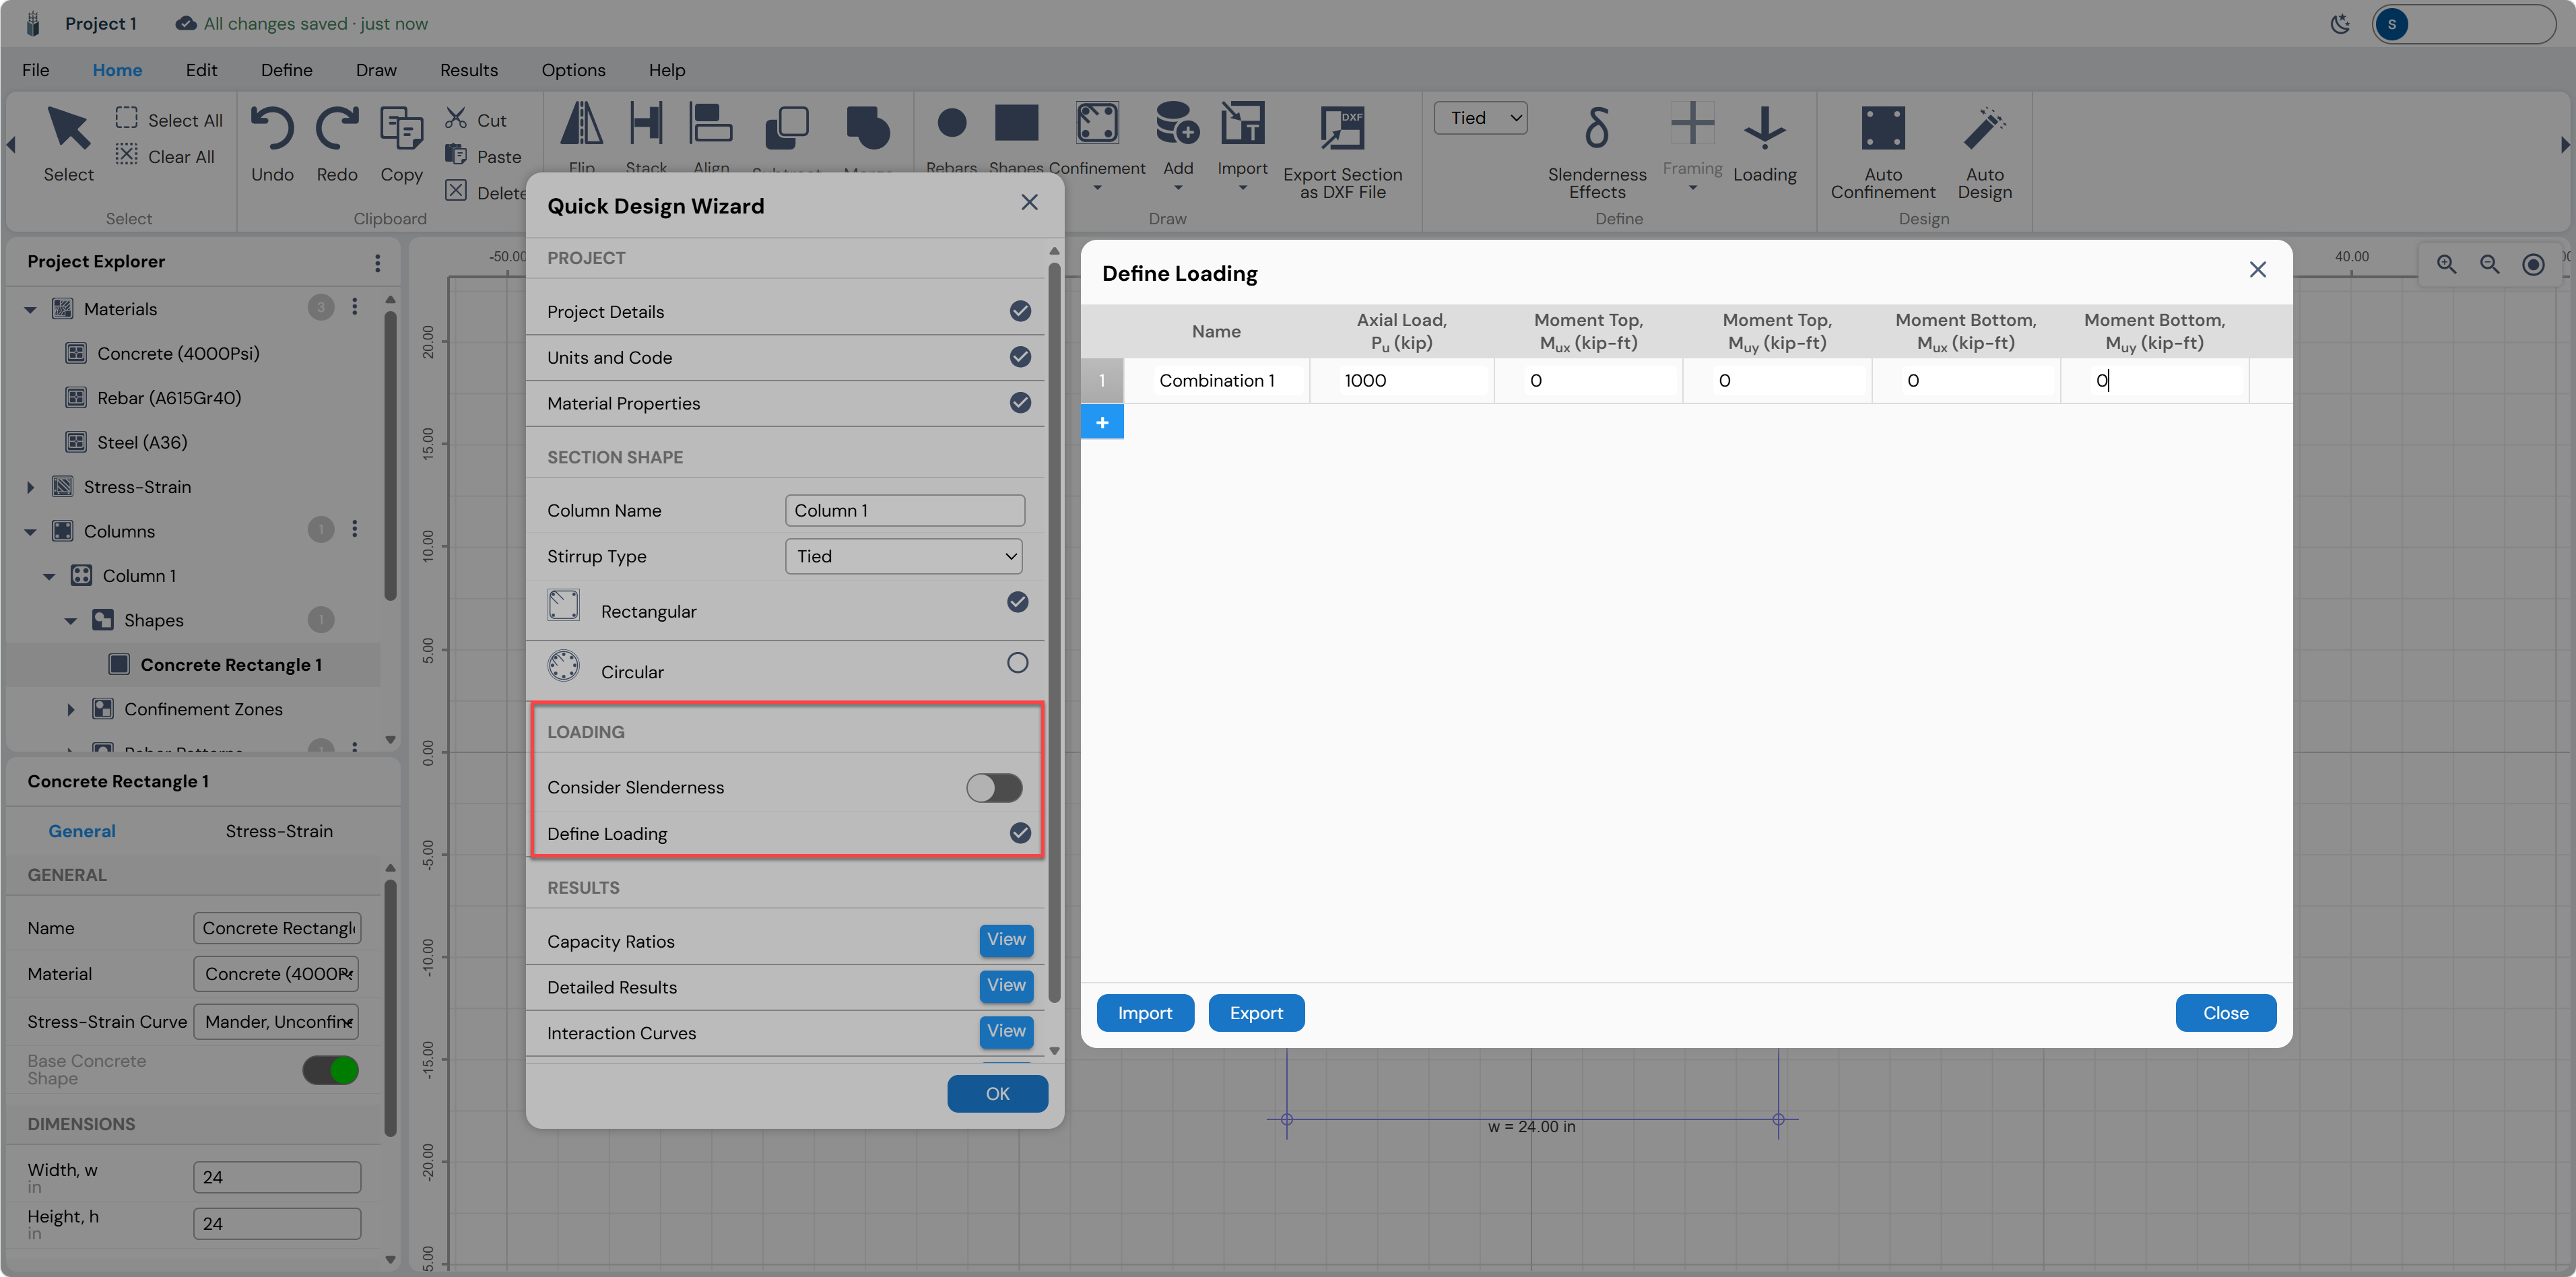
Each row in the loading table contains the following columns:
| Column | Symbol | Units | Description |
|---|---|---|---|
| Name | — | — | User-assigned label for the combination (e.g., Combination 1) |
| Axial Load | Pu | kip | Factored axial compressive load (positive = compression) |
| Moment Top Mux | Mux-Top | kip-ft | Factored moment at the top of the column about the X-axis |
| Moment Top Muy | Muy-Top | kip-ft | Factored moment at the top of the column about the Y-axis |
| Moment Bottom Mux | Mux-Bot | kip-ft | Factored moment at the bottom of the column about the X-axis |
| Moment Bottom Muy | Muy-Bot | kip-ft | Factored moment at the bottom of the column about the Y-axis |
For this tutorial example, enter the following single load combination:
| Name | Pu (kip) | Mux-Top (kip-ft) | Muy-Top (kip-ft) | Mux-Bot (kip-ft) | Muy-Bot (kip-ft) |
|---|---|---|---|---|---|
| Combination 1 | 1000 | 0.00 | 0.00 | 0.00 | 0.00 |
| Use the + button to add more rows for additional load combinations. Click the ⊗ icon on the right to delete a row. The Import/Export buttons allow loading combinations from a CSV file. |
|---|
Click Close when done. The Define Loading row will show a blue checkmark (✓).
Reviewing Results
With all input sections complete, the RESULTS area of the wizard becomes active and offers four viewing options: Capacity Ratios, Detailed Results, Interaction Curves, and Generate Report.
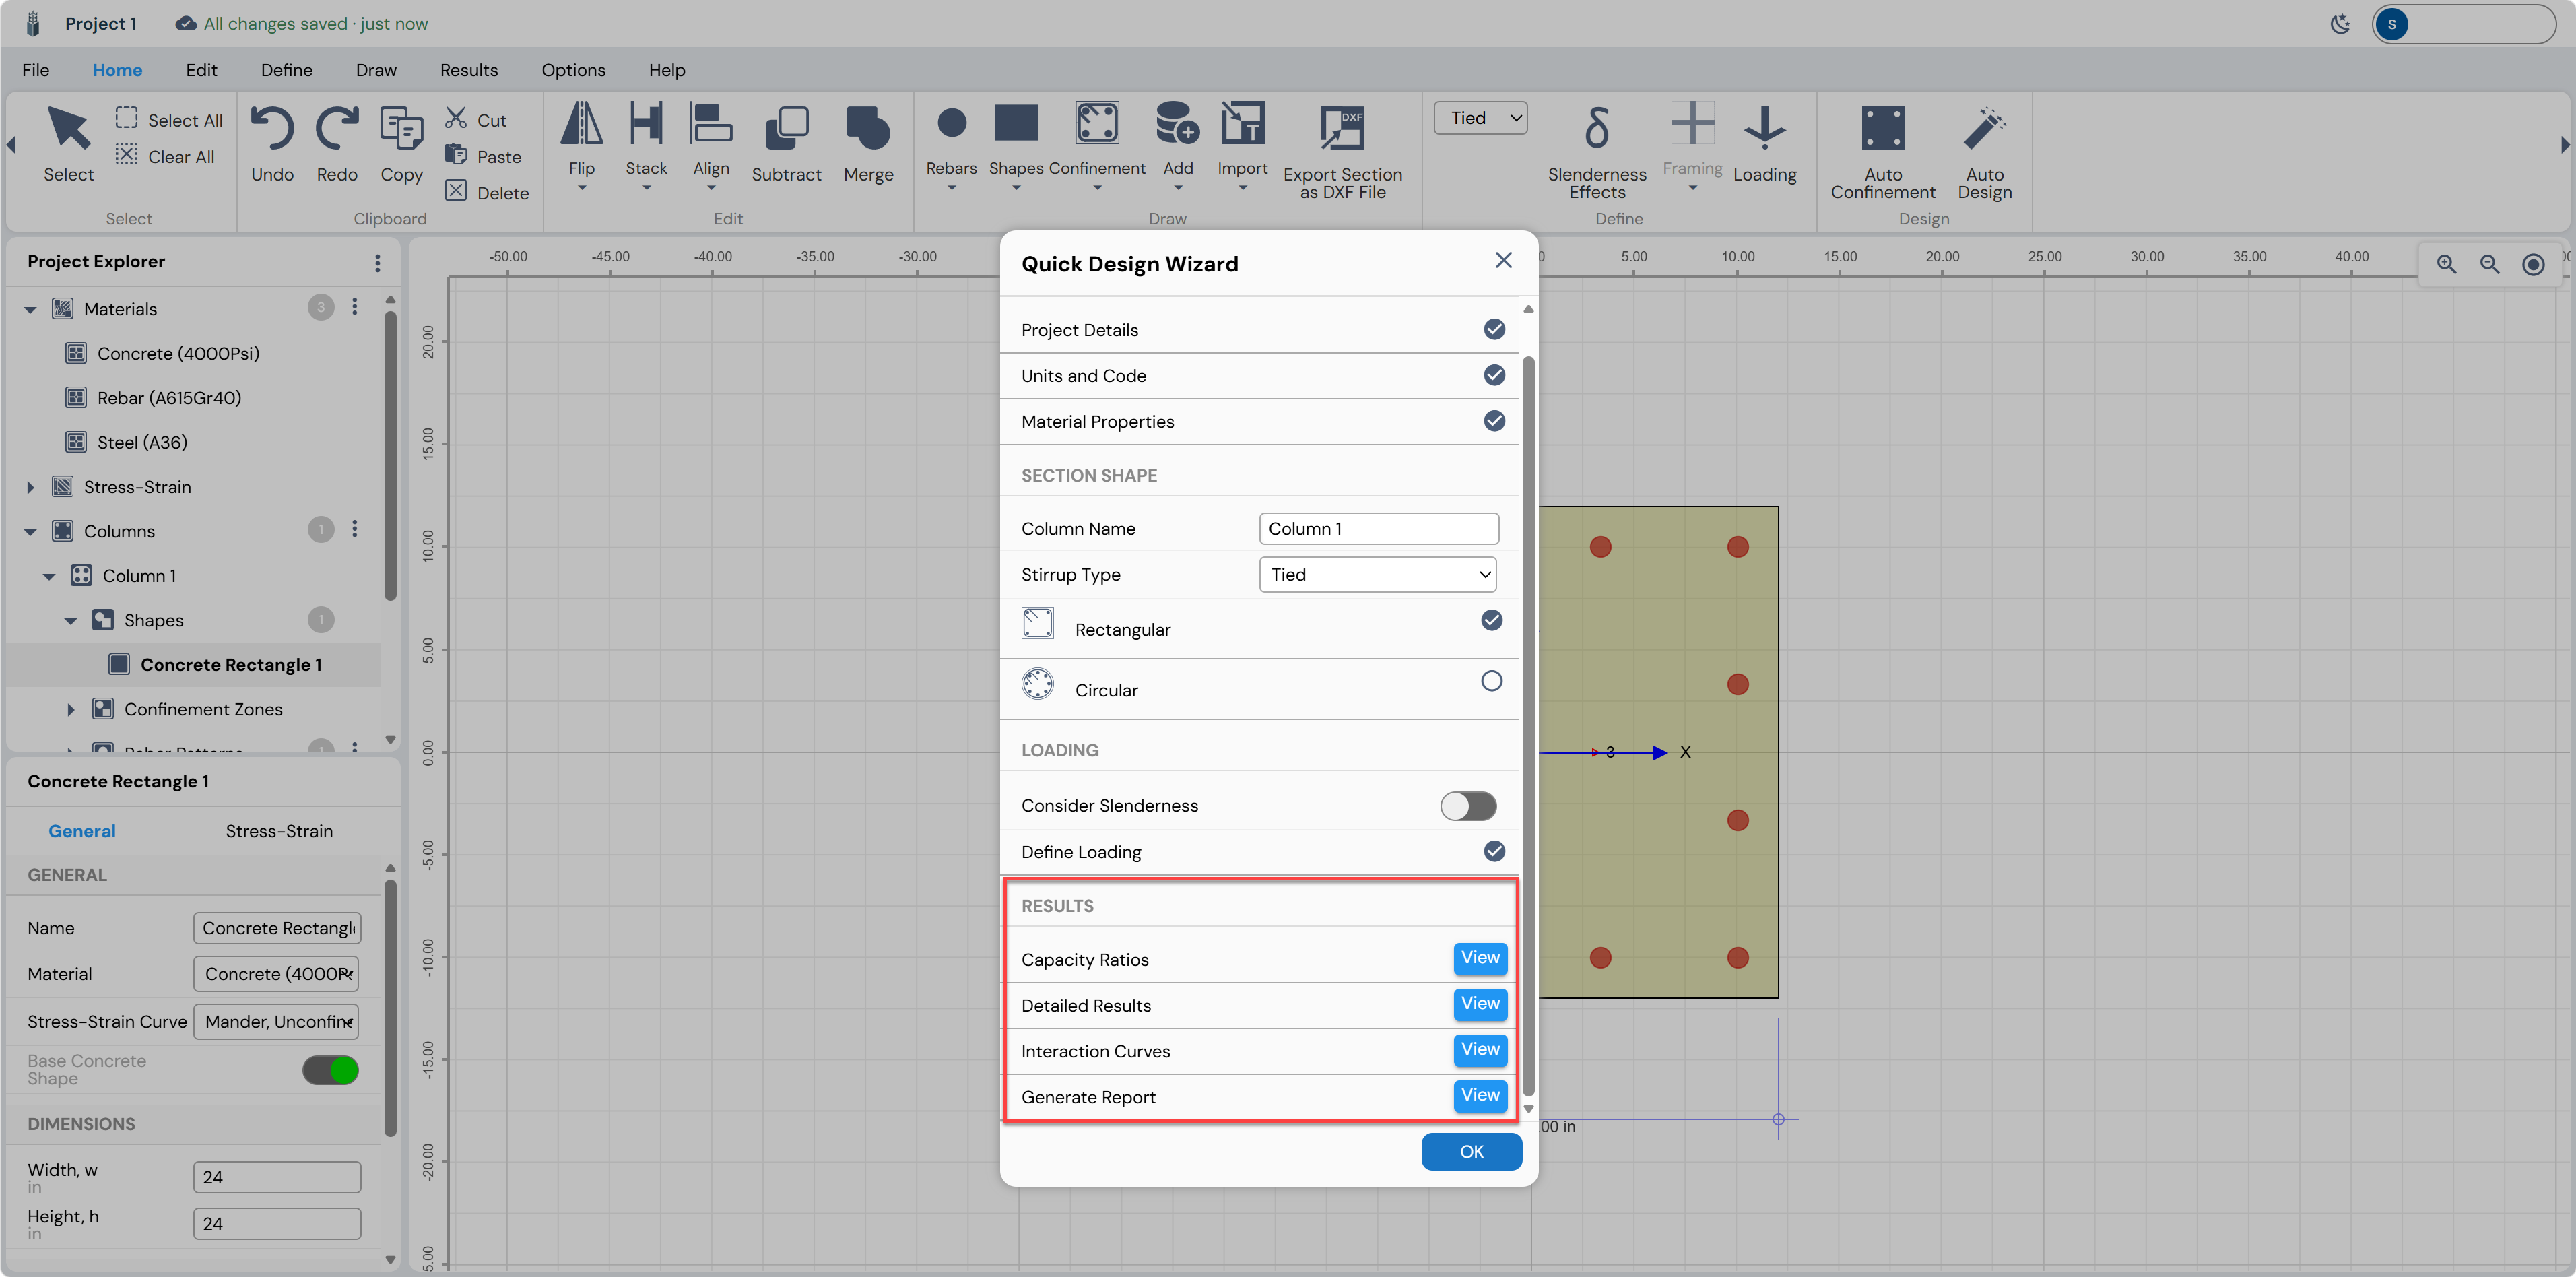
Capacity Ratios (Summary Results)
Click View next to Capacity Ratios. The Capacity Calculation Summary Results dialog opens. It shows one row per load combination for both the Top End and Bottom End of the column.
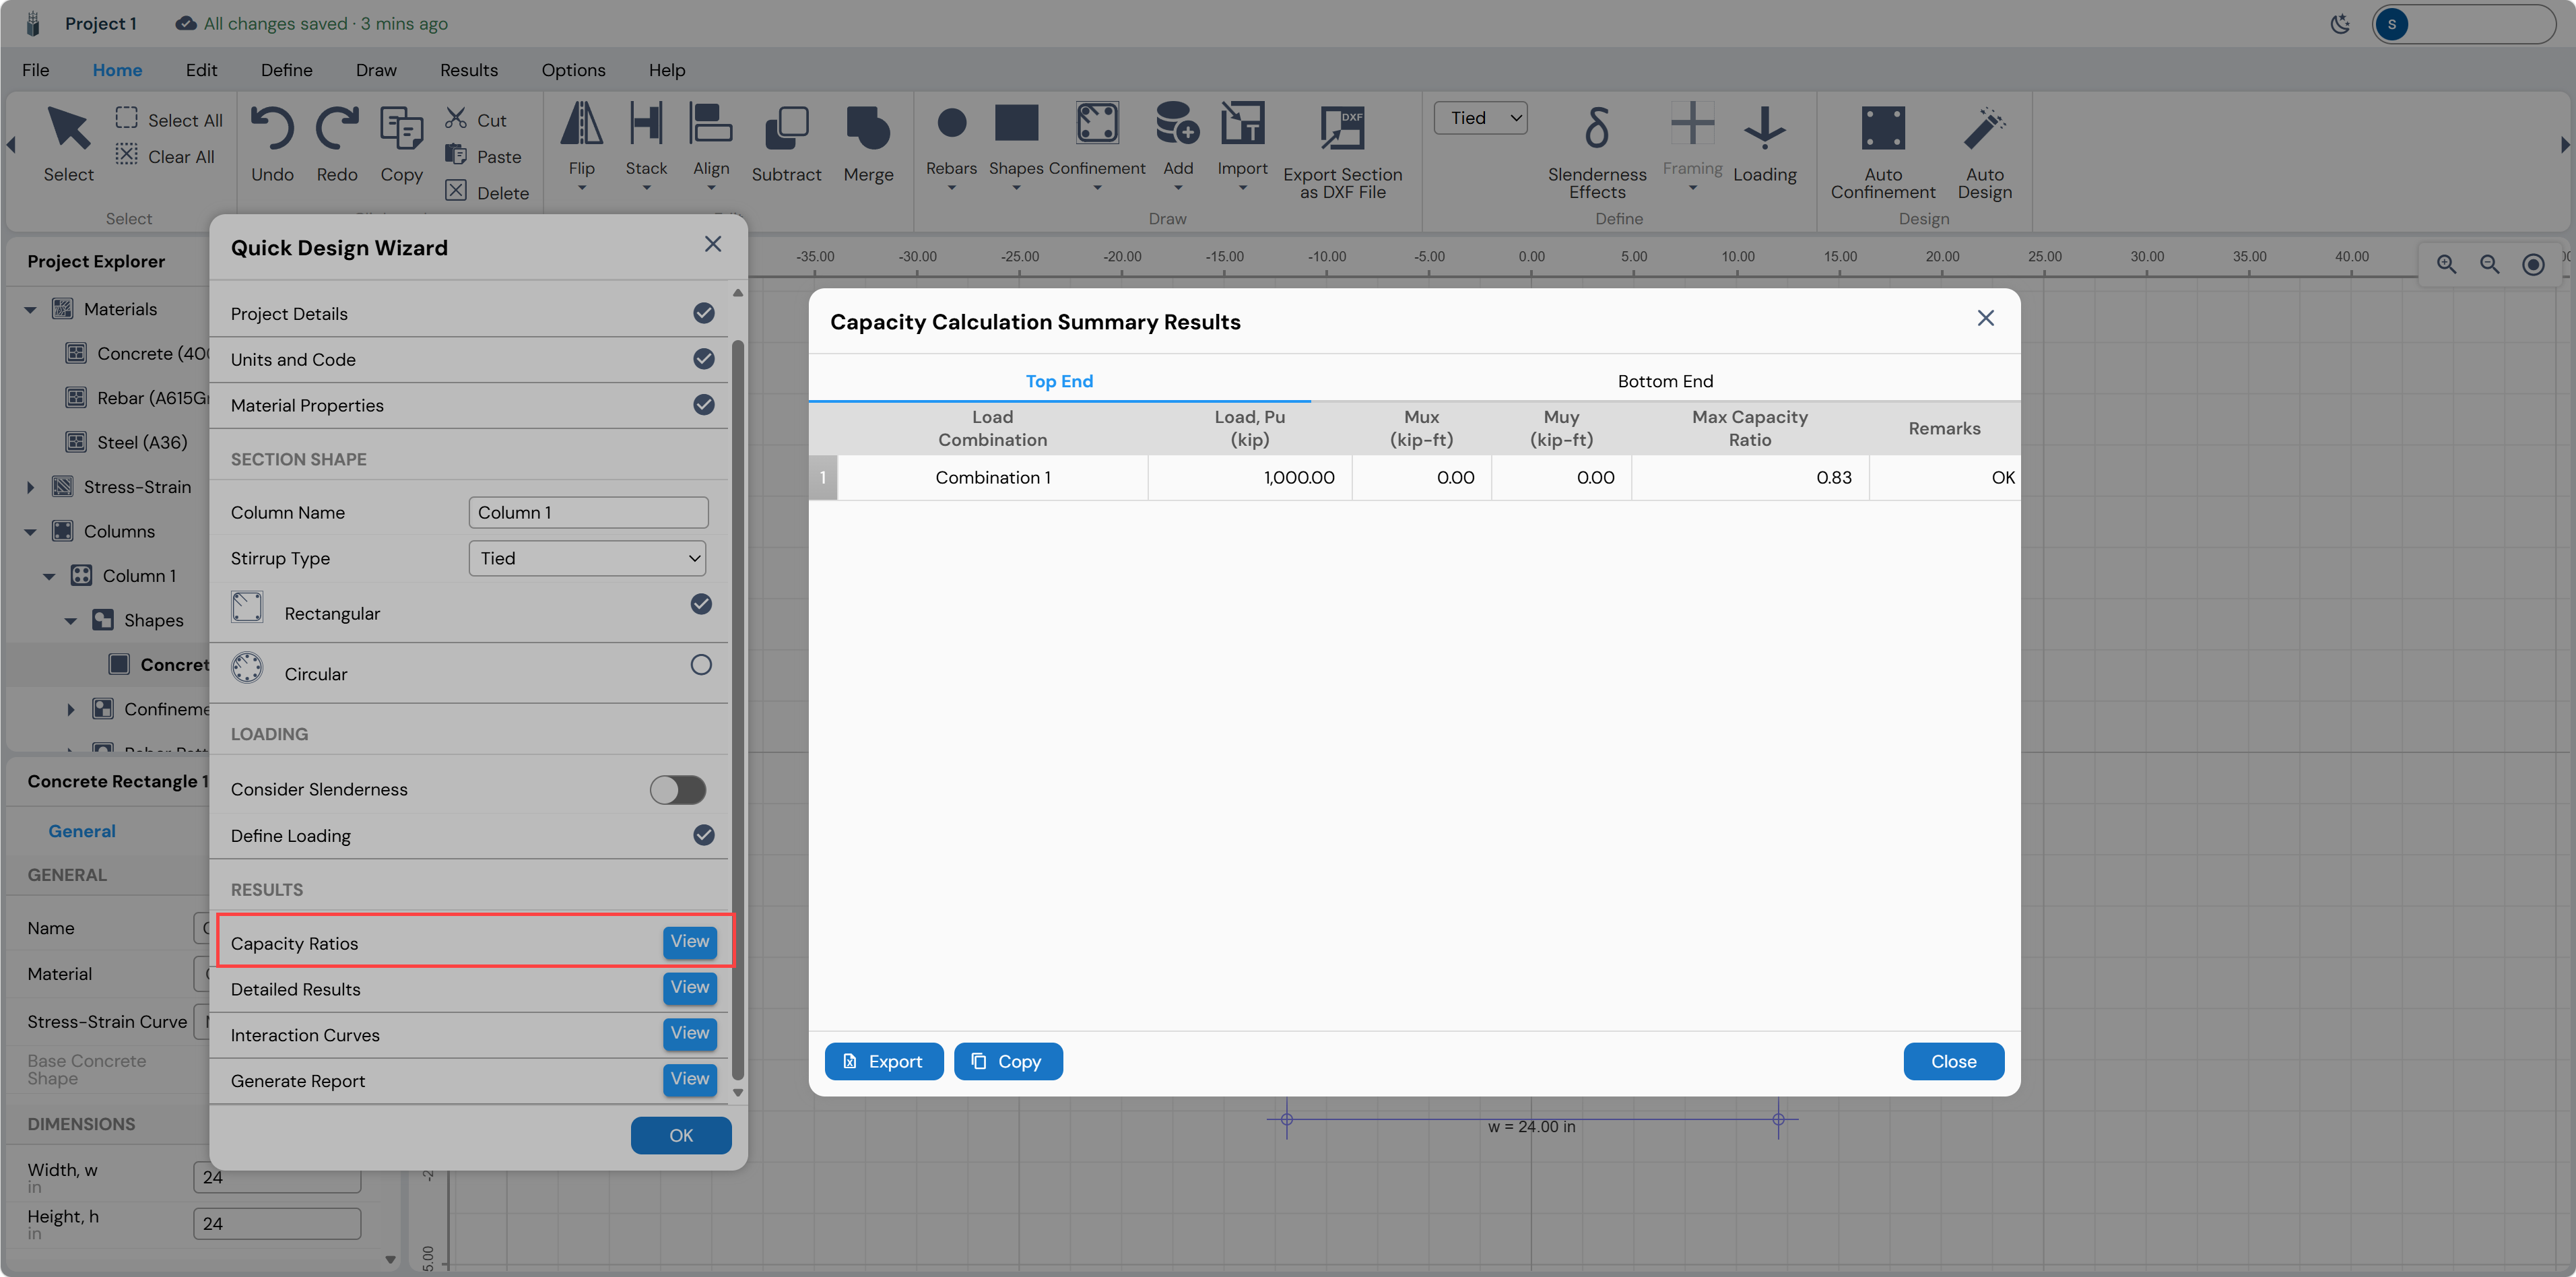
| Column | Value | Interpretation |
|---|---|---|
| Load Combination | Combination 1 | Name of the governing load case |
| Load, Pu (kip) | 1,000.00 | Applied factored axial load |
| Mux (kip-ft) | 0.00 | Applied factored X-moment at the top |
| Muy (kip-ft) | 0.00 | Applied factored Y-moment at the top |
| Max Capacity Ratio | 0.83 | Demand/Capacity ratio — must be ≤ 1.0 for a passing design |
| Remarks | OK | “OK” = design is adequate; “NG” = design fails |
| Note: A Max Capacity Ratio of 0.83 means the column uses 83% of its available capacity under the applied loads — the design passes with a 17% reserve. |
|---|
Use the Export button to save results as a CSV, or Copy to paste to a spreadsheet.
Detailed Results
Click View next to Detailed Results. This table shows all calculation parameters including:
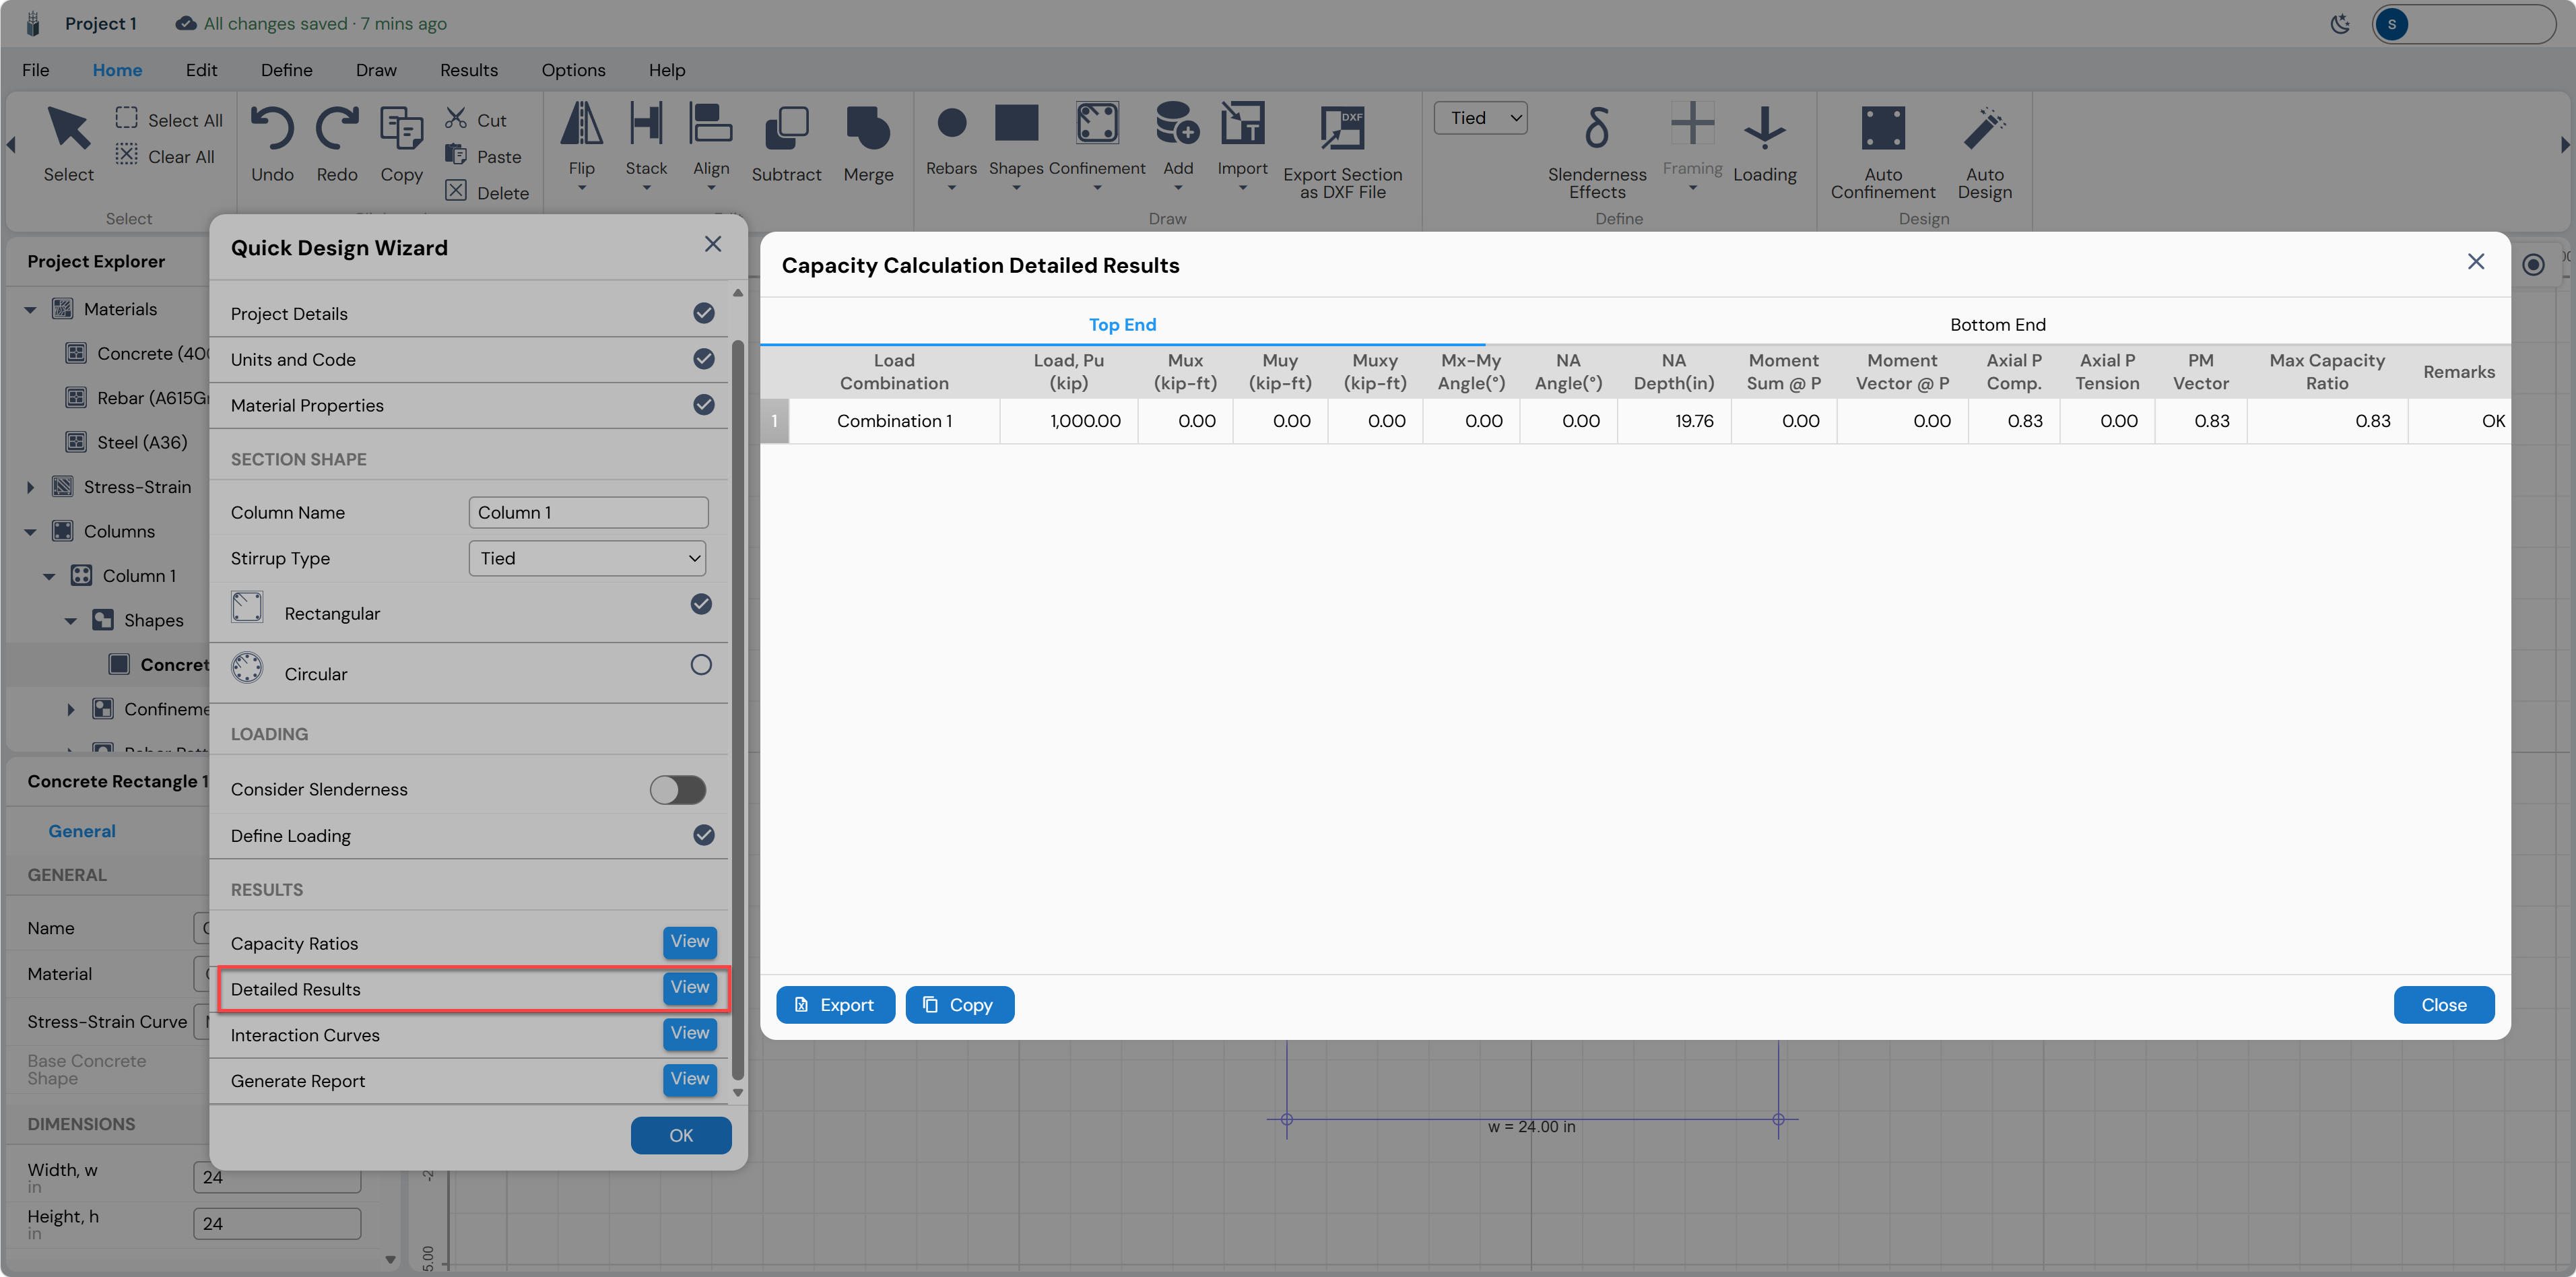
| Column | Value | Description |
|---|---|---|
| Load, Pu (kip) | 1,000.00 | Applied factored axial load |
| Mux, Muy (kip-ft) | 0.00, 0.00 | Applied factored moments in X and Y directions |
| Mx-My Angle (°) | 0.00 | Angle of resultant moment vector |
| NA Angle (°) | 0.00 | Angle of the neutral axis |
| NA Depth (in) | 19.76 | Neutral axis depth from the compression face |
| Moment Sum @ P | 0.00 | Sum of moments at the point of zero tension |
| Moment Vector @ P | 0.00 | Resultant moment vector magnitude at Pu |
| Axial P Compression | 0.83 | Axial capacity ratio (compression component) |
| Axial P Tension | 0.00 | Axial capacity ratio (tension component) |
| PM Vector | 0.83 | Combined PM interaction ratio |
| Max Capacity Ratio | 0.83 | Governing D/C ratio = max(Comp, Tension, PM) |
| Remarks | OK | Pass/fail status per ACI 318-19 |
Click the Bottom End tab to view the same results evaluated at the base of the column. The results are identical in this case as no moments are applied.
Interaction Curves
Click View next to Interaction Curves. The Interaction Diagram window opens showing:
A 3D interaction surface (colored by axial load level) on the left
A P-M interaction curve for a selected angle (top-right)
A moment contour plot at a specified Pu level (bottom-right)
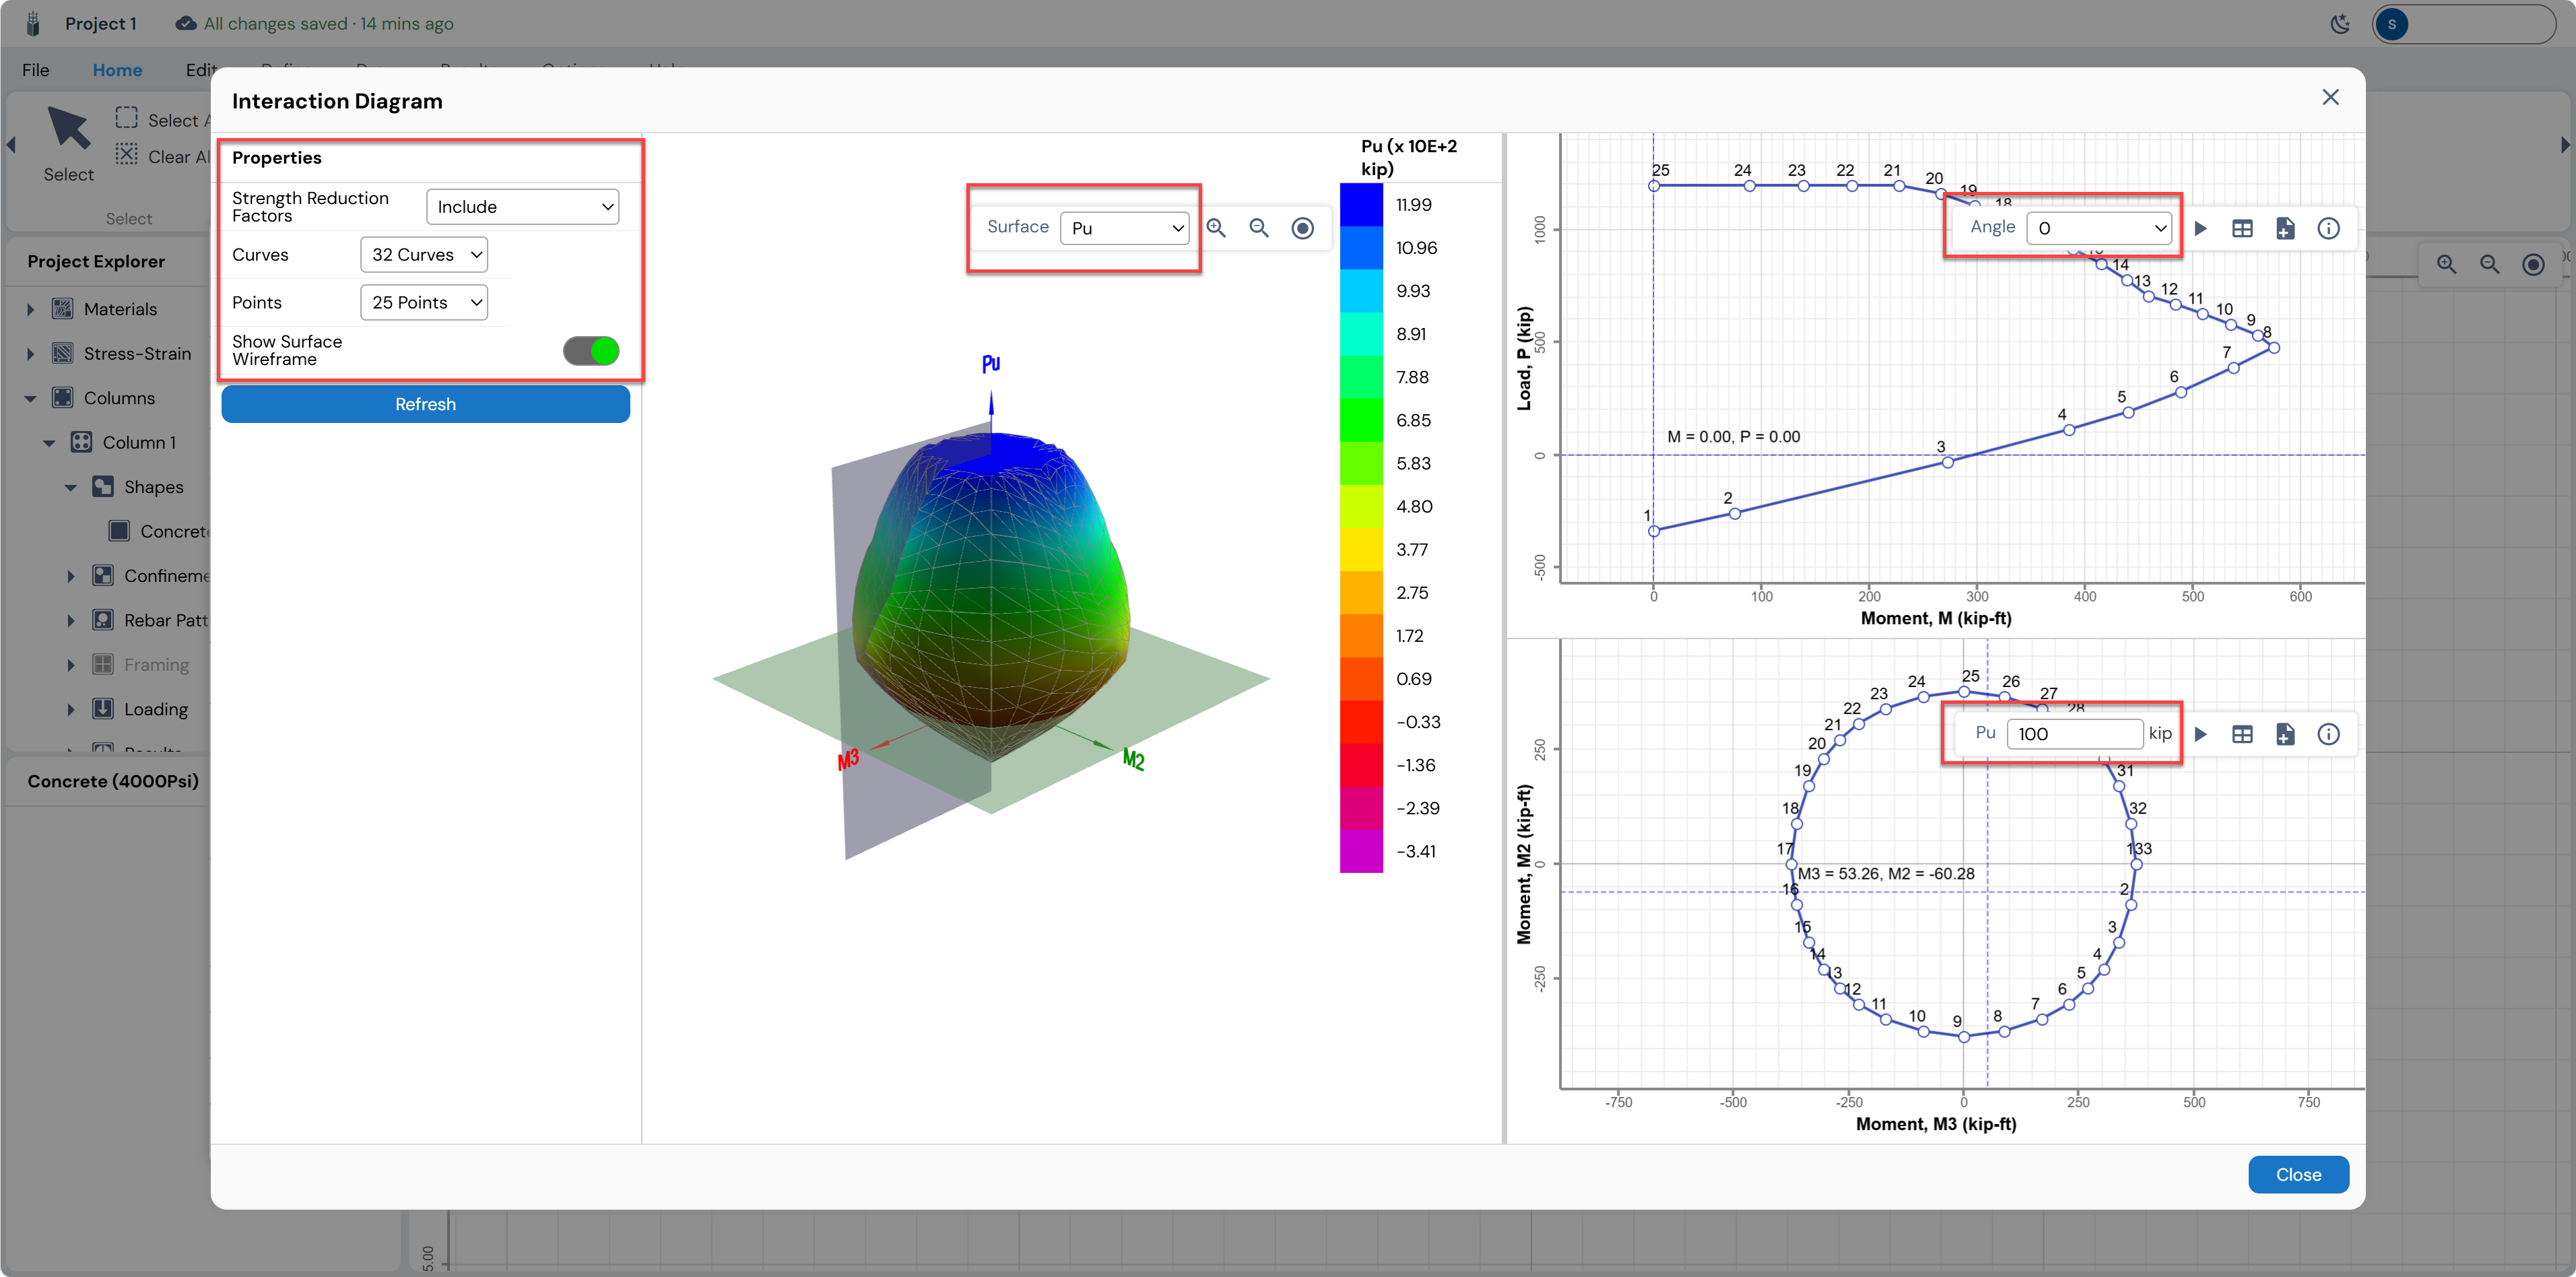
Use the Properties panel on the left to adjust:
| Property | Option | Effect |
|---|---|---|
| Strength Reduction Factors | Include / Exclude | Toggles phi factors on/off for the diagram surface |
| Curves | 32 Curves | Number of meridional curves on the 3D surface |
| Points | 25 Points | Number of discrete points per curve |
| Show Surface Wireframe | On/Off toggle | Toggles the wireframe mesh visibility |
The 2D P-M curve (top-right panel) can be rotated to any angle using the Angle input field. The Pu slider or input in the bottom-right panel traces the moment contour at the specified axial load level, which helps visualize biaxial capacity at Pu = 1,000 kip.
Click Close to exit the Interaction Diagram window and return to the wizard.
Generating the Report
Click View next to Generate Report in the wizard. Eagle Eye will compile all project data, section properties, material properties, loading combinations, and capacity results into a formatted report displayed inline in the application.
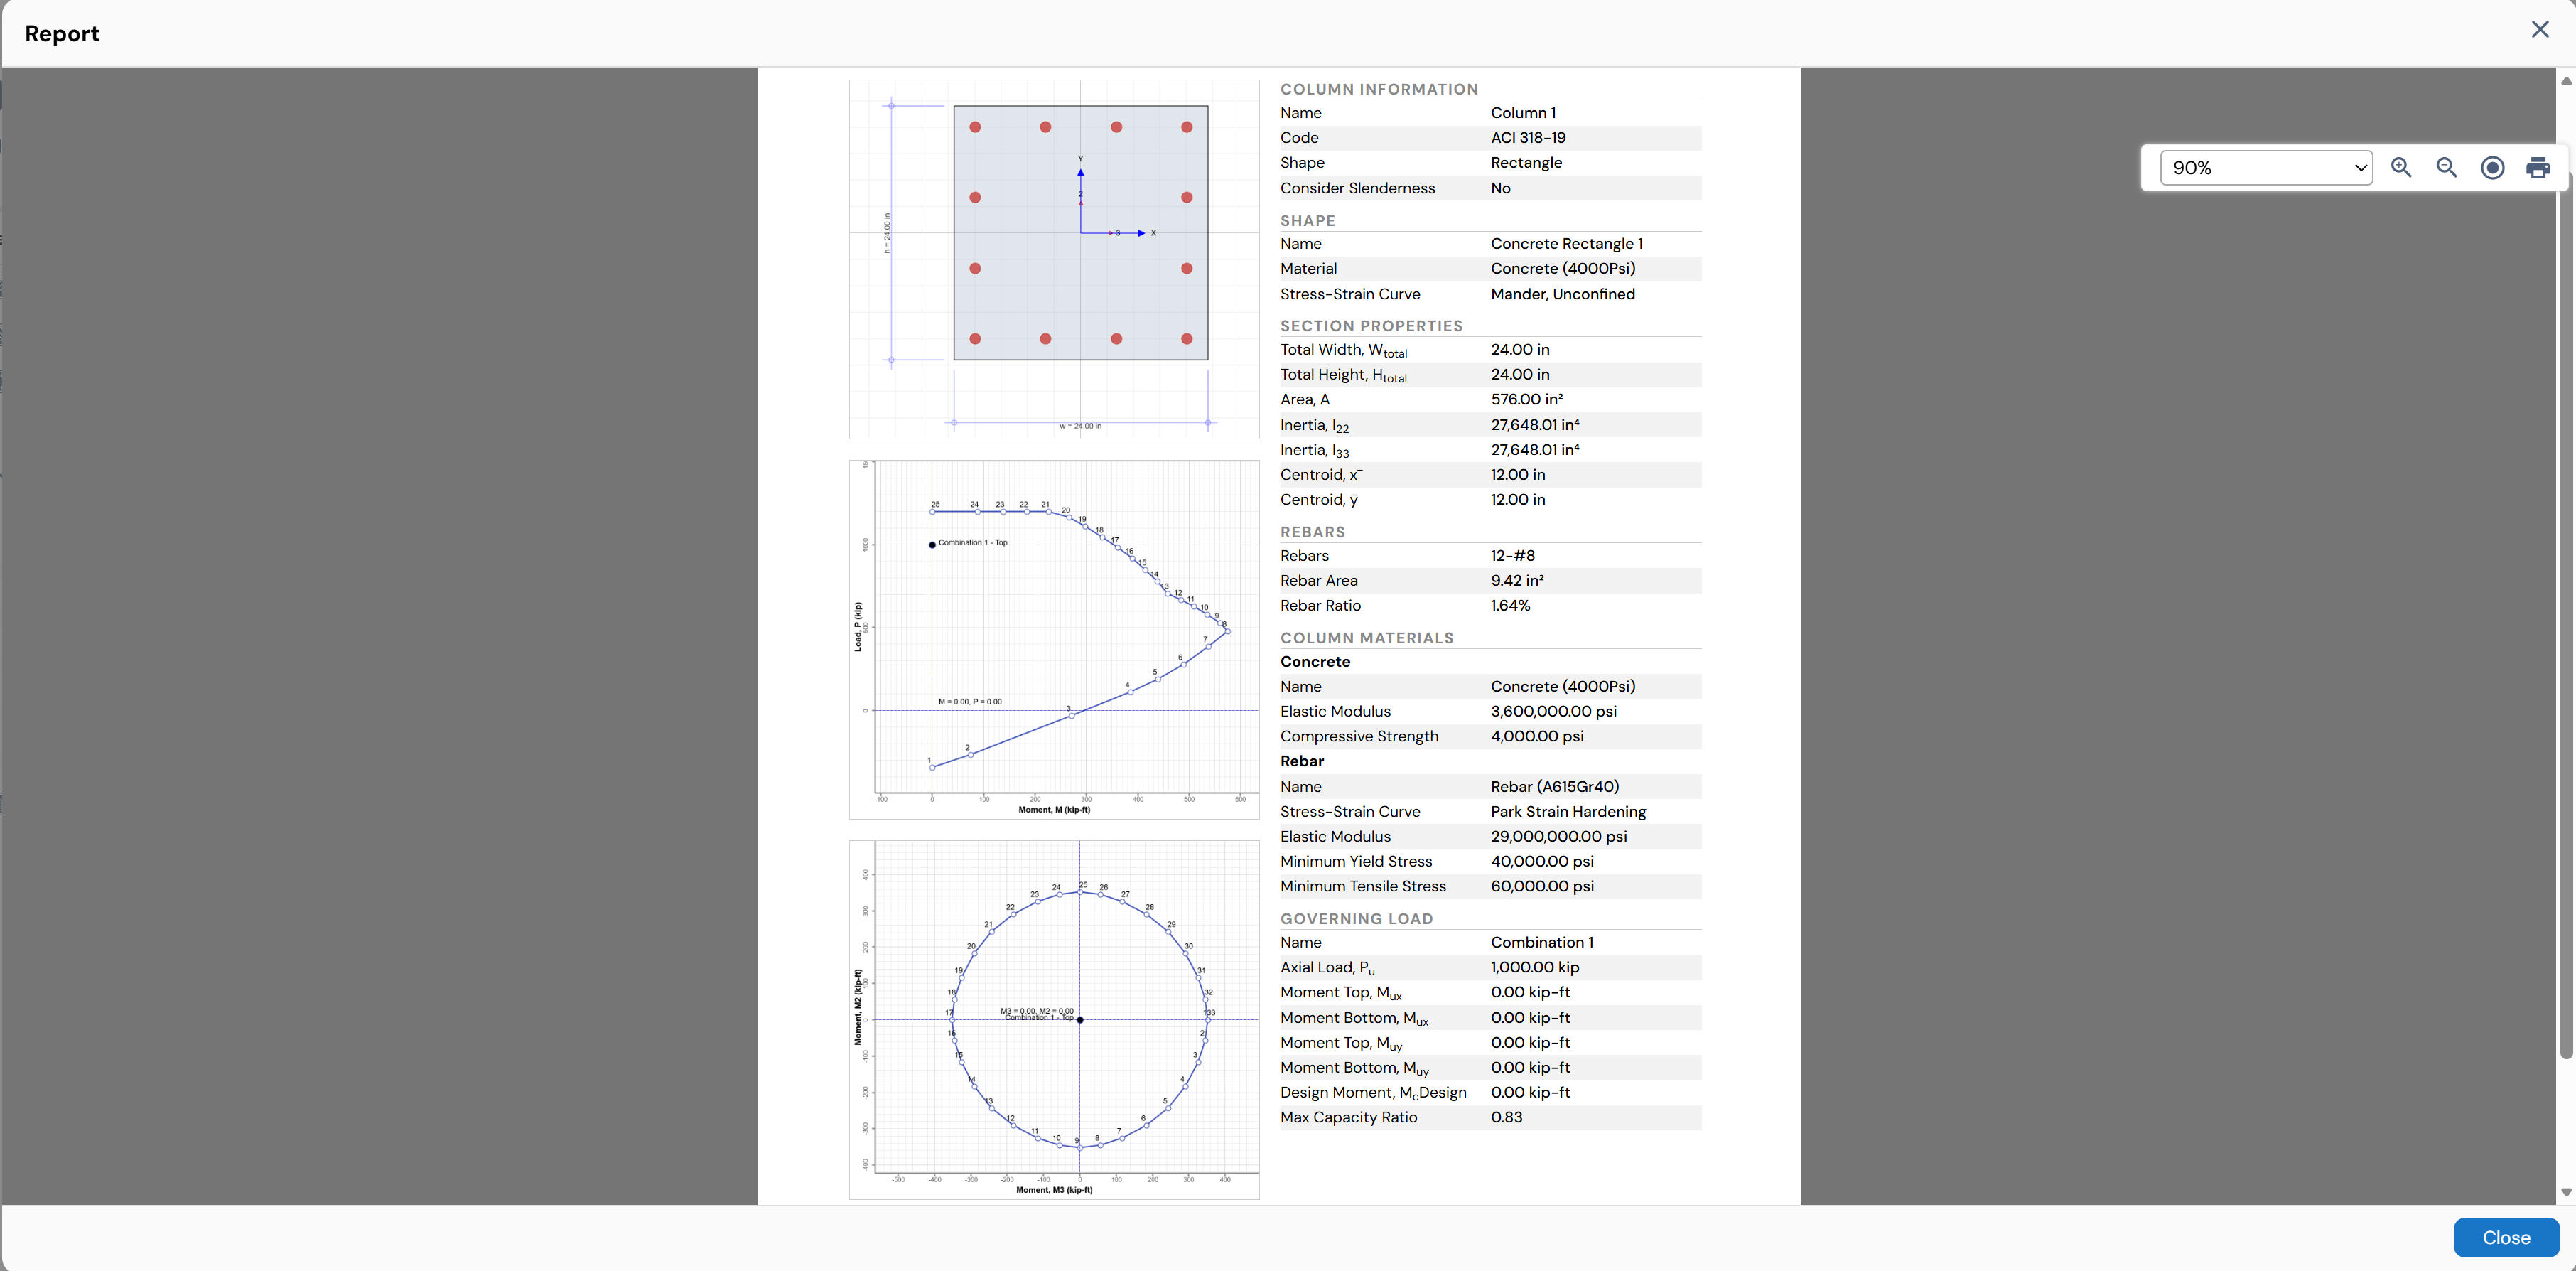
Click OK in the Quick Design Wizard to close the wizard and return to the main canvas workspace.
Exploring Results in the Main Workspace
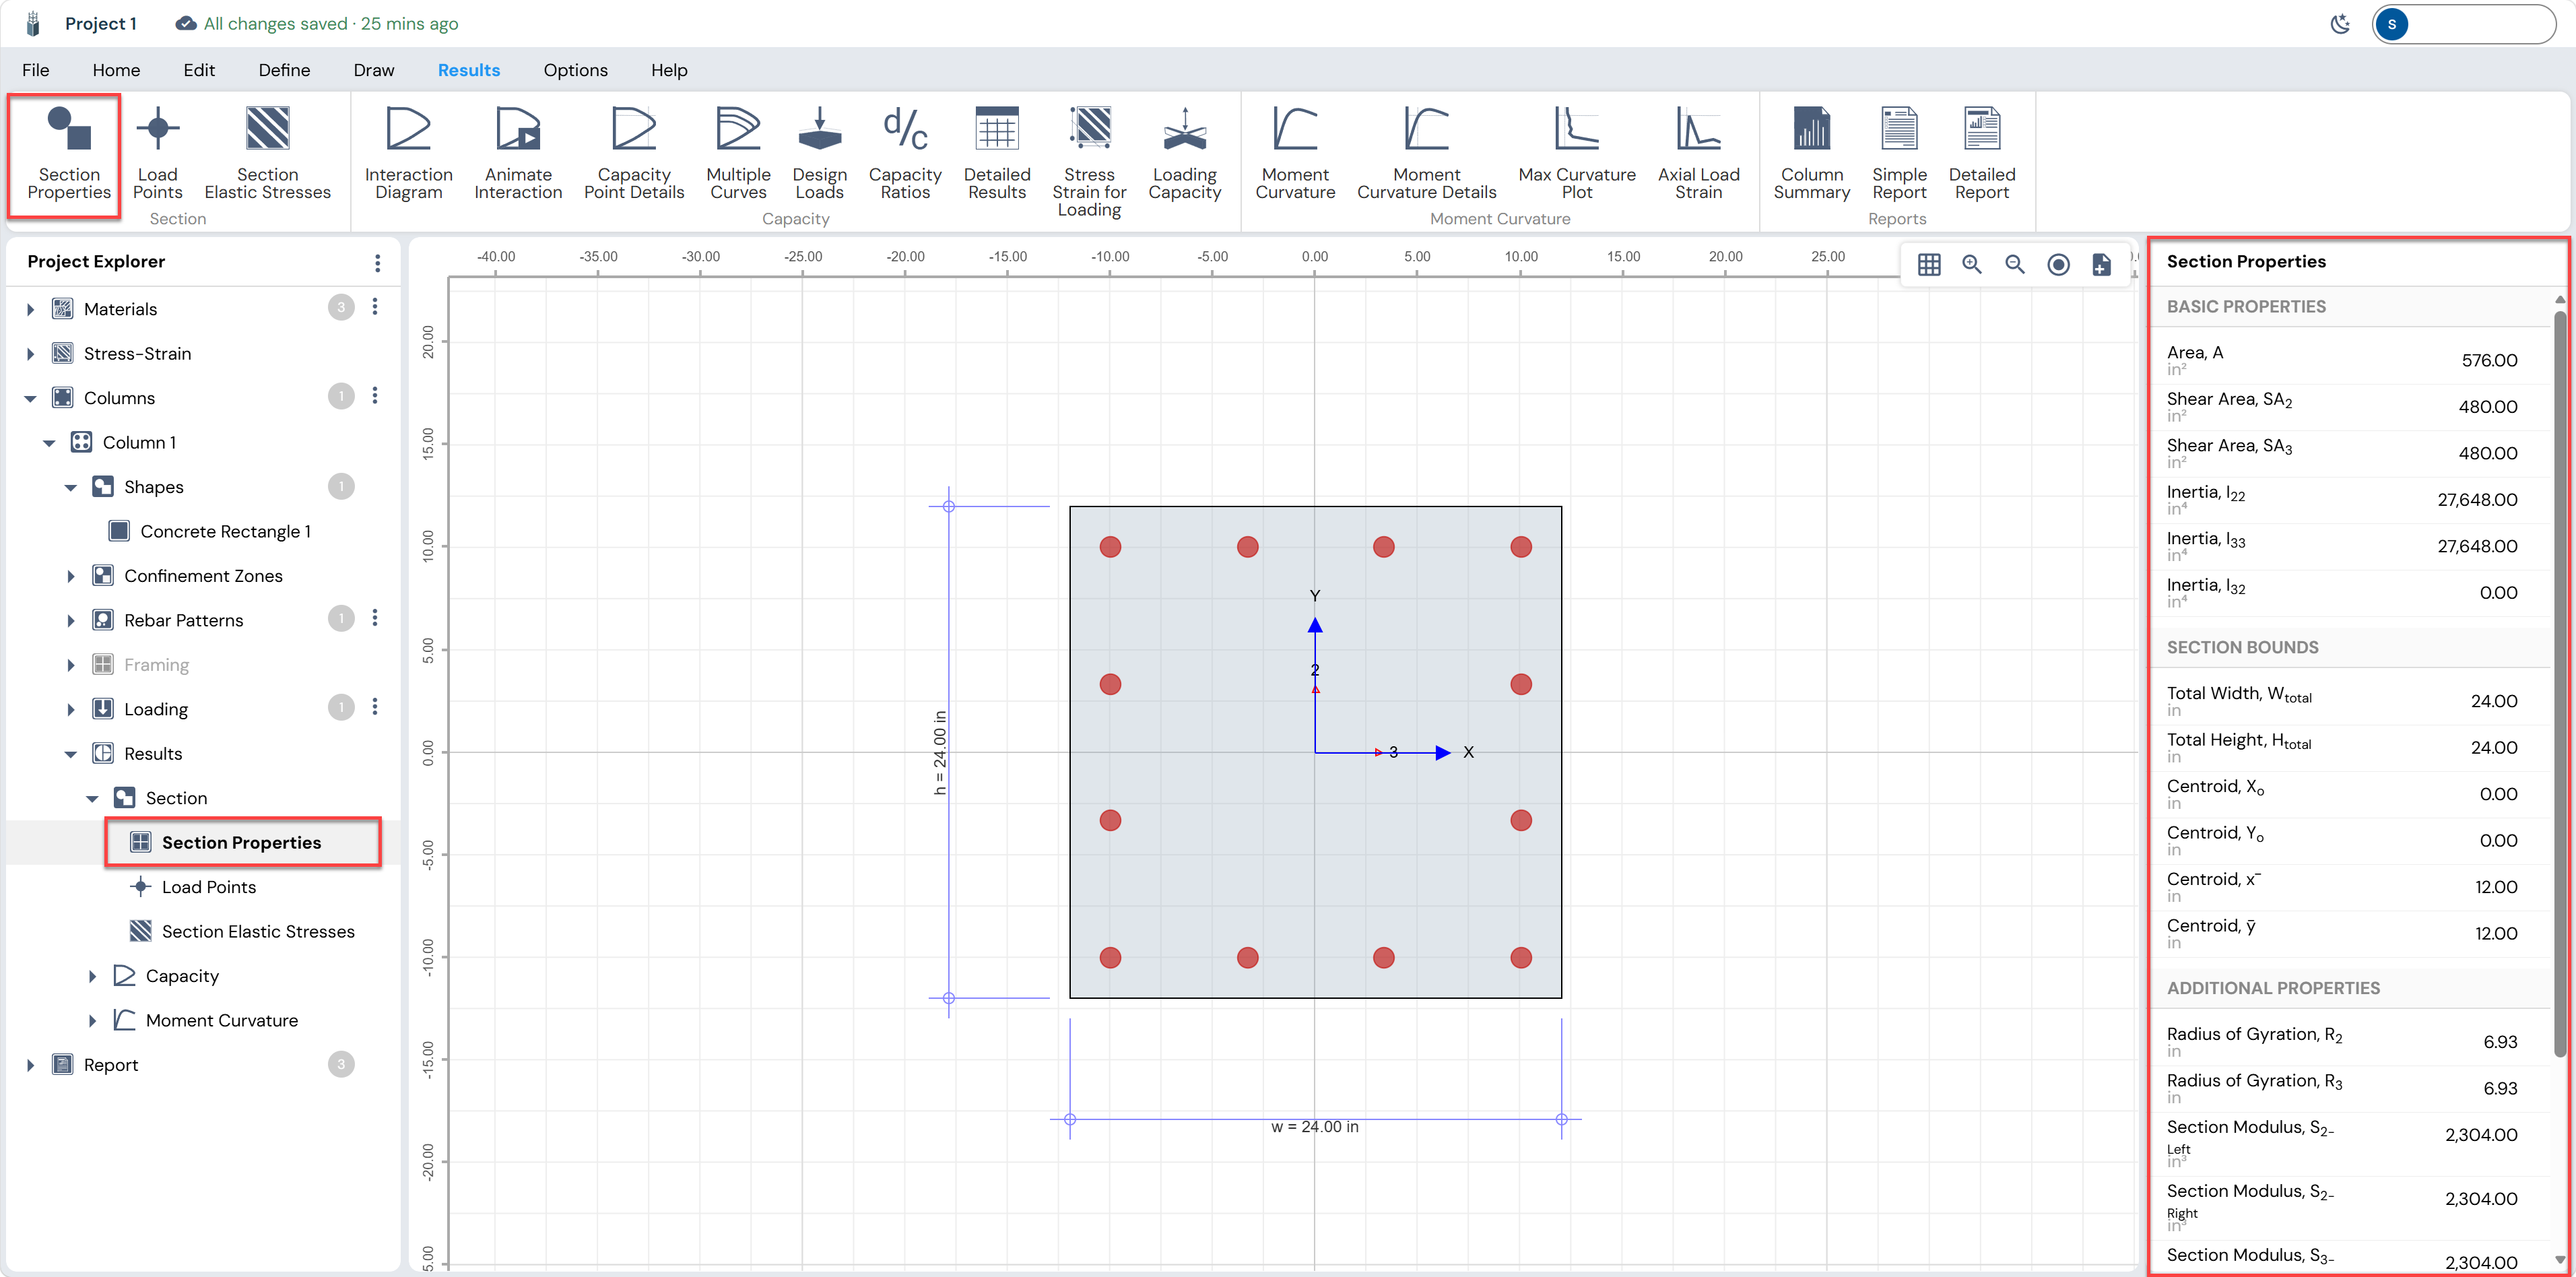
After closing the wizard, the column model is fully built and the Results tab becomes active in the ribbon toolbar. The Project Explorer on the left now shows a complete tree of results:
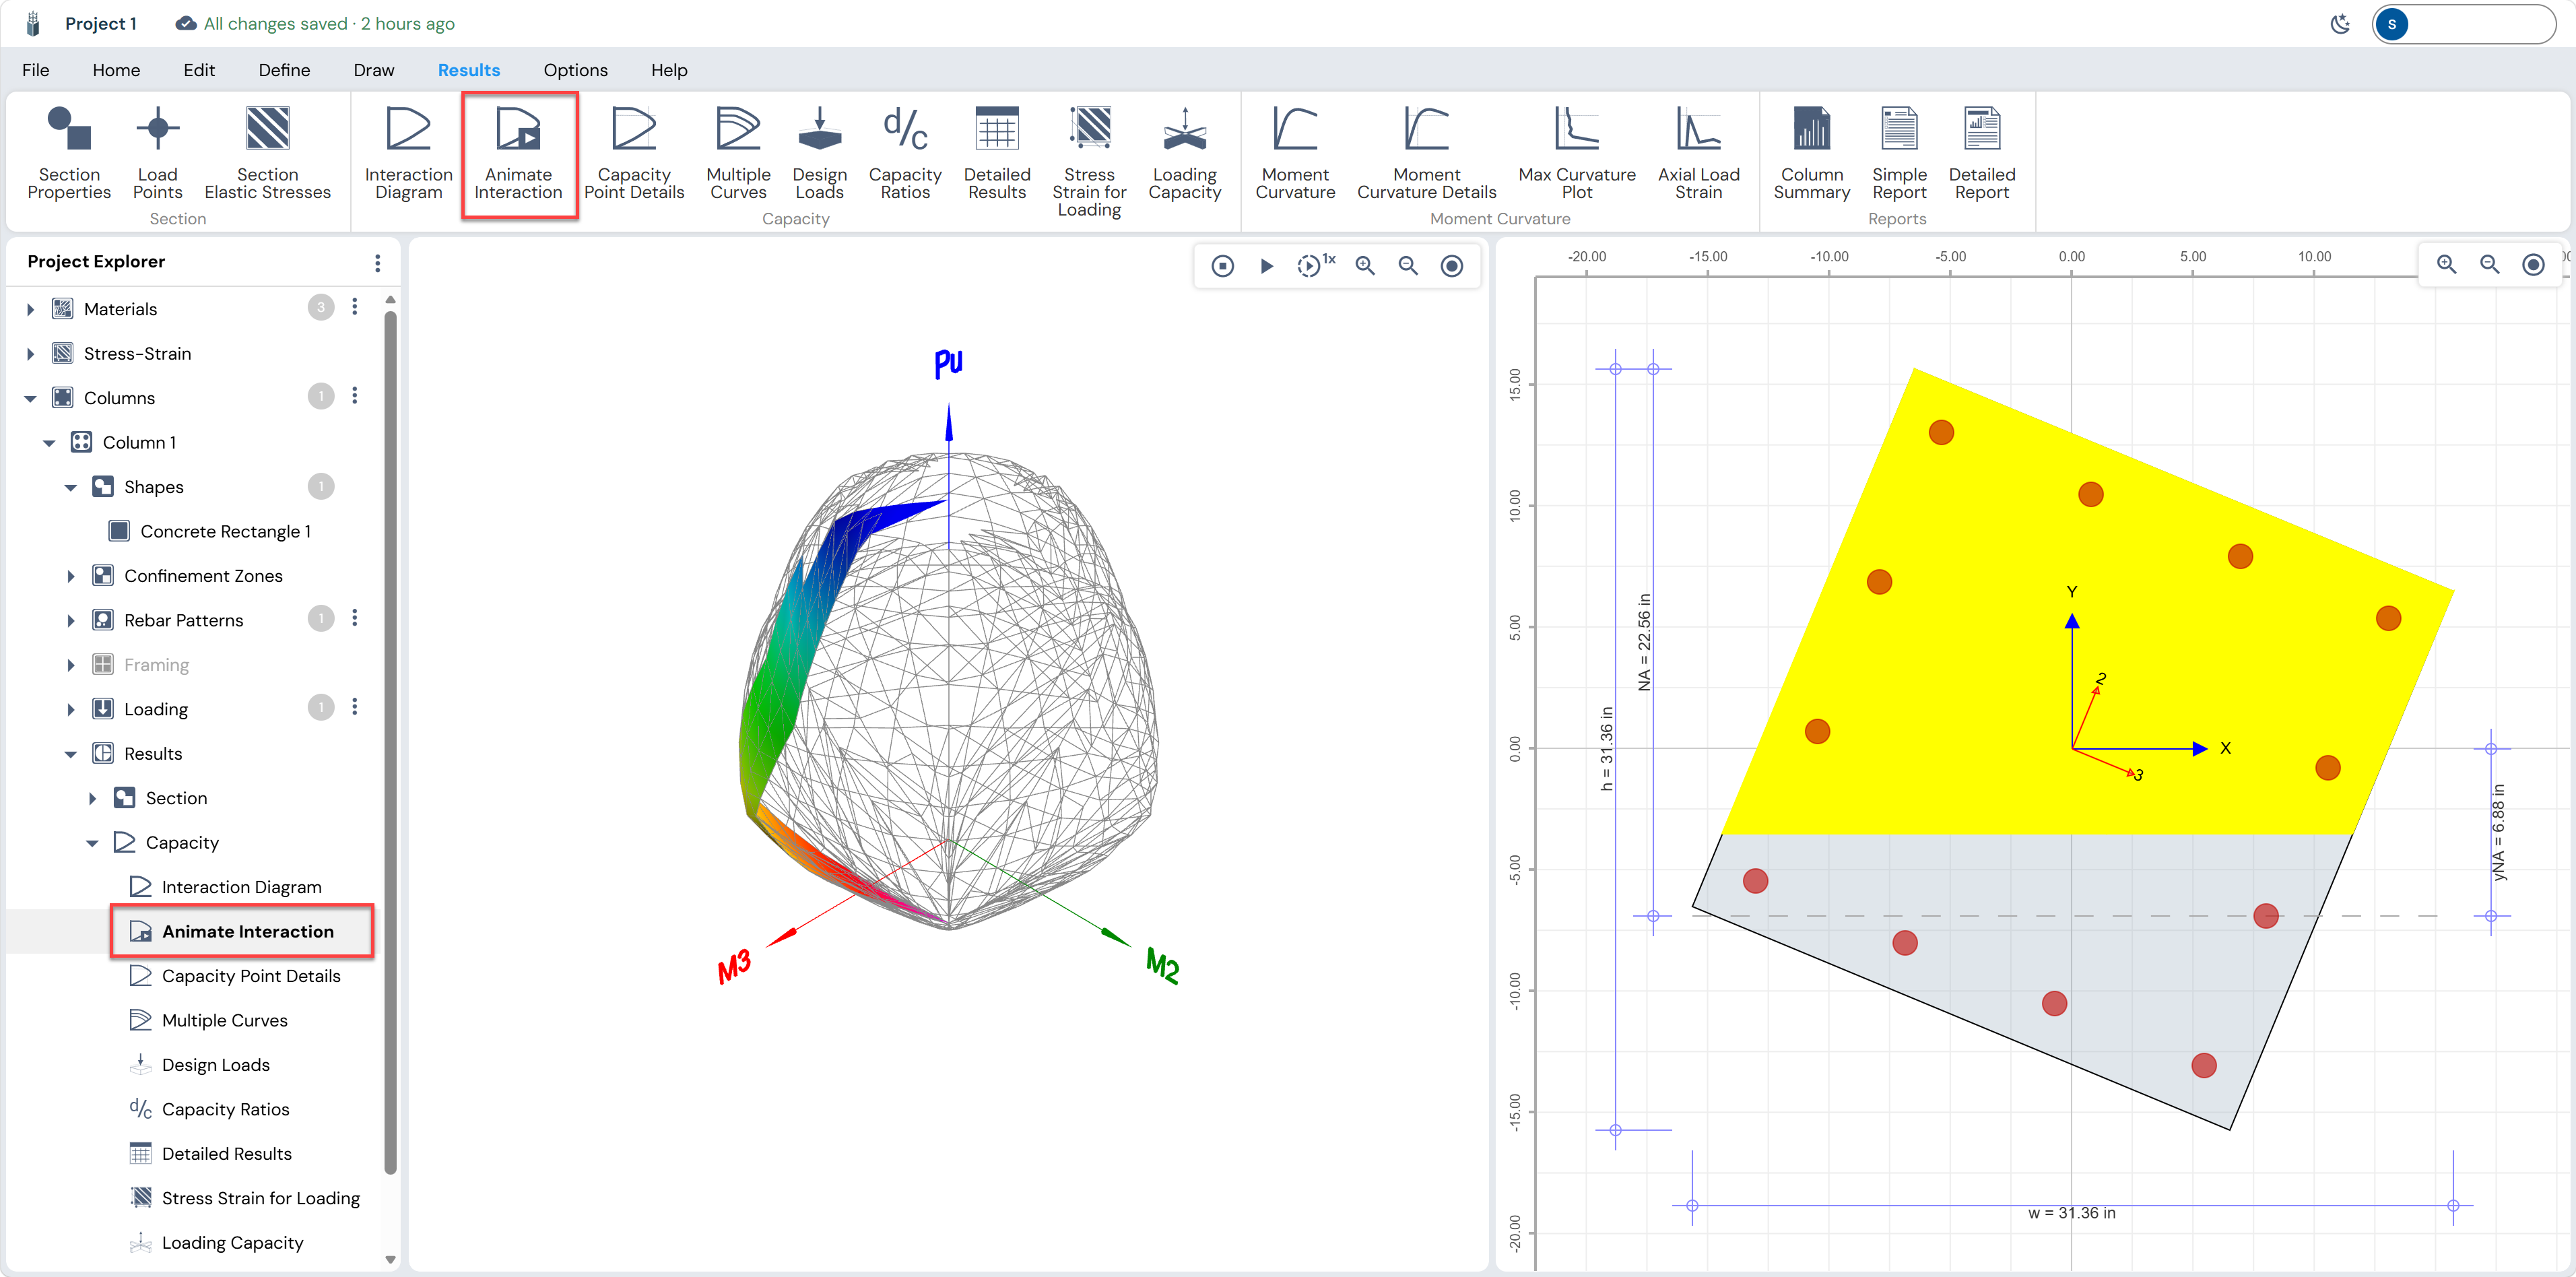
Animate Interaction
Click Animate Interaction in the ribbon. This view provides a dynamic animation of the neutral axis sweeping across the column cross-section as the load combination point traces the interaction surface. On the right panel, the yellow compression zone and the grey tension zone shift as the animation progresses.
Capacity Point Details
Click Capacity Point Details in the ribbon, then click any point on the interaction curve. The left panel will populate with the detailed fiber analysis data for that point:
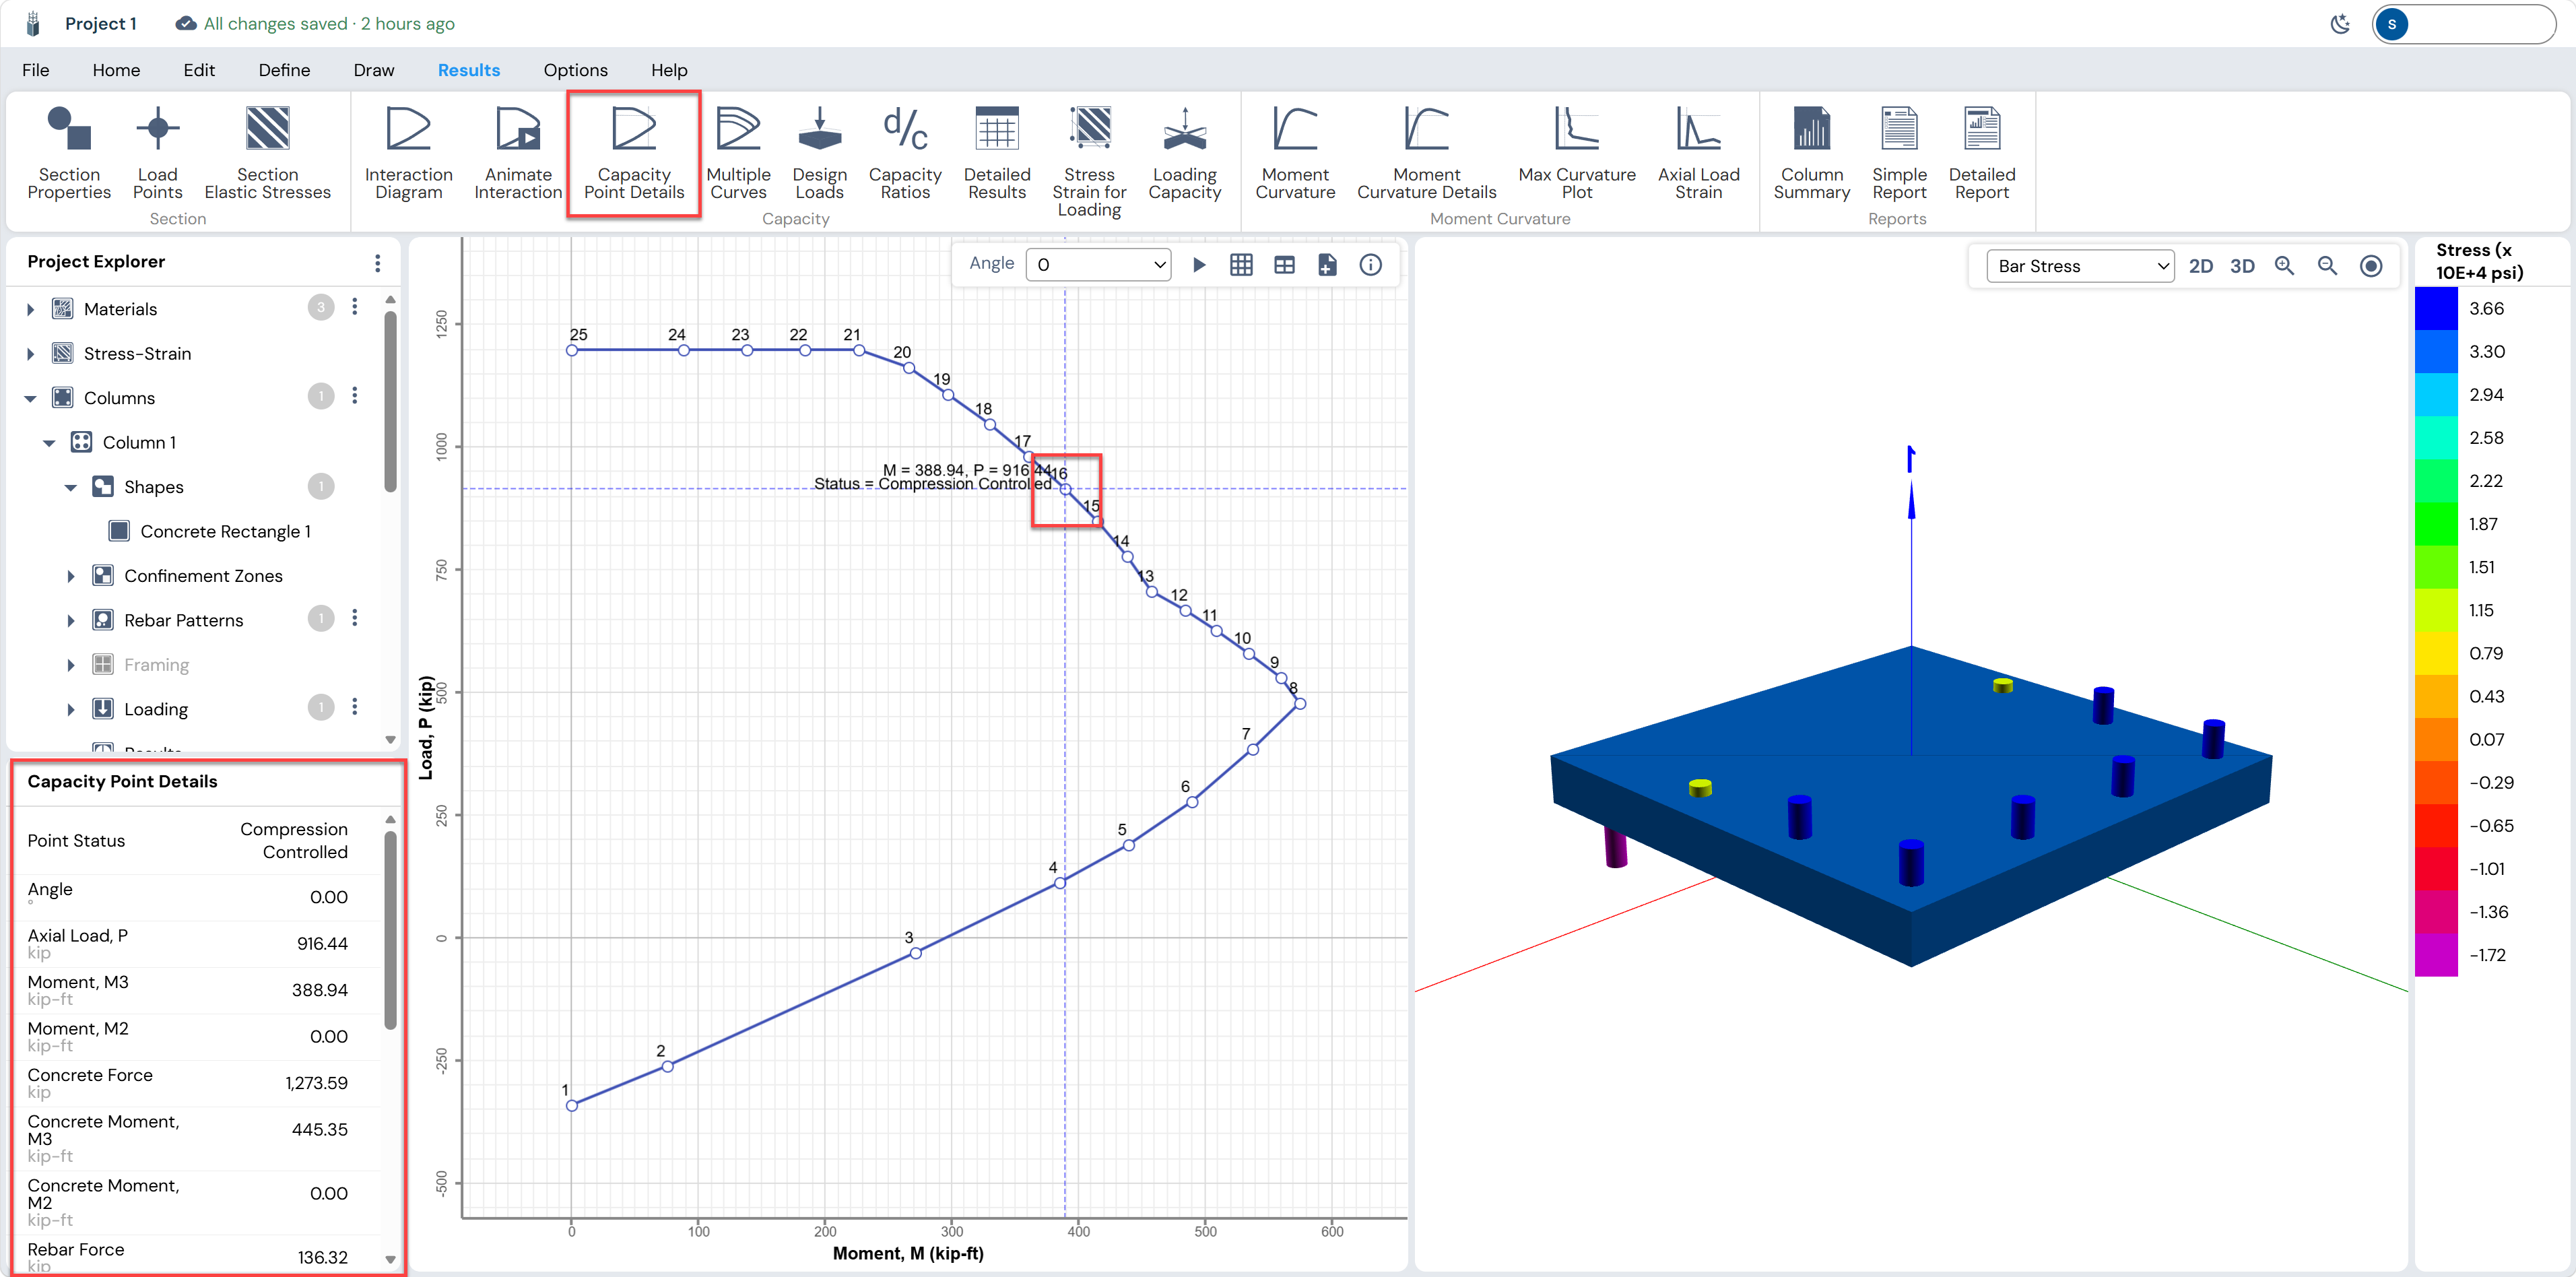
| Property | Value | Interpretation |
|---|---|---|
| Point Status | Compression Controlled | ACI classification: tension-controlled, transition, or compression-controlled |
| Angle | 0.00° | Moment vector angle |
| Axial Load, P | 916.44 kip | Axial force at the selected capacity point |
| Moment, M3 | 388.94 kip-ft | Moment capacity at this point in the M3 direction |
| Concrete Force | 1273.59 kip | Total concrete compression force |
| Concrete Moment, M3 | 445.35 kip-ft | Concrete contribution to moment |
| Rebar Force | 136.32 kip | Total rebar force (negative = tension) |
Moment Curvature
Click Moment Curvature in the ribbon. The moment-curvature diagram shows the relationship between applied moment and section curvature for a given axial load level. This plot is used to assess section ductility and post-peak behavior.
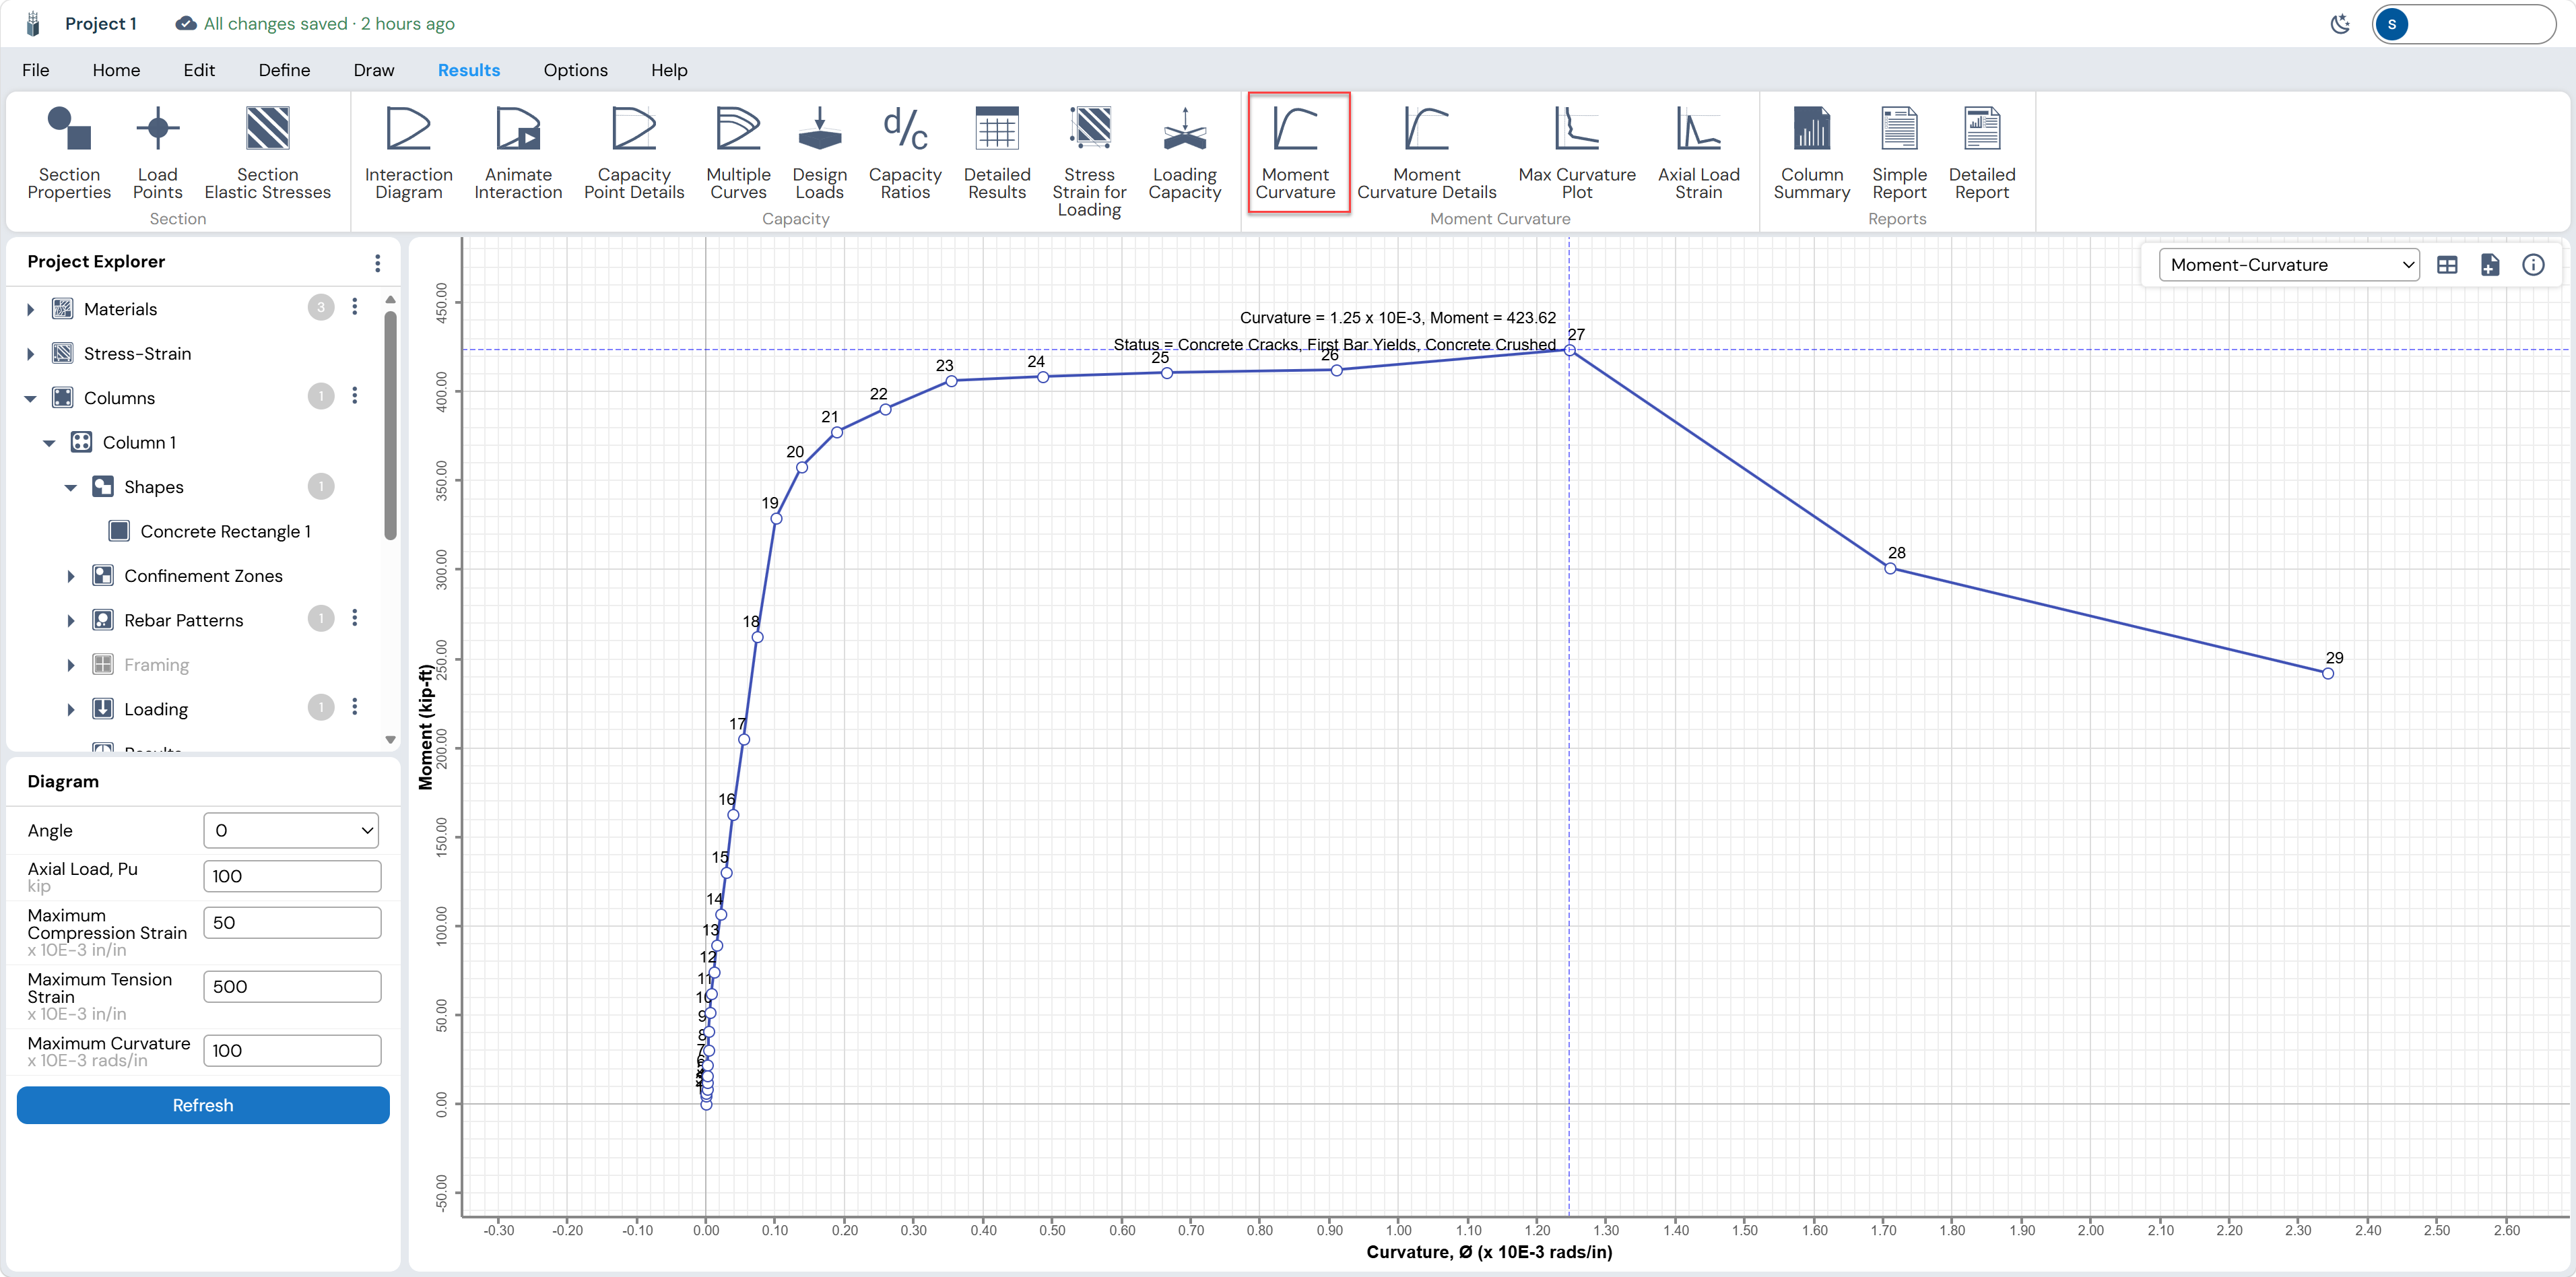
The left panel allows you to set:
| Parameter | Default | Description |
|---|---|---|
| Angle | 0° | Angle of neutral axis for the curvature calculation |
| Axial Load, Pu | 100 kip | Axial load level at which the M-Φ curve is computed |
| Maximum Compression Strain | 50 × 10⁻³ | Limiting concrete compression strain |
| Maximum Tension Strain | 500 × 10⁻³ | Limiting rebar tension strain |
| Maximum Curvature | 100 × 10⁻³ | Maximum curvature plotted on the X-axis |
Click Refresh to recompute after changing parameters.
Max Curvature Plot (3D)
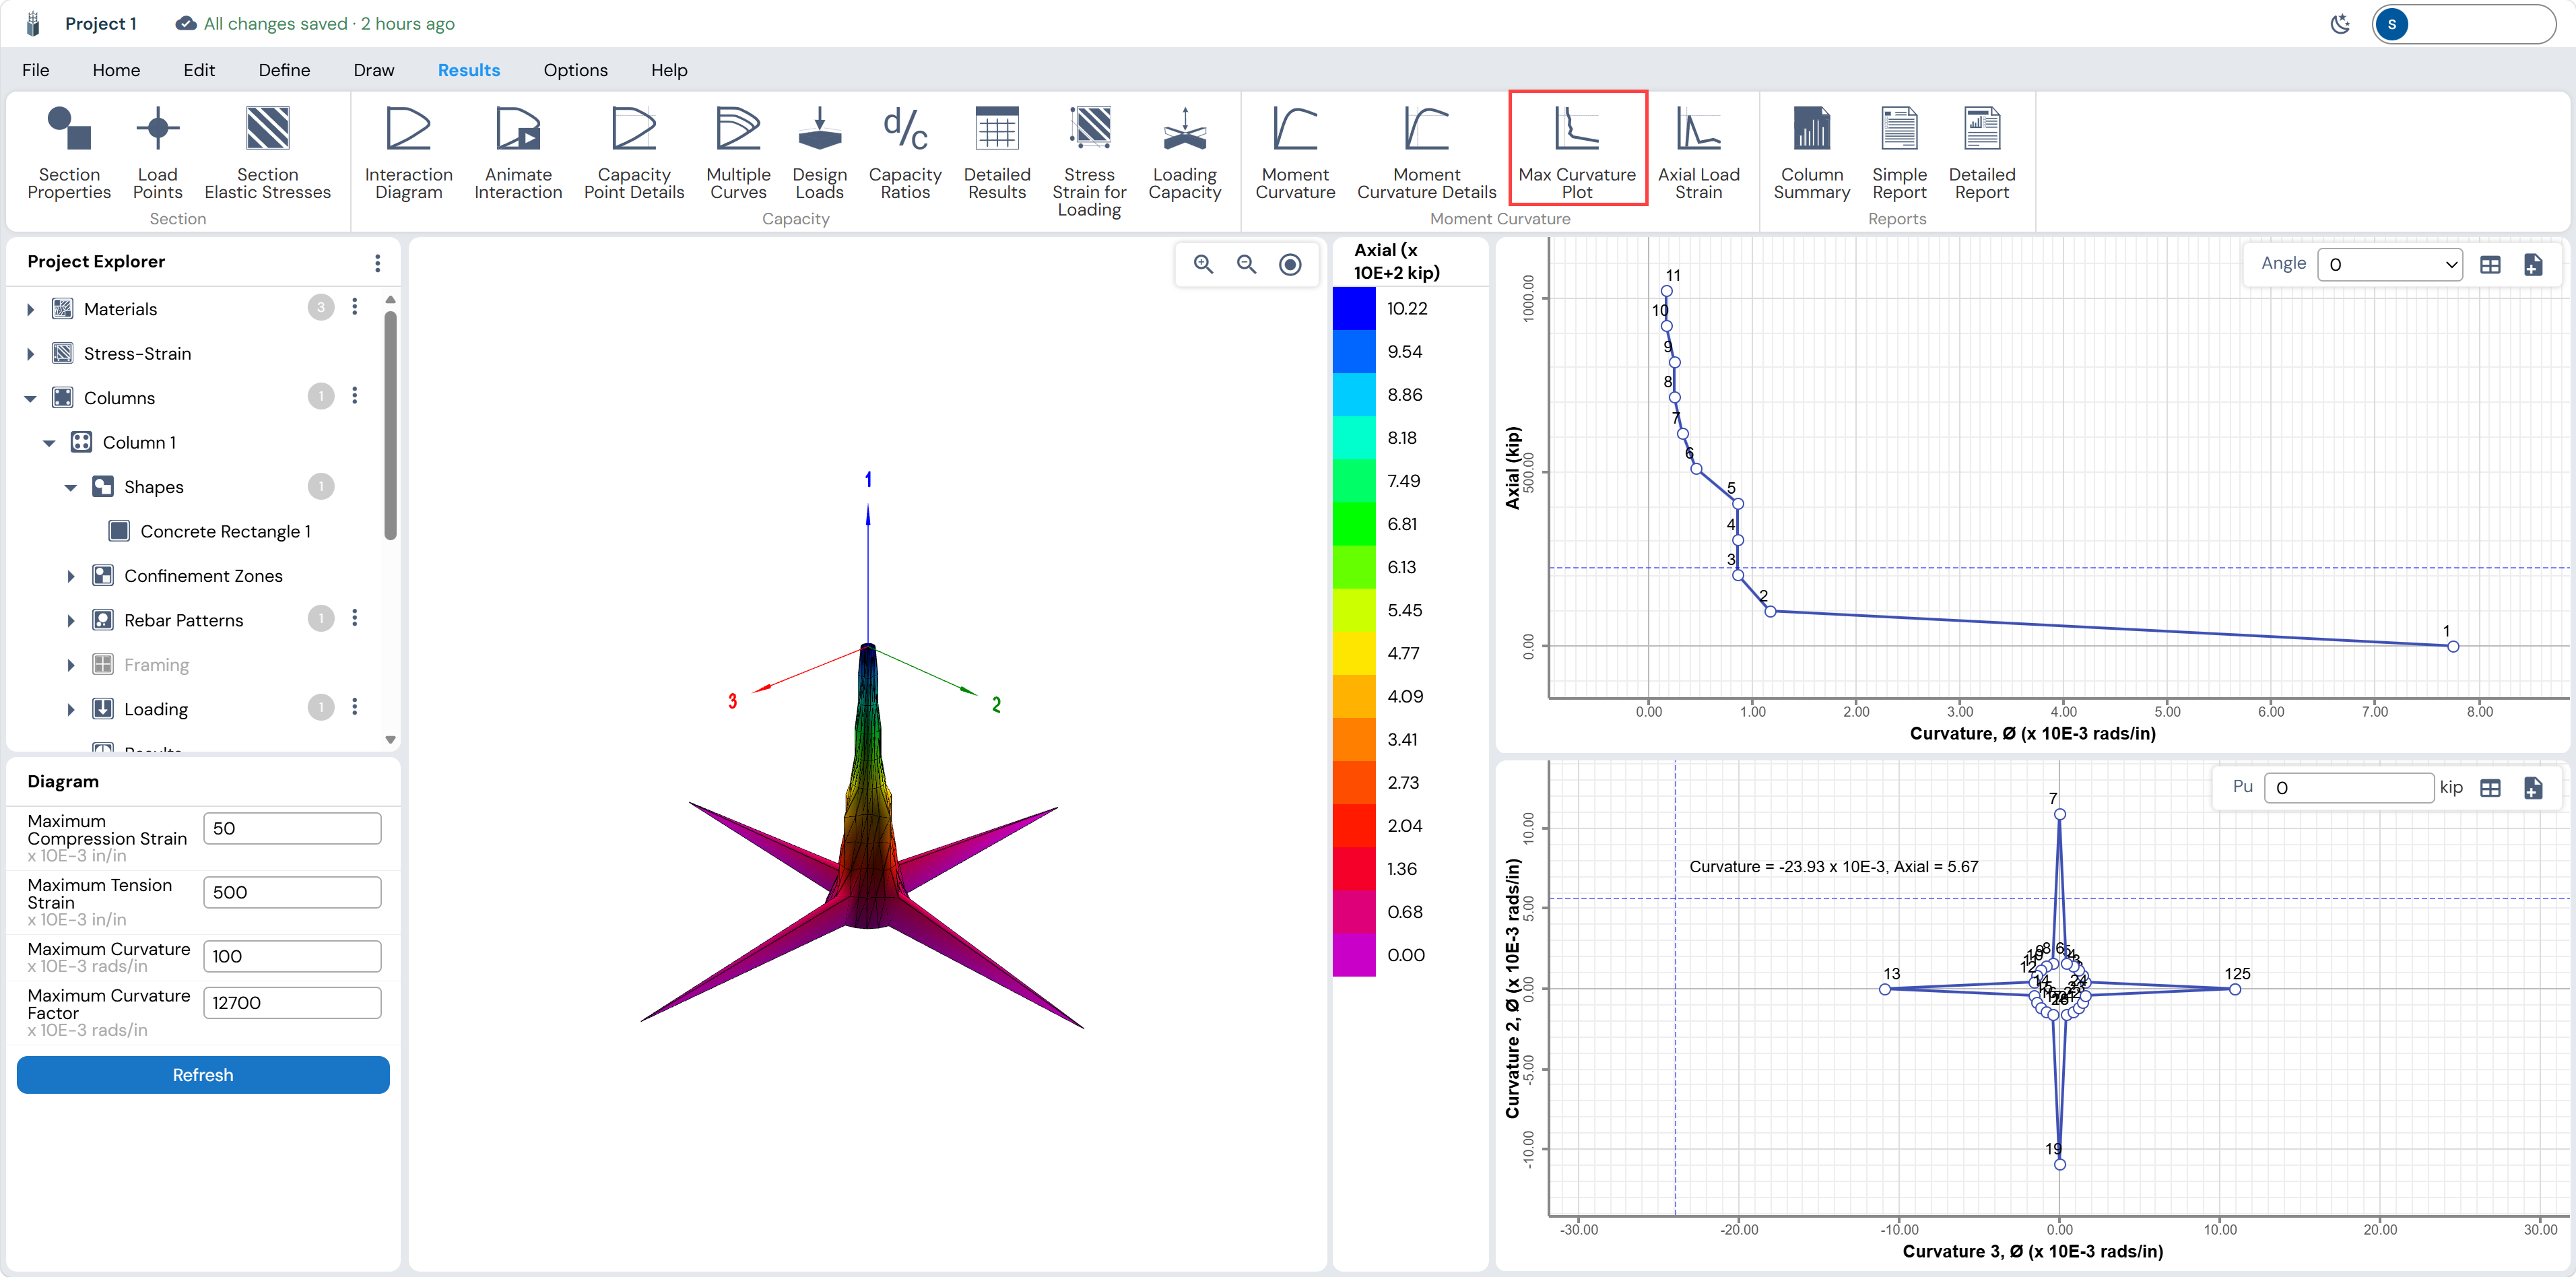
Click Max Curvature Plot in the ribbon. This view shows a three-dimensional moment-curvature surface that maps maximum curvature capacity as a function of both the curvature angle and the applied axial load level. The star-shaped 3D surface and the accompanying Axial Load vs. Curvature plots help evaluate ductility across the full range of loading conditions.
Final Report
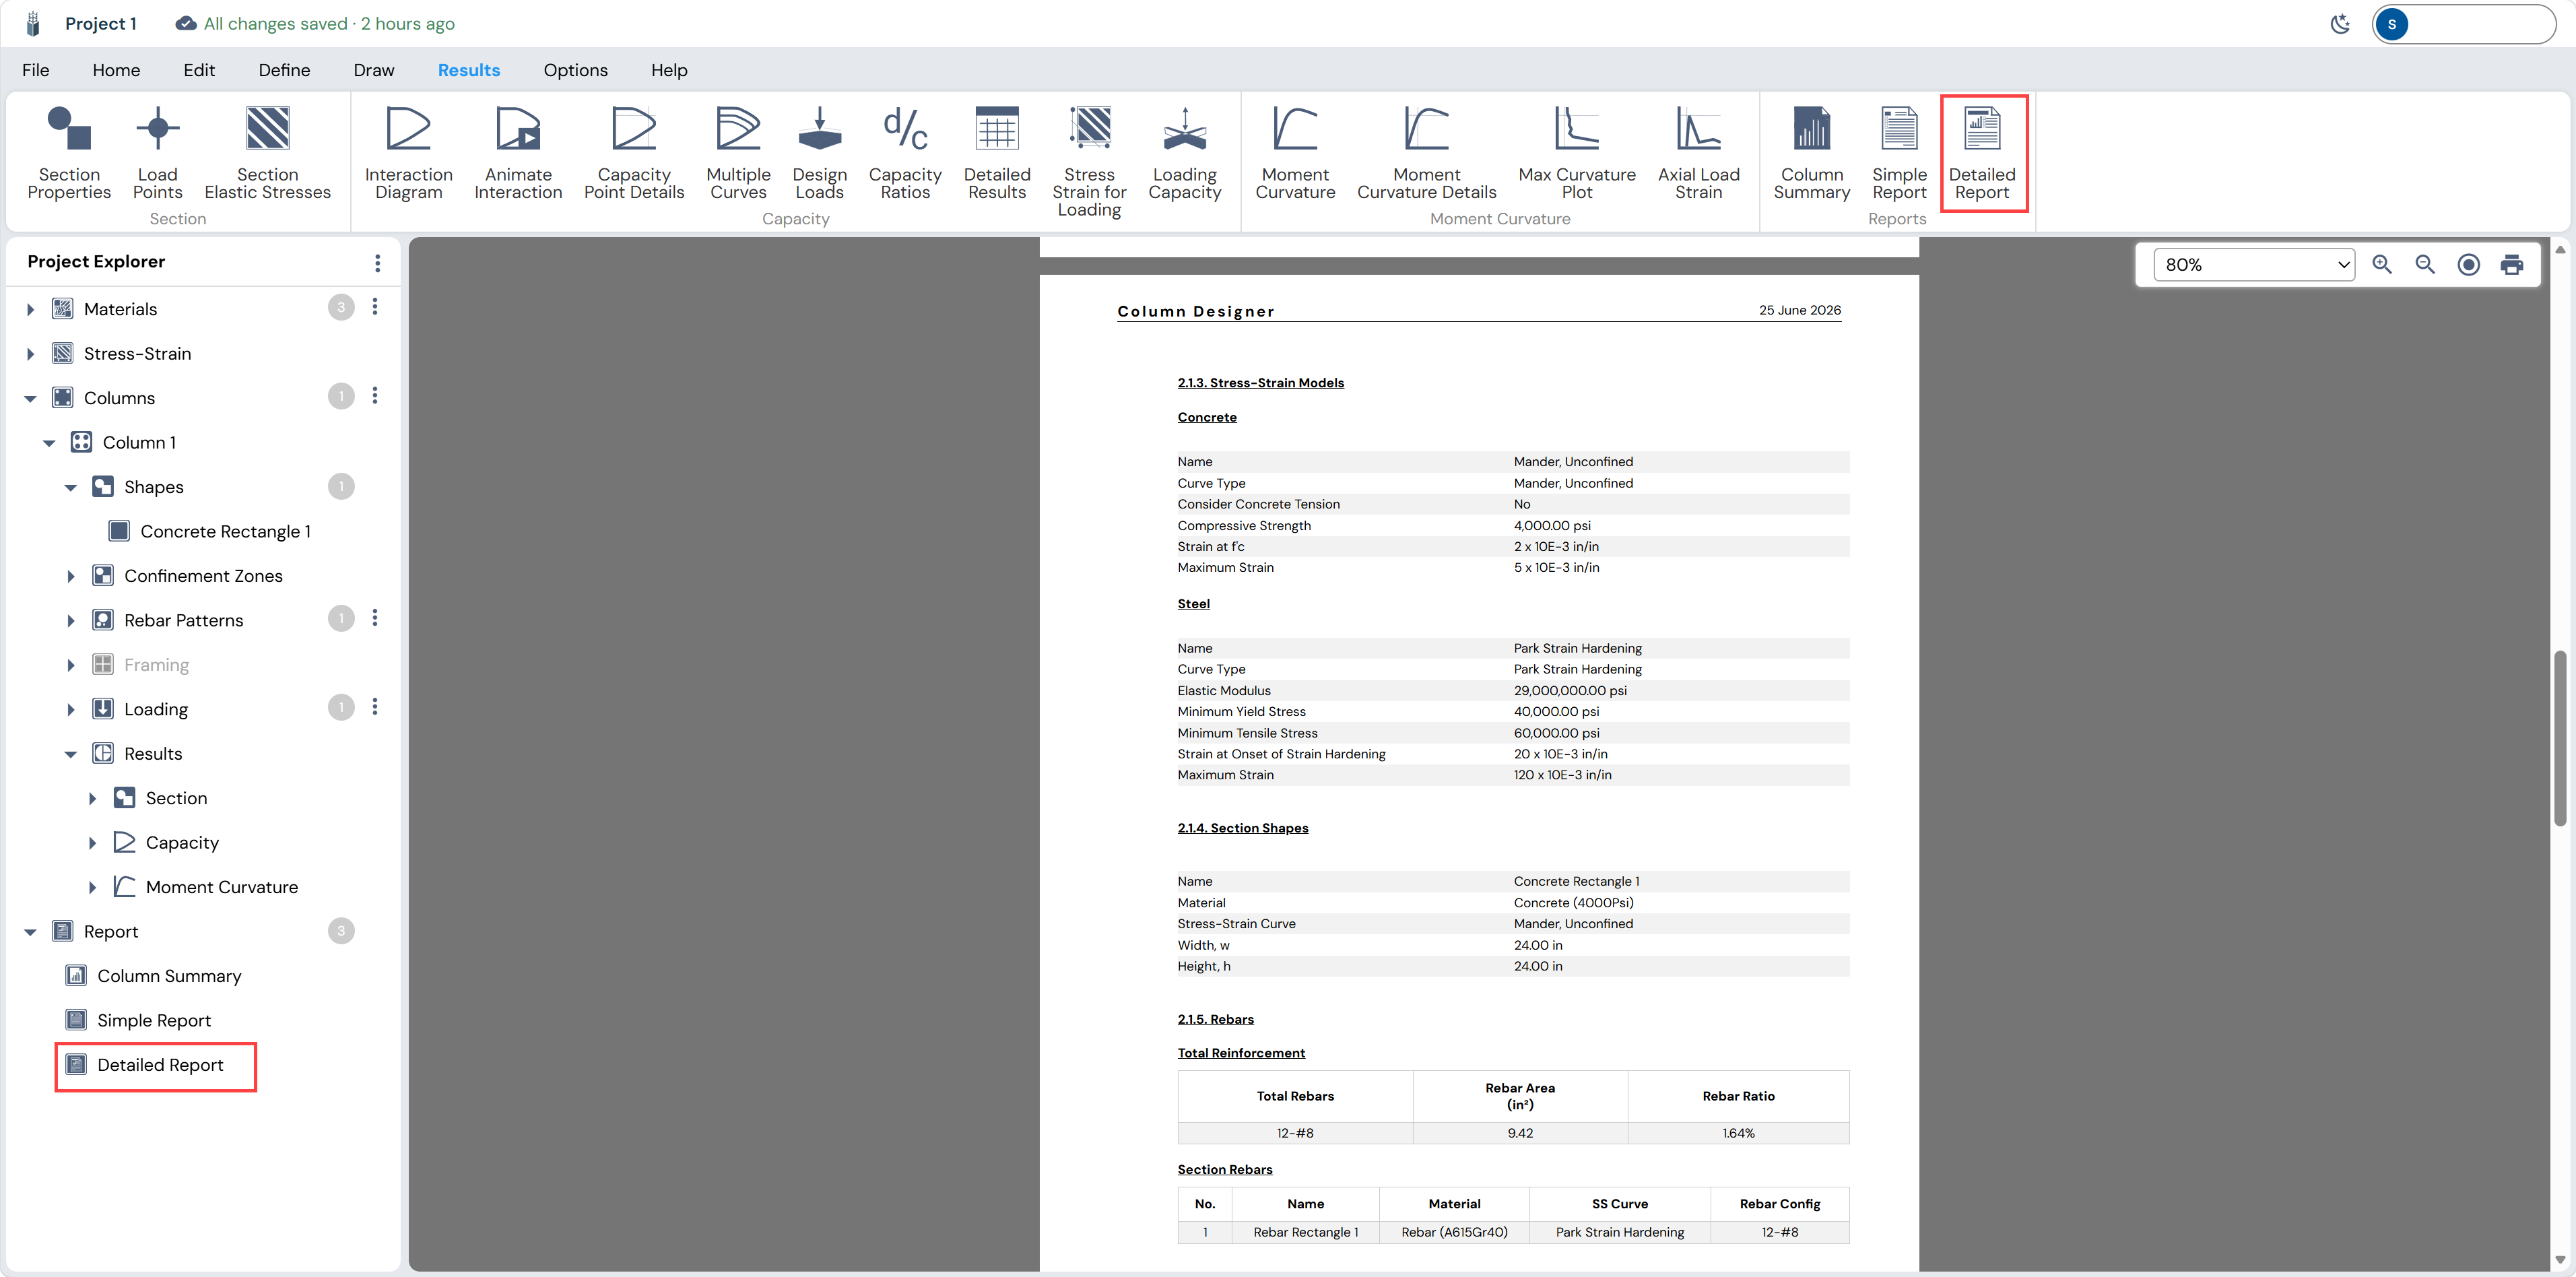
To access the full report at any time from the main workspace, click Detailed Report in the Results ribbon. The report viewer opens inline in the application with a complete formatted design report.
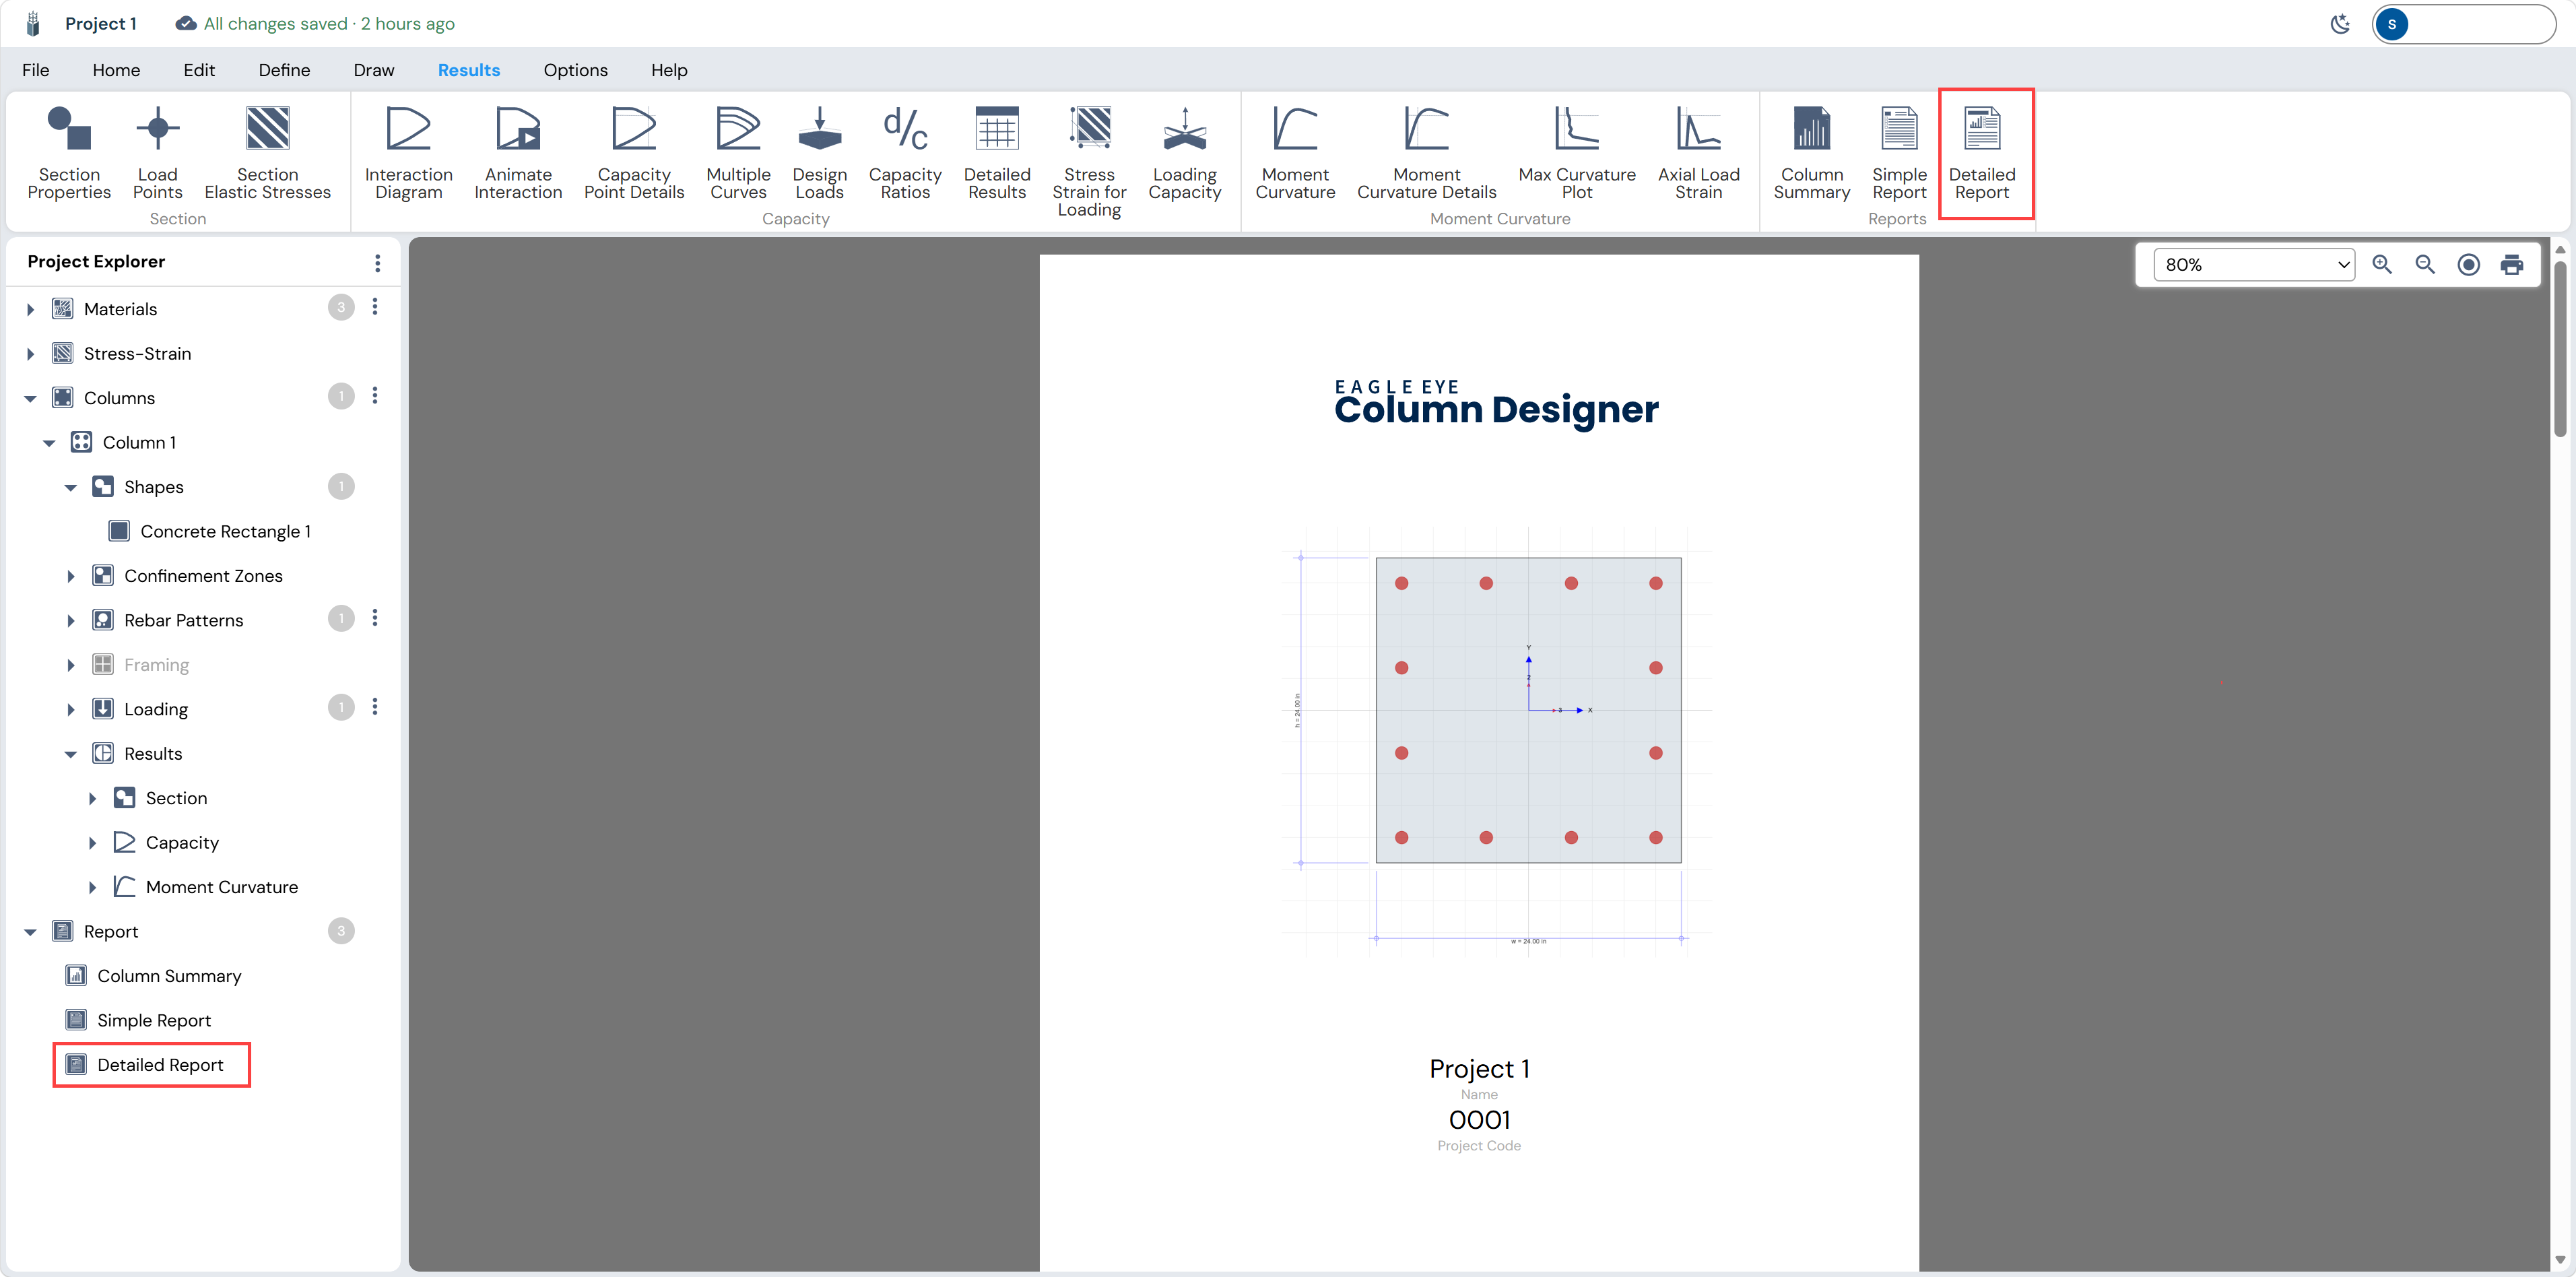
The report cover page includes the Eagle Eye Column Designer title, the column cross-section diagram, the project name, project code, date, engineer name, and company. Subsequent pages contain the full design data.
Glossary
| Term | Definition |
|---|---|
| ACI 318-19 | Building Code Requirements for Structural Concrete — American Concrete Institute, 2019 edition |
| Axial Load (Pu) | Factored compressive or tensile axial force applied to the column |
| Capacity Ratio (D/C) | Demand-to-Capacity ratio; must be ≤ 1.0 for an adequate design |
| Clear Cover | Clear distance from the outer concrete face to the outer surface of the transverse reinforcement |
| Compression-Controlled | ACI failure mode where the extreme tension steel strain ≤ 0.002 at nominal strength |
| f’c | Specified compressive strength of concrete (at 28 days) |
| fy | Specified minimum yield strength of reinforcing steel |
| Interaction Diagram | Graphical representation of the column’s combined axial force and bending moment capacity envelope |
| kip | Kilopound — unit of force equal to 1,000 lbs |
| kip-ft | Kilopound-foot — unit of moment |
| Moment Curvature (M-Φ) | Relationship between applied bending moment and section curvature; used to assess ductility |
| NA (Neutral Axis) | The line in the cross-section where bending strain is zero; separates compression and tension zones |
| P-M Interaction | Simultaneous axial load (P) and bending moment (M) demand on a section |
| Phi Factor (Φ) | ACI strength reduction factor applied to nominal capacities to account for variability |
| Rebar Ratio (ρ) | Ratio of total steel area to gross concrete area; ACI requires 0.01 ≤ ρ ≤ 0.08 |
| Stirrup | Transverse reinforcement (ties or spirals) providing shear resistance and confinem |