

Circular Column Design
Worked Example
Introduction
Eagle Eye Column Designer supports the design and analysis of circular reinforced concrete columns, which are common in buildings, bridges, elevated highways, parking structures, and seismic regions. Circular columns confined by spiral reinforcement provide superior ductility compared to tied rectangular columns, as the spiral continuously restrains lateral concrete expansion under axial load.
This tutorial demonstrates how to build, configure, and analyze a circular RC column entirely within Eagle Eye Column Designer without using the Quick Design Wizard. Instead, all inputs are entered directly through the Define ribbon and the Project Explorer, giving the user complete control over every parameter.
Tutorial Column Summary
| Parameter | Value |
|---|---|
| Column Shape | Circular |
| Stirrup Type | Tied |
| Radius, r | 15 in (diameter = 30 in) |
| Design Code | ACI 318-19, US Customary |
| Concrete Grade | f’c = 4,500 psi |
| Rebar Grade | Grade 60 (A615Gr60), fy = 60,000 psi |
| Confinement | Tied — Mander Circular Confined model |
| Column Height (L c) | 25 ft (unsupported) |
| Framing Condition | Fix-Fix (XZ and YZ planes) |
| Loading (Combination 1) | Pu = 1,000 kip, Mx-Top = 300 kip-ft, My-Top = 300 kip-ft |
| Sustained Load (P_sus) | 100 kip |
Creating a New Circular Column Project
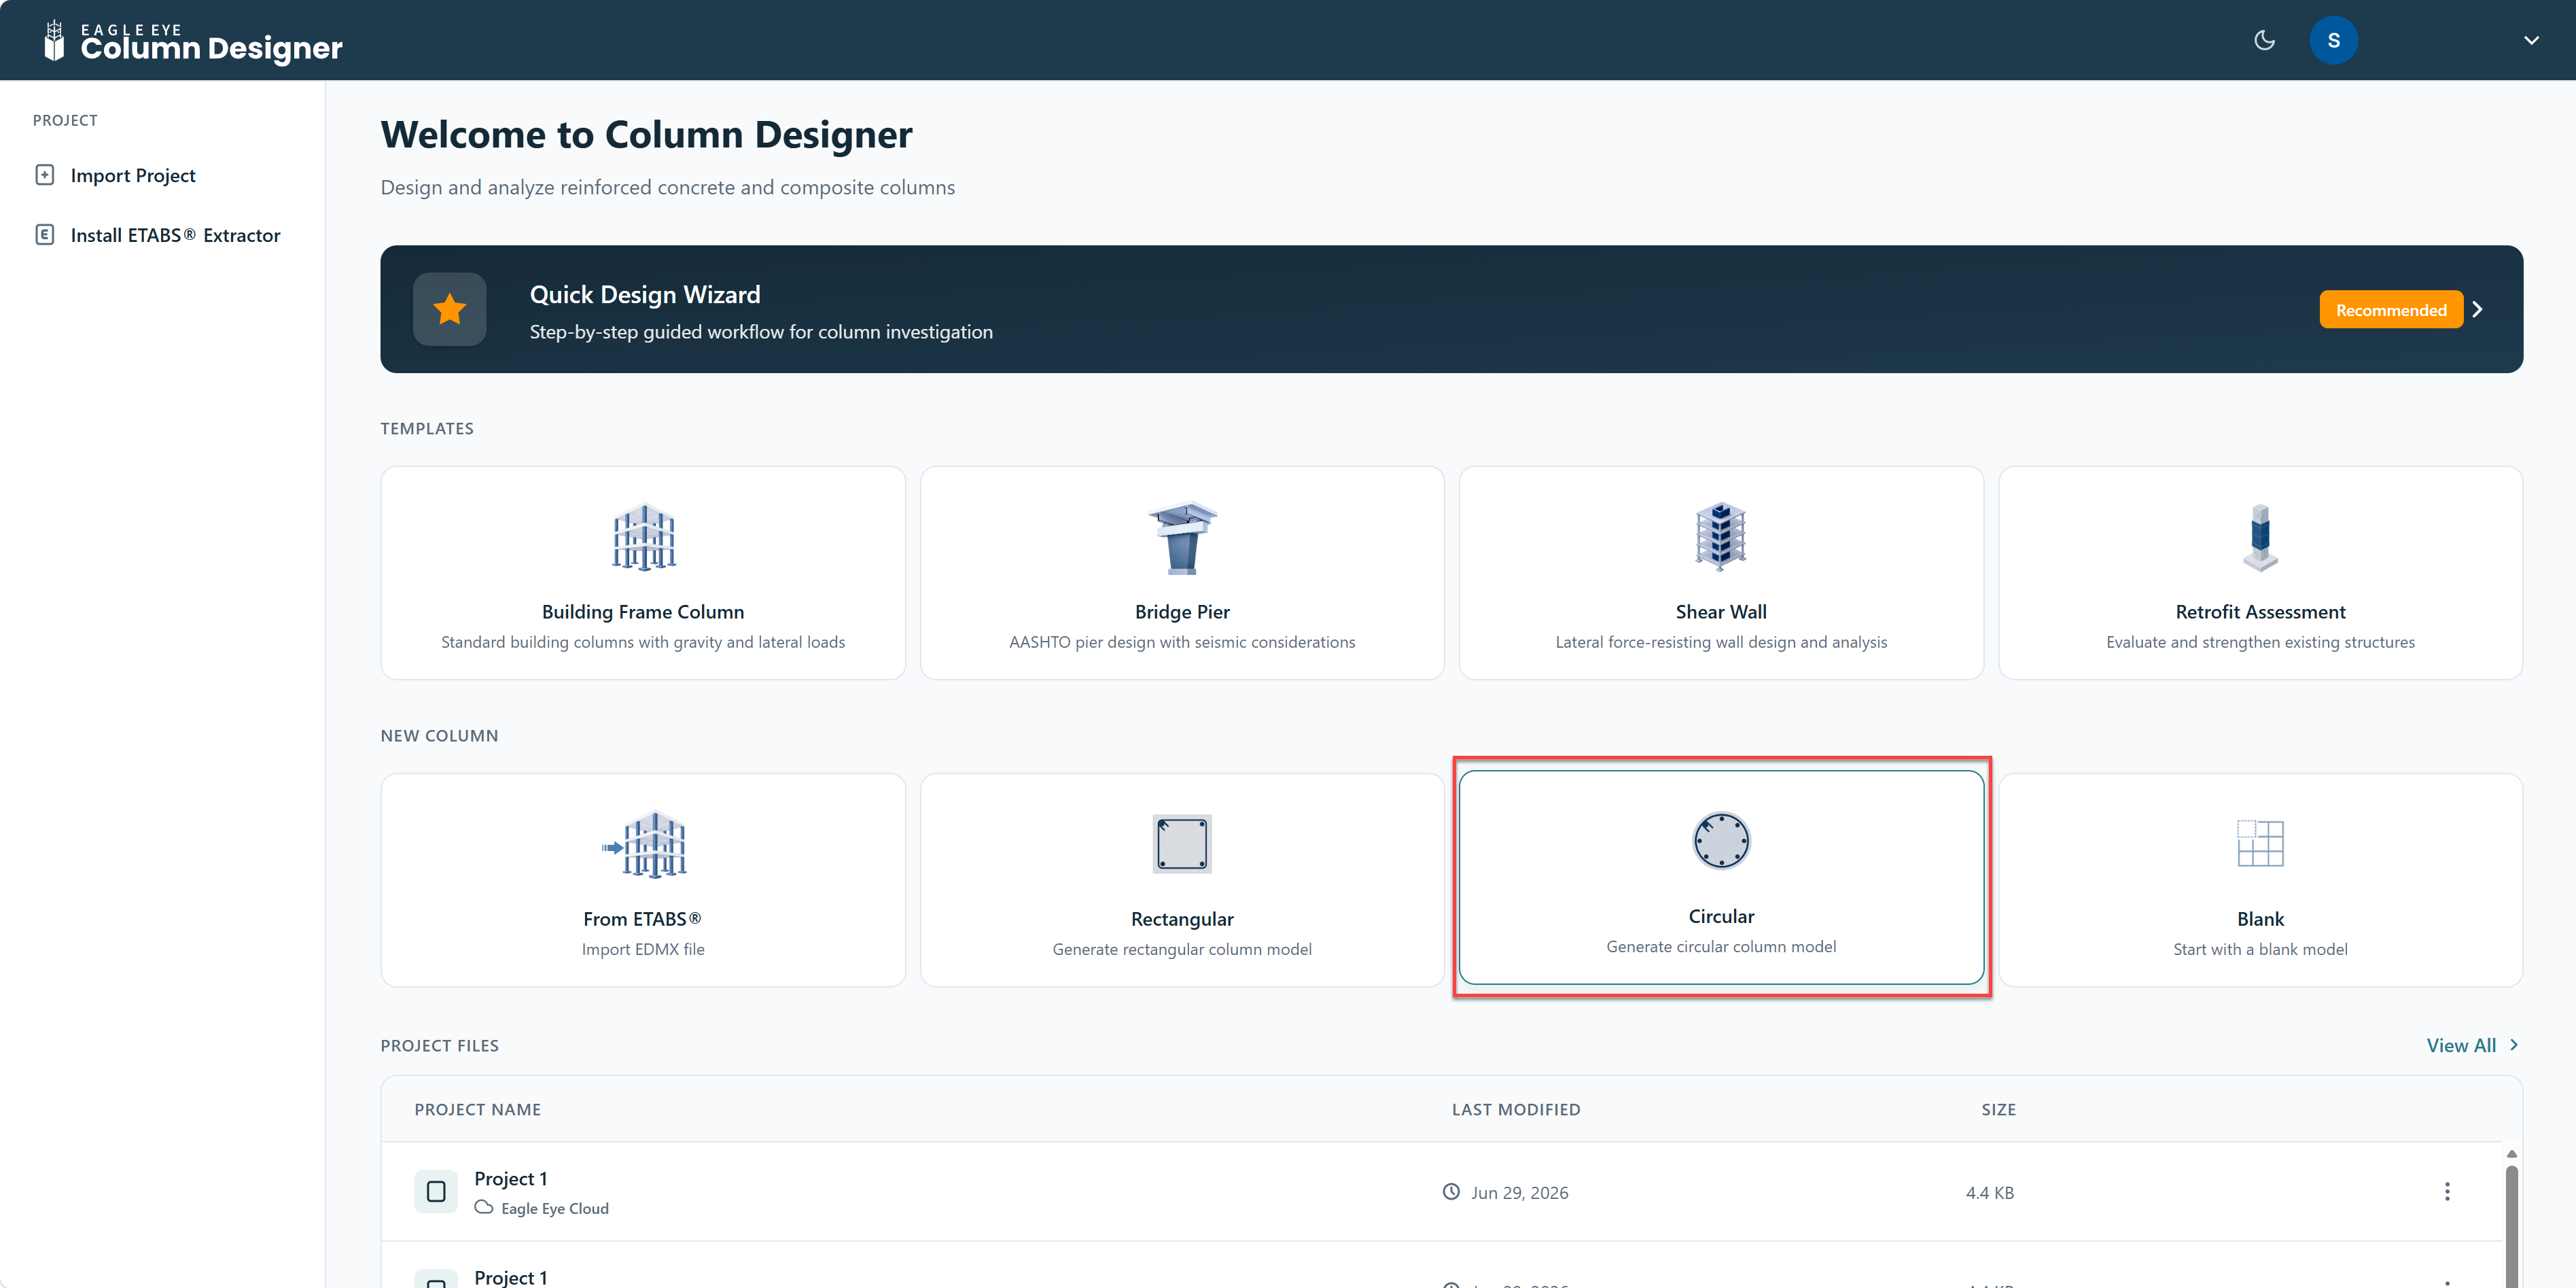
Navigate to column.eaglei.tech. On the home screen, locate the NEW COLUMN section and click Circular “Generate circular column model”. This immediately opens the main canvas workspace with a default circular concrete cross-section already placed on the drawing canvas.
Default Circular Section on Canvas
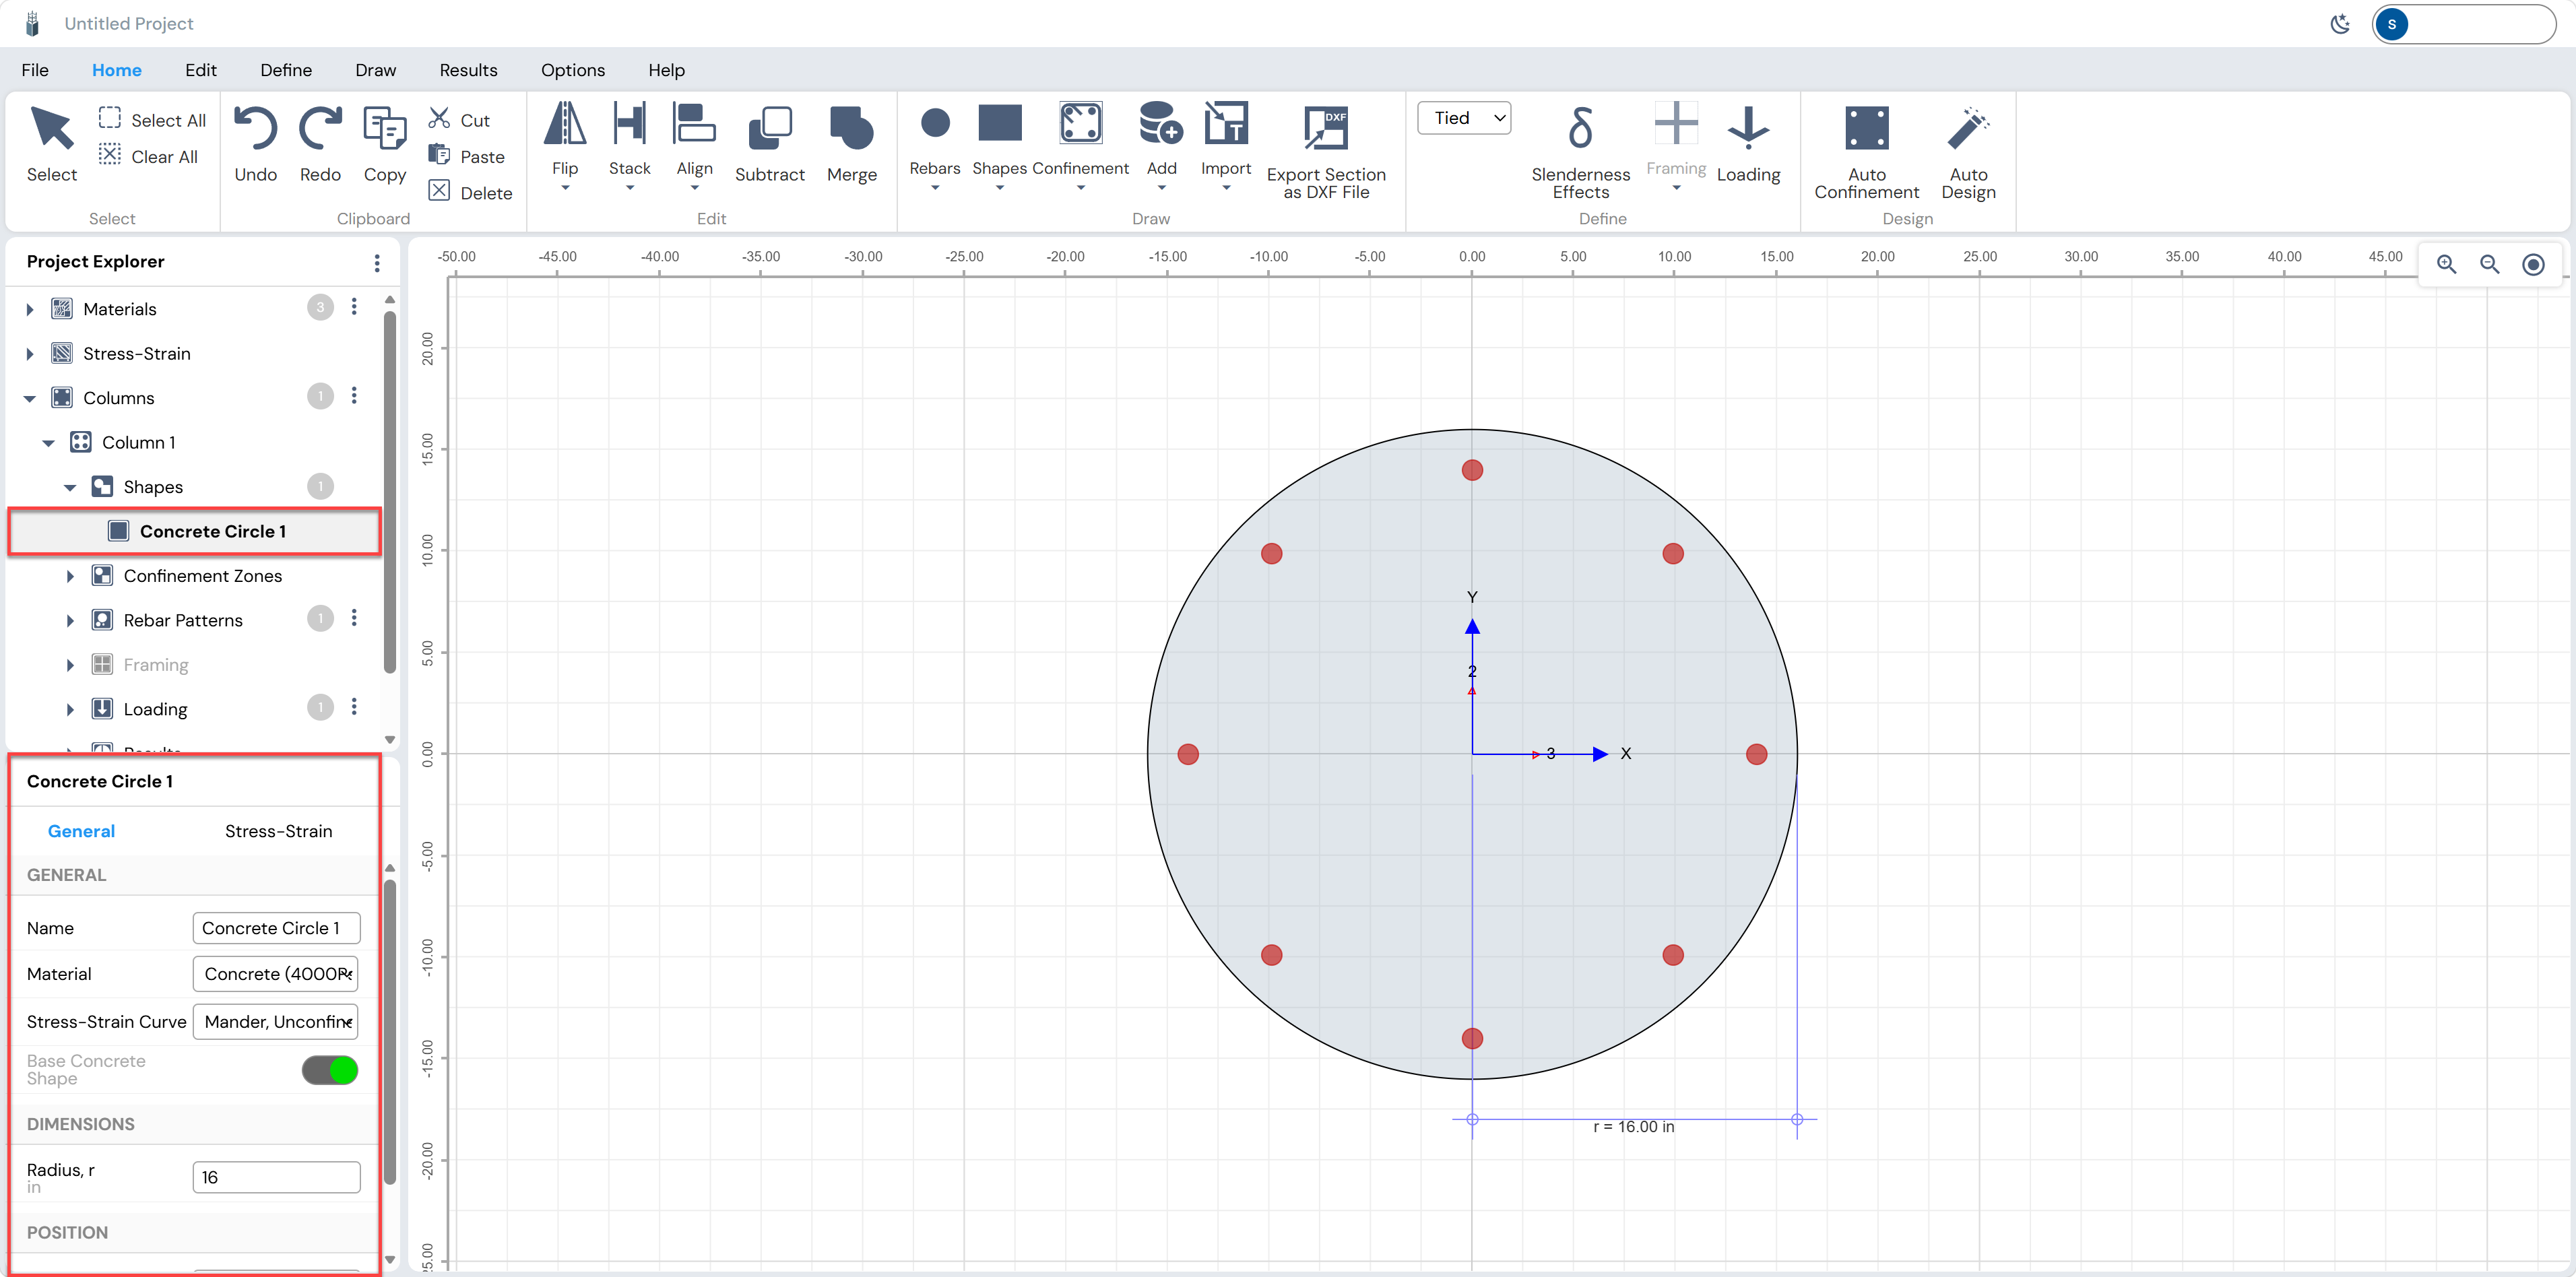
The workspace opens in the Home tab showing the circular concrete cross-section on the drawing canvas. The Project Explorer on the left lists the model tree.
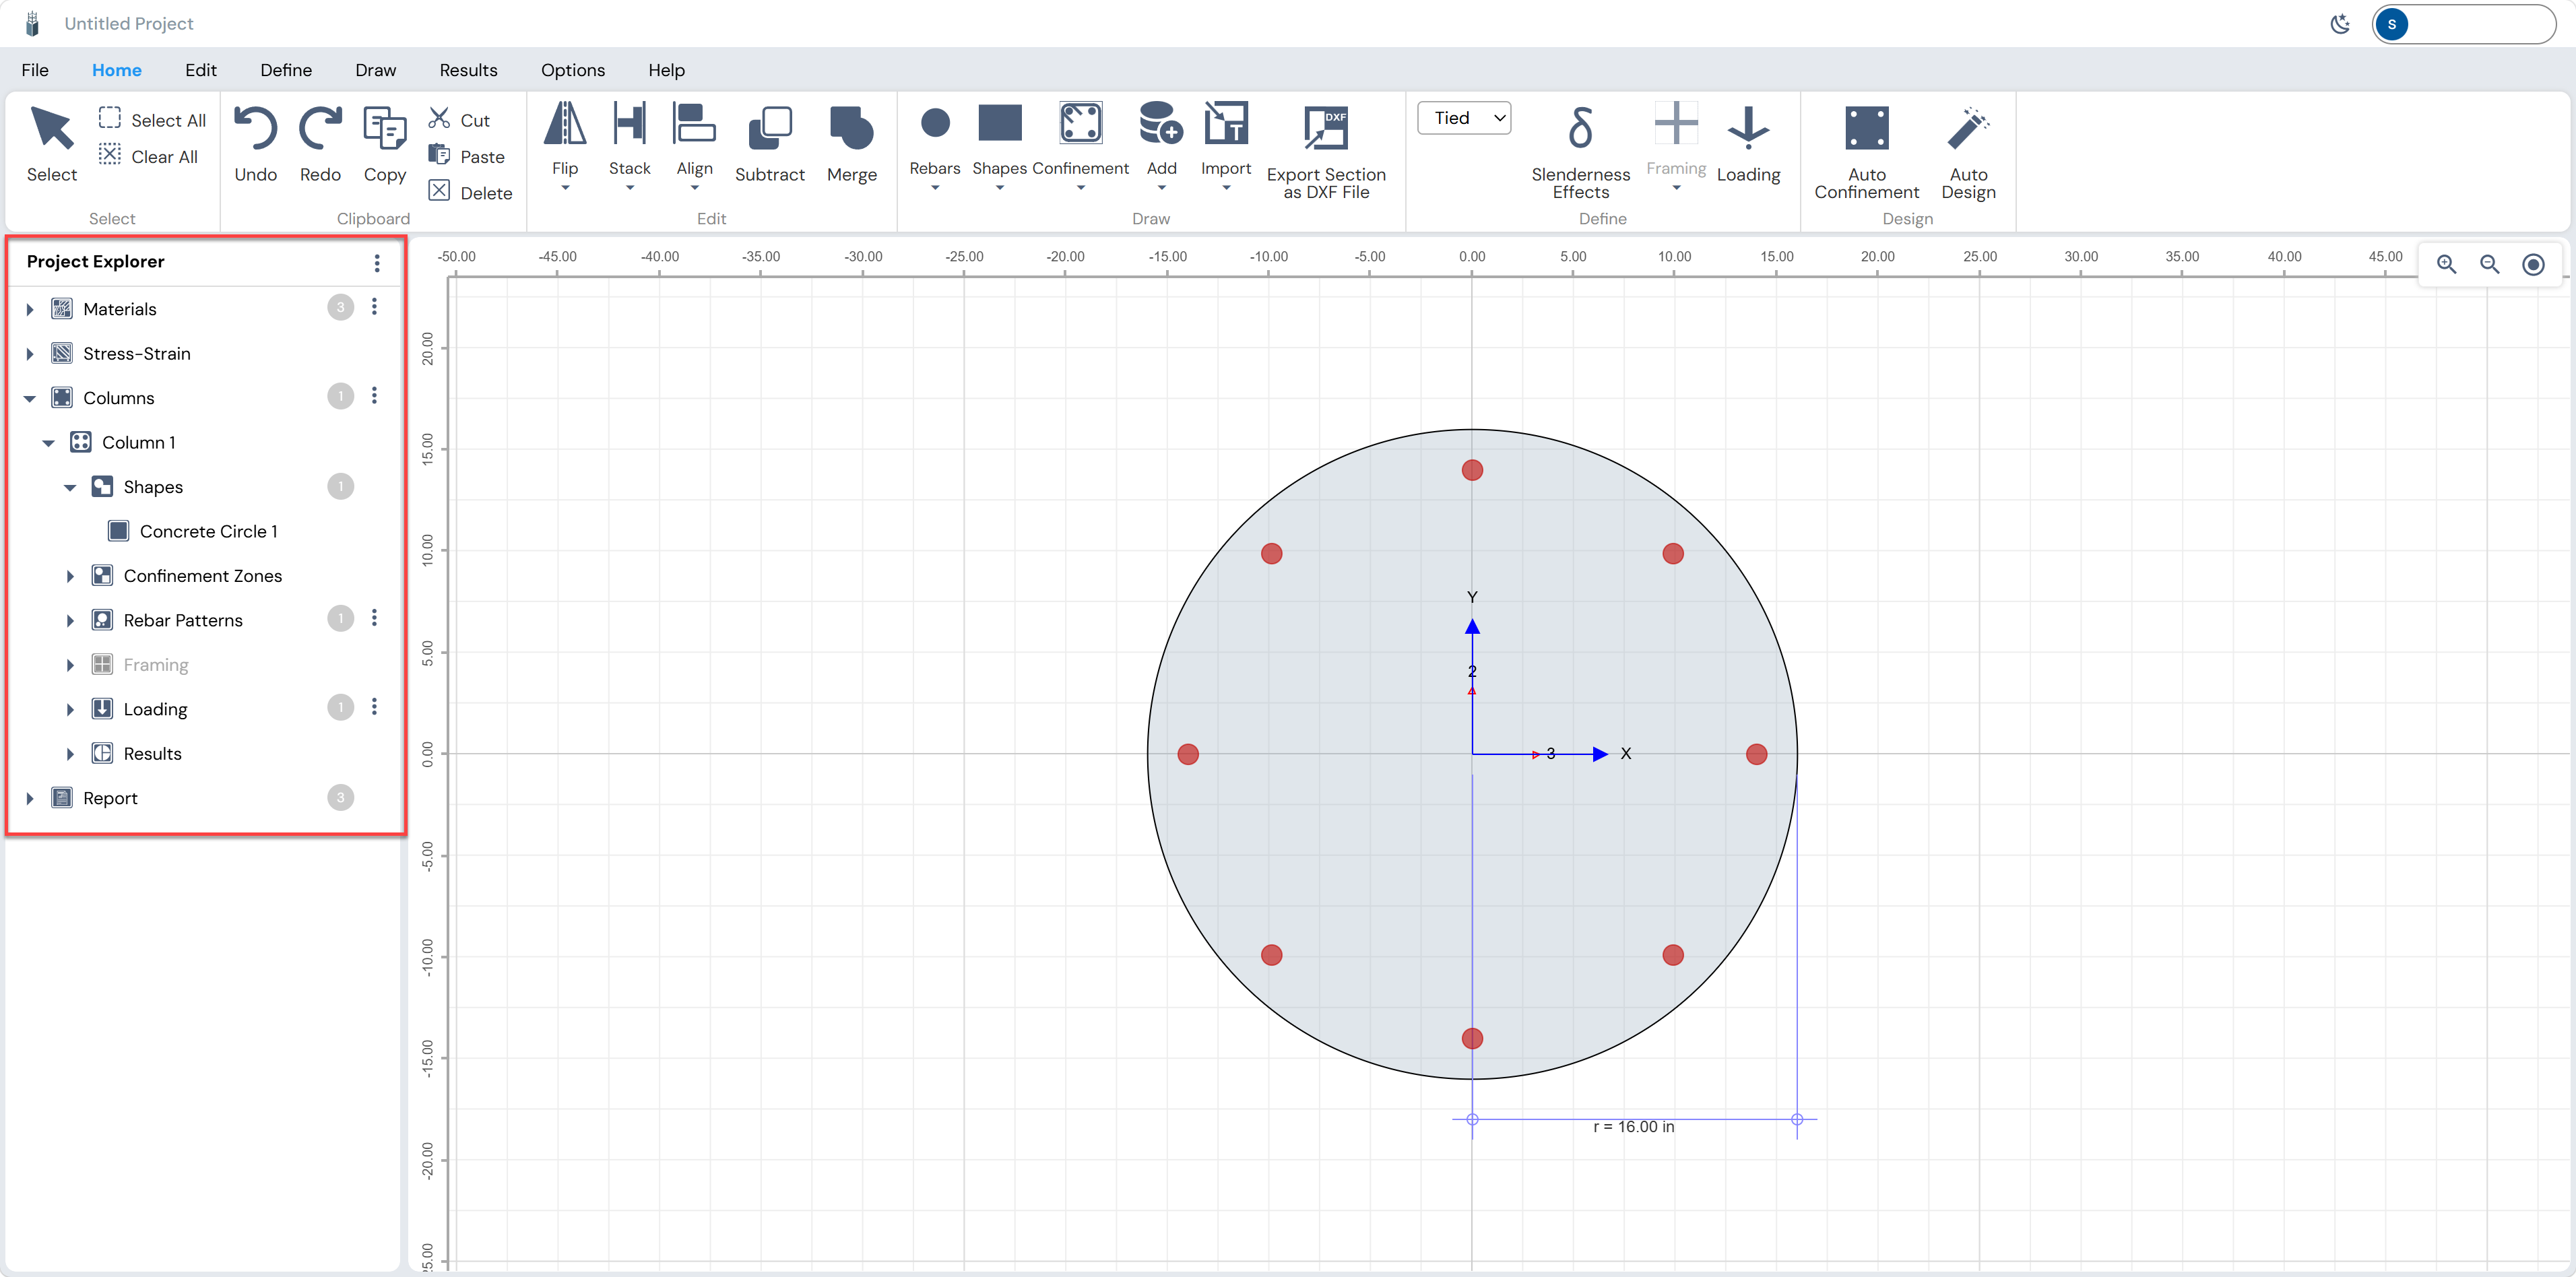
Clicking on the Concrete Circle 1 node in the Project Explorer opens the section properties panel at the bottom-left showing the current radius. The default radius is 16 in (diameter 32 in). This will later be adjusted.
Modifying Material Properties
Column Designer creates default materials (Concrete 4000Psi, Rebar A615Gr40, Steel A36) for every new project. For this tutorial both the concrete grade and the rebar grade will be upgraded. Access the Define Materials dialog by clicking Define → Materials in the Define ribbon, or by right-clicking the Materials node in the Project Explorer.
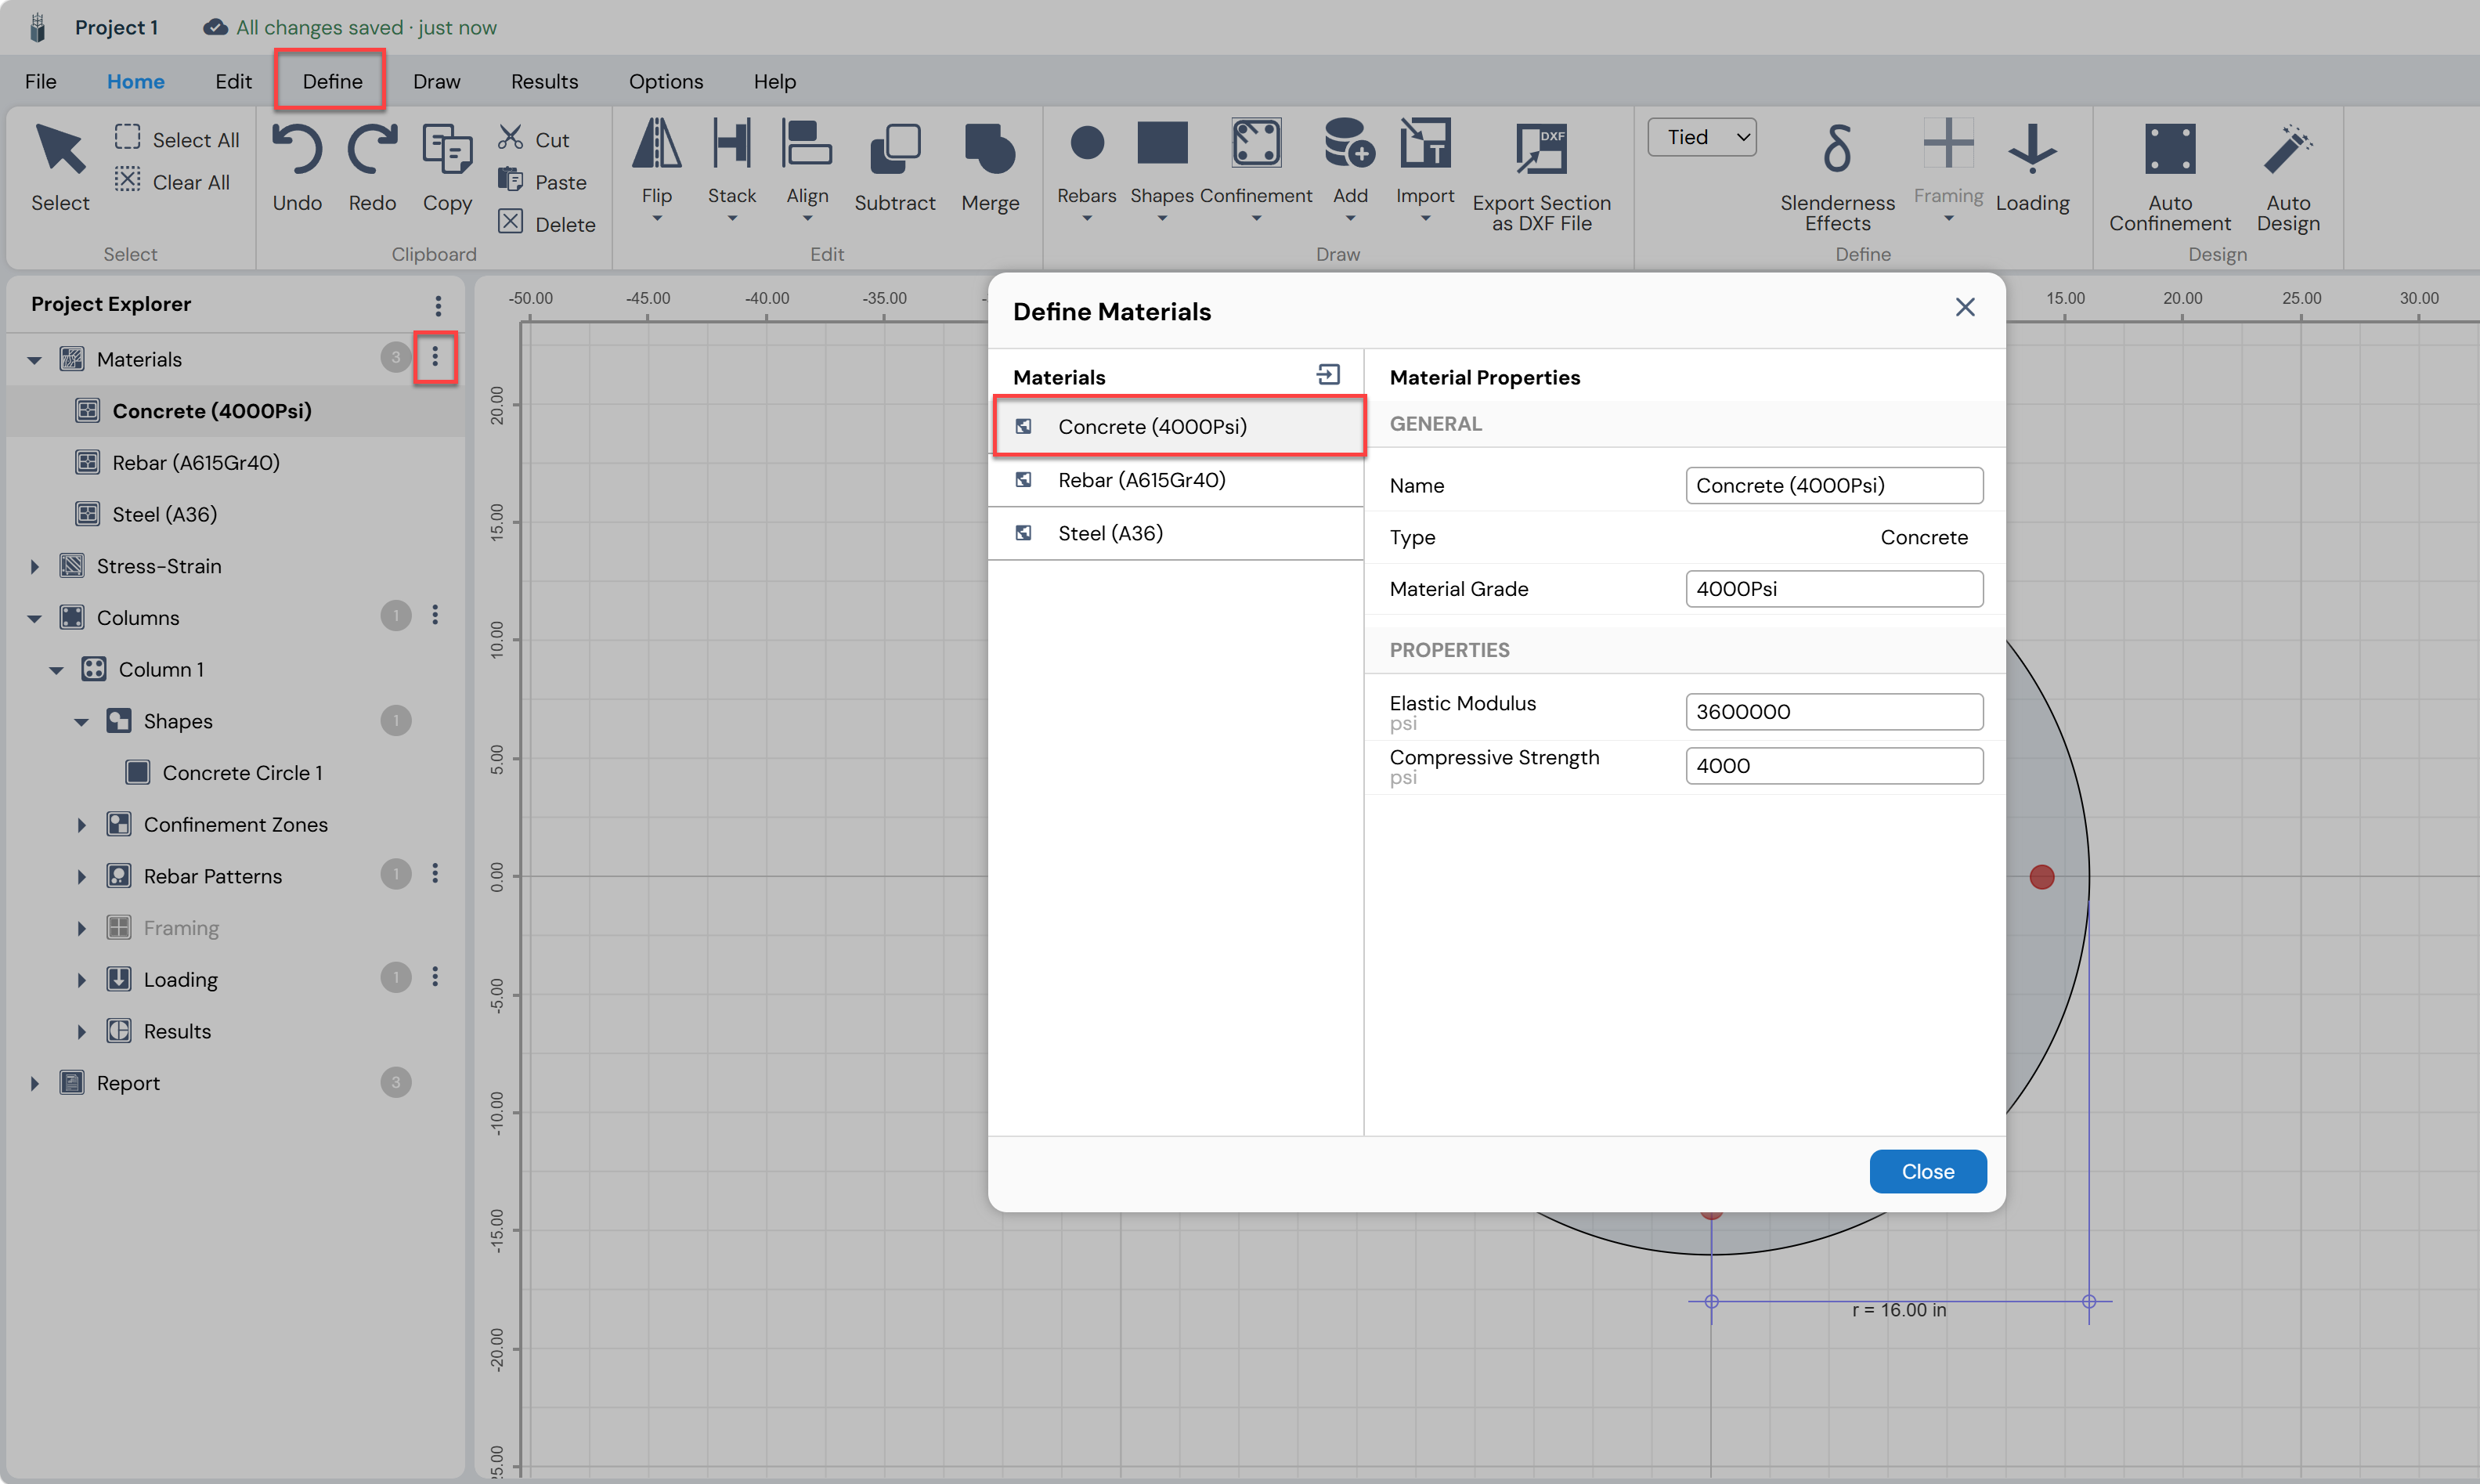
Select Concrete (4000Psi) in the materials list. In the Material Properties panel on the right, update the following fields:
| Field | Old Value | New Value |
|---|---|---|
| Name | Concrete (4000Psi) | Concrete (4500Psi) |
| Material Grade | 4000Psi | 4500Psi |
| Elastic Modulus | 3,600,000 psi | 3,600,000 psi |
| Compressive Strength (f’c) | 4,000 psi | 4,500 psi |
Select Rebar (A615Gr40) in the materials list. Update the material to Grade 60 as follows:
| Field | Old Value | New Value |
|---|---|---|
| Name | Rebar (A615Gr40) | Rebar (A615Gr60) |
| Material Grade | Grade 40 | Grade 60 |
| Minimum Yield Stress (fy) | 40,000 psi | 60,000 psi |
| Minimum Tensile Stress (fu) | 60,000 psi | 80,000 psi |
| Expected Yield Stress | 44,000 psi | 64,000 psi |
| Expected Tensile Stress | 66,000 psi | 86,000 psi |
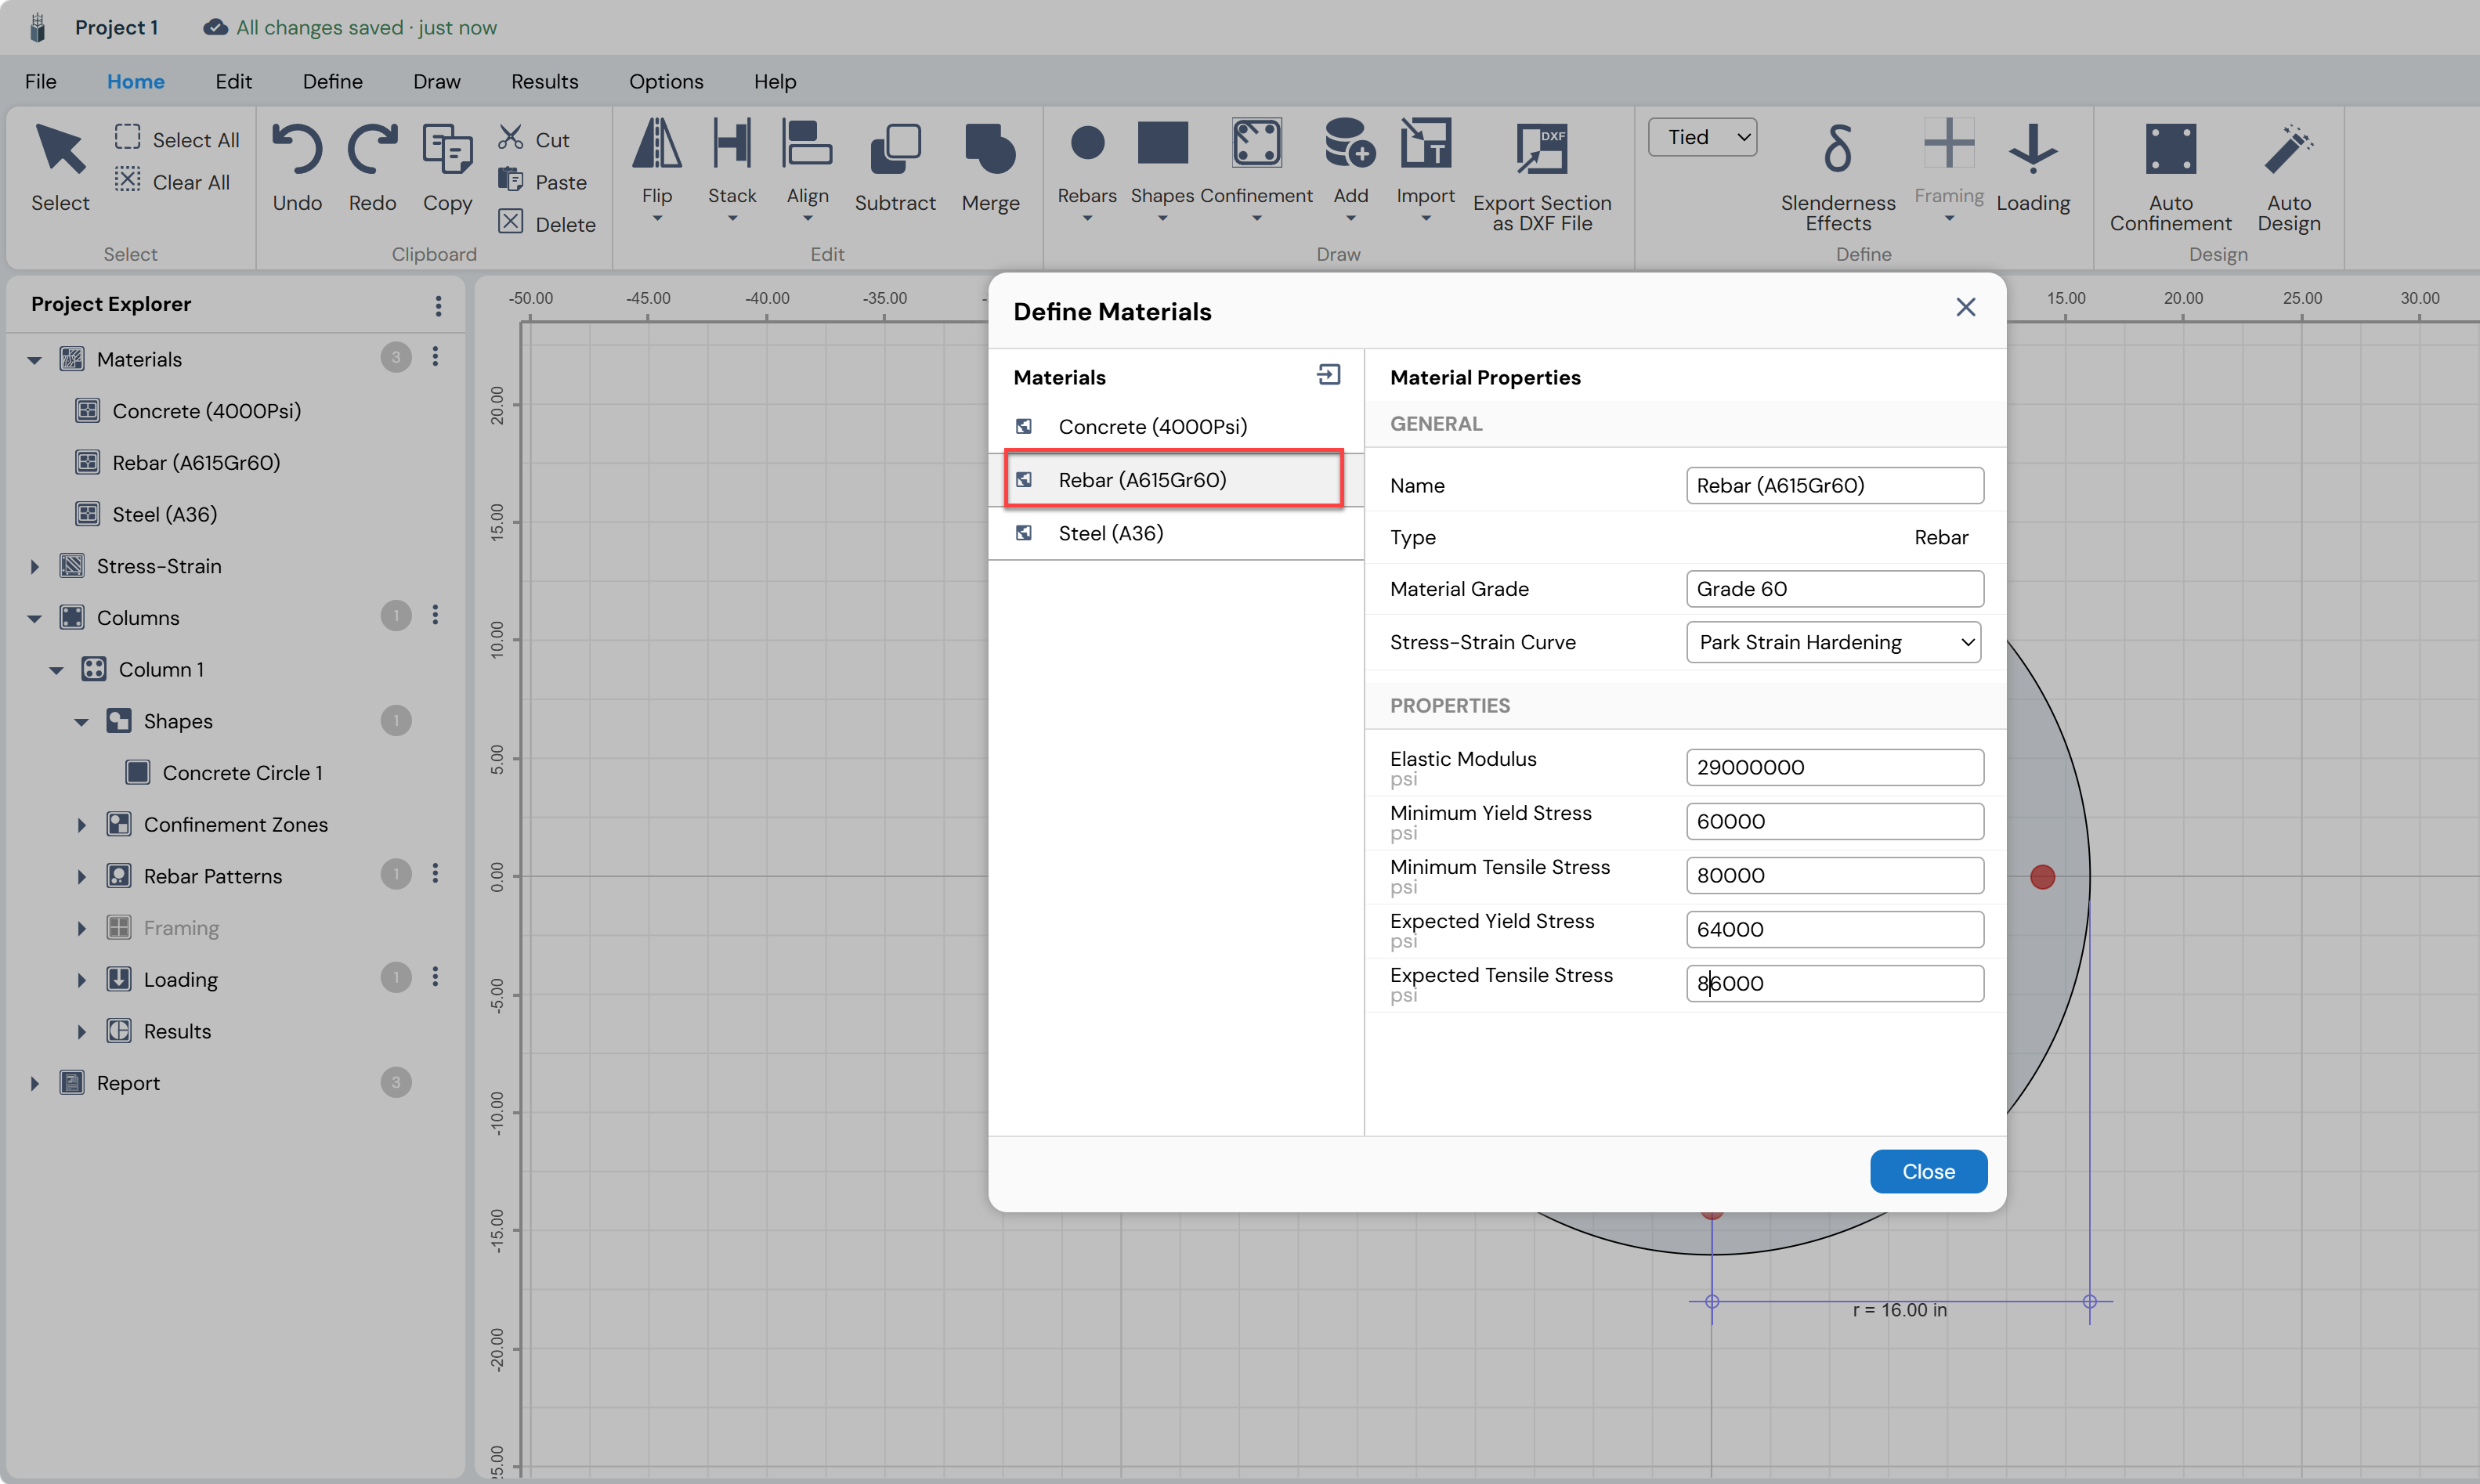
Click Close when done. The Project Explorer will now reflect the updated material names.
Reviewing Stress-Strain Curves
Column Designer automatically generates stress-strain curves for all defined materials. These curves govern the fiber-level calculations in the cross-section analysis. The Stress-Strain node in the Project Explorer provides access to all active curves.
Mander Unconfined (Concrete)
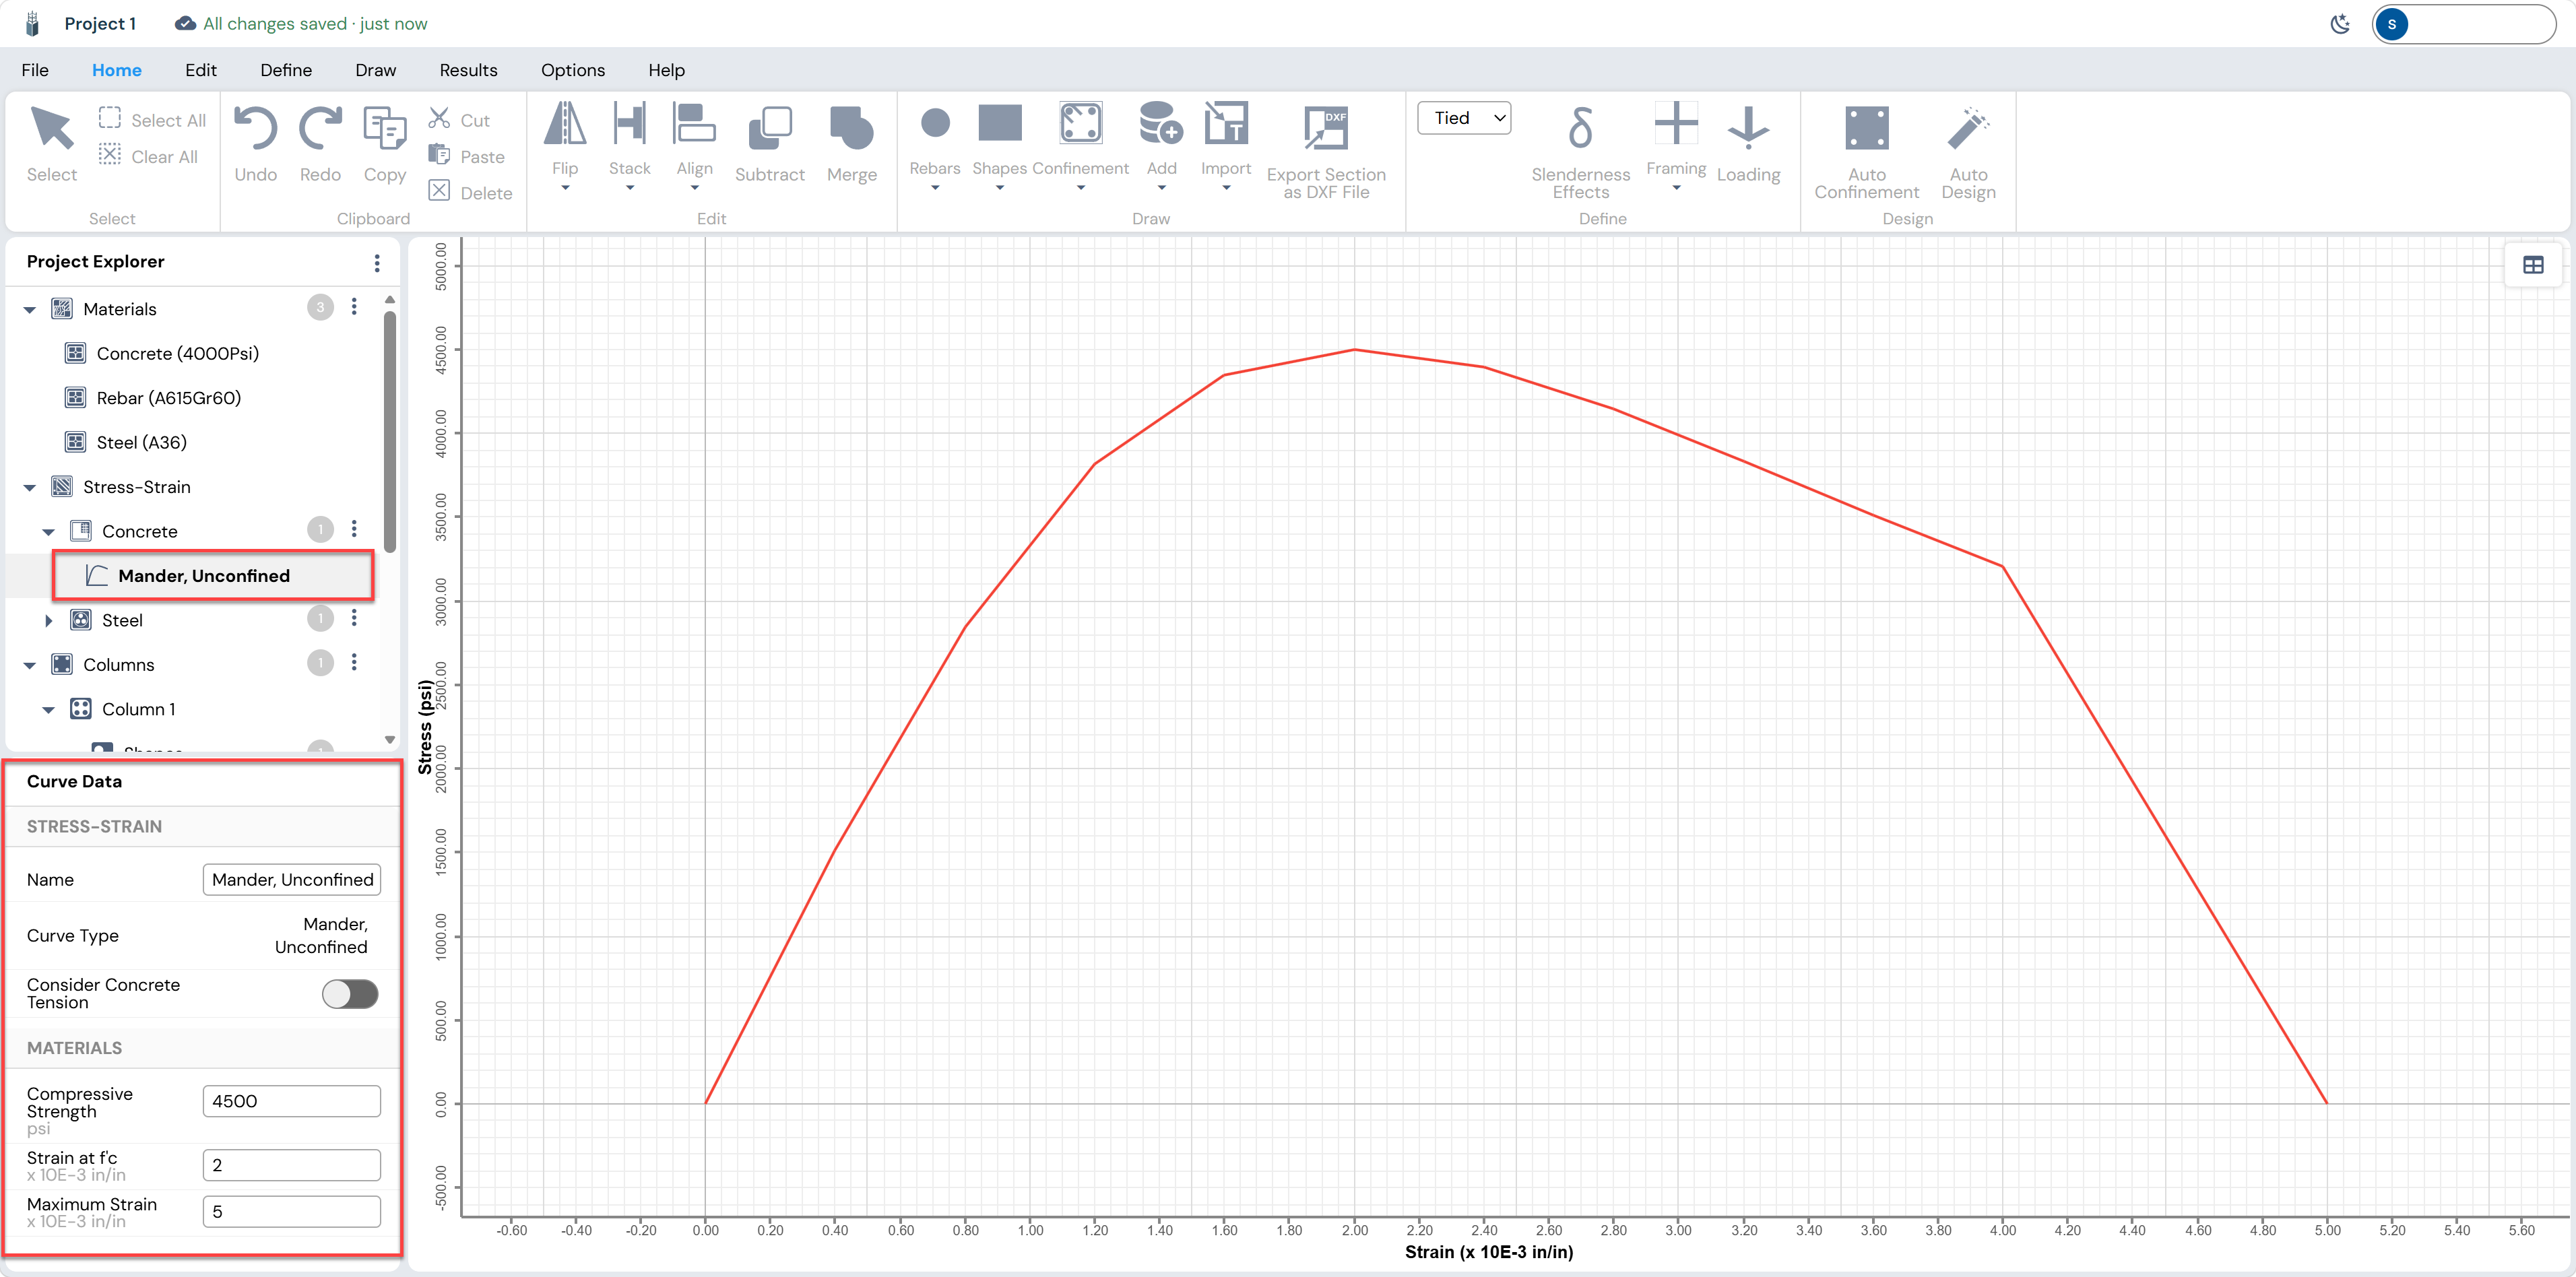
Click the Mander, Unconfined curve under Stress-Strain → Concrete. The canvas switches to the stress-strain plot viewer. The left panel (Curve Data) shows:
| Property | Value | Description |
|---|---|---|
| Curve Type | Mander, Unconfined | Parabolic-linear model for unconfined cover concrete |
| Compressive Strength | 4,500 psi | Peak stress from updated material definition |
| Strain at fc (ε’c) | 2 × 10⁻³ in/in | Strain at peak stress (0.002) |
| Maximum Strain (εcu) | 5 × 10⁻³ in/in | Limiting crushing strain (0.005) |
| Consider Concrete Tension | Off | Tension capacity ignored (conservative) |
Park Strain Hardening (Rebar)
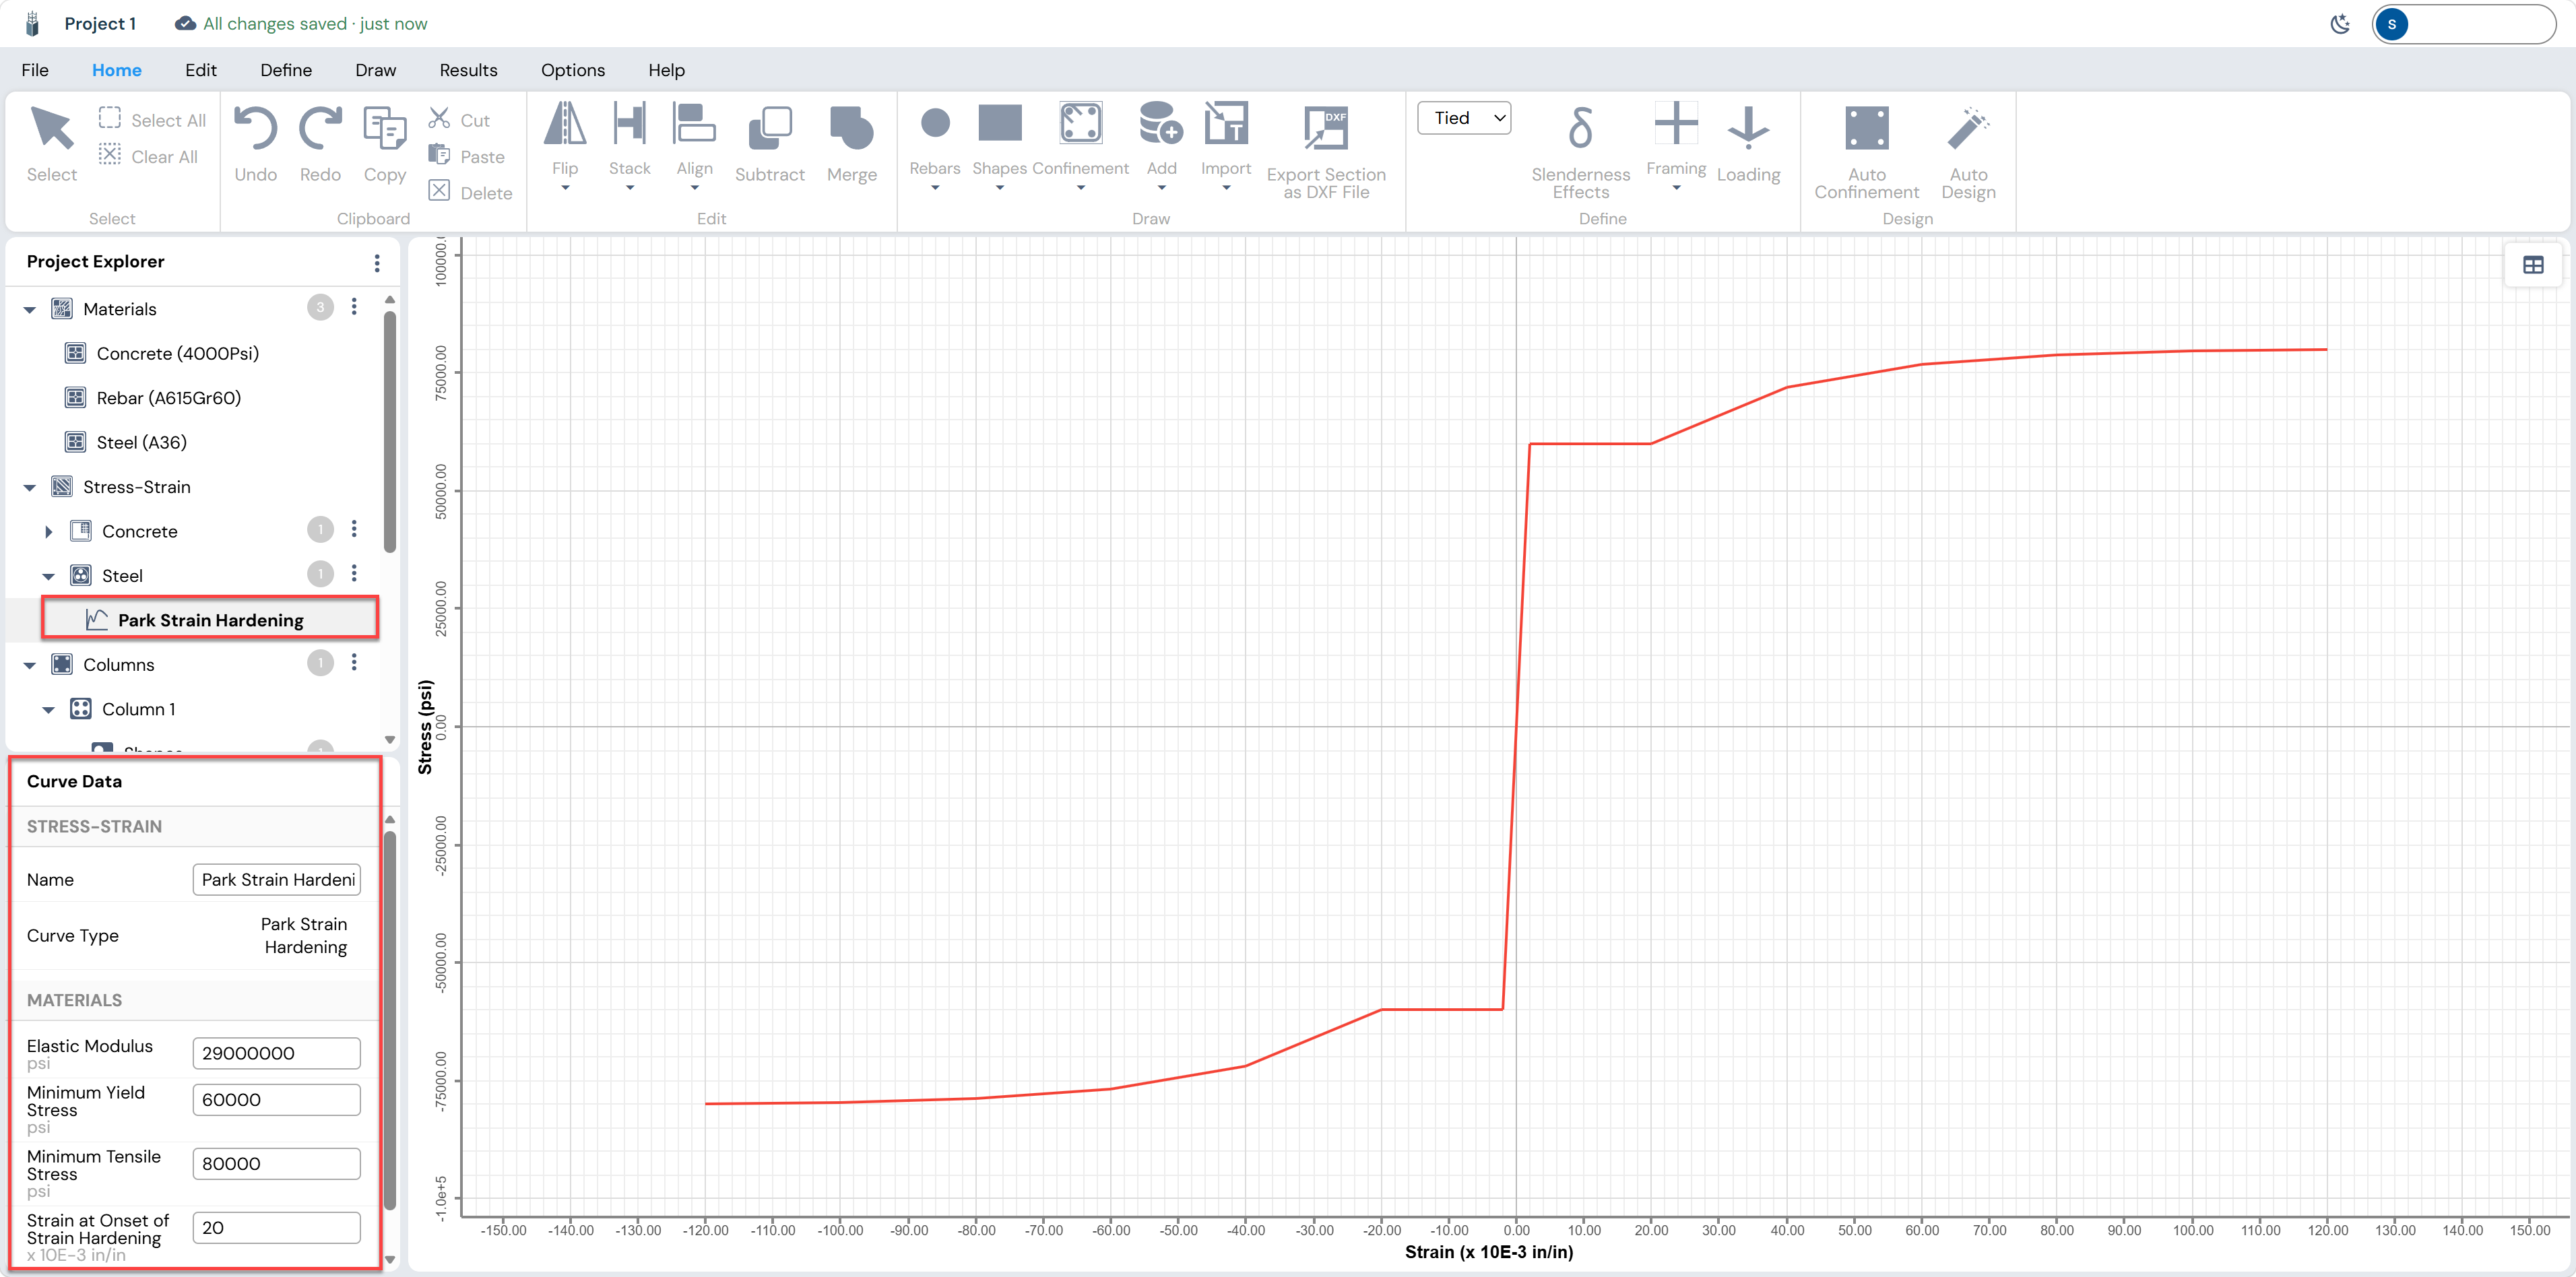
Click the Park Strain Hardening curve under Stress-Strain → Steel. This model captures four distinct zones of rebar behavior per the Park Strain Hardening model, appropriate for Grade 60 bars:
| Zone | Description | Key Parameters |
|---|---|---|
| Elastic (OA) | Linear — slope = Es = 29,000,000 psi | Up to εy = fy / Es = 60,000/29,000,000 ≈ 0.00207 |
| Yield Plateau (AB) | Perfectly plastic at fy = 60,000 psi | Extends to onset of strain hardening (εsh ≈ 20 × 10⁻³) |
| Strain Hardening (BC) | Nonlinear rise toward fu | Governed by fu = 80,000 psi |
| Fracture | Post-fu softening | Maximum strain = 120 × 10⁻³ |
Section Geometry and Reinforcement
Return to the Home tab to work on section geometry. The Concrete Circle 1 shape and Rebar Circle 1 pattern are already present in the Project Explorer and can be edited directly in the left-panel properties pane.
Adjusting the Column Radius
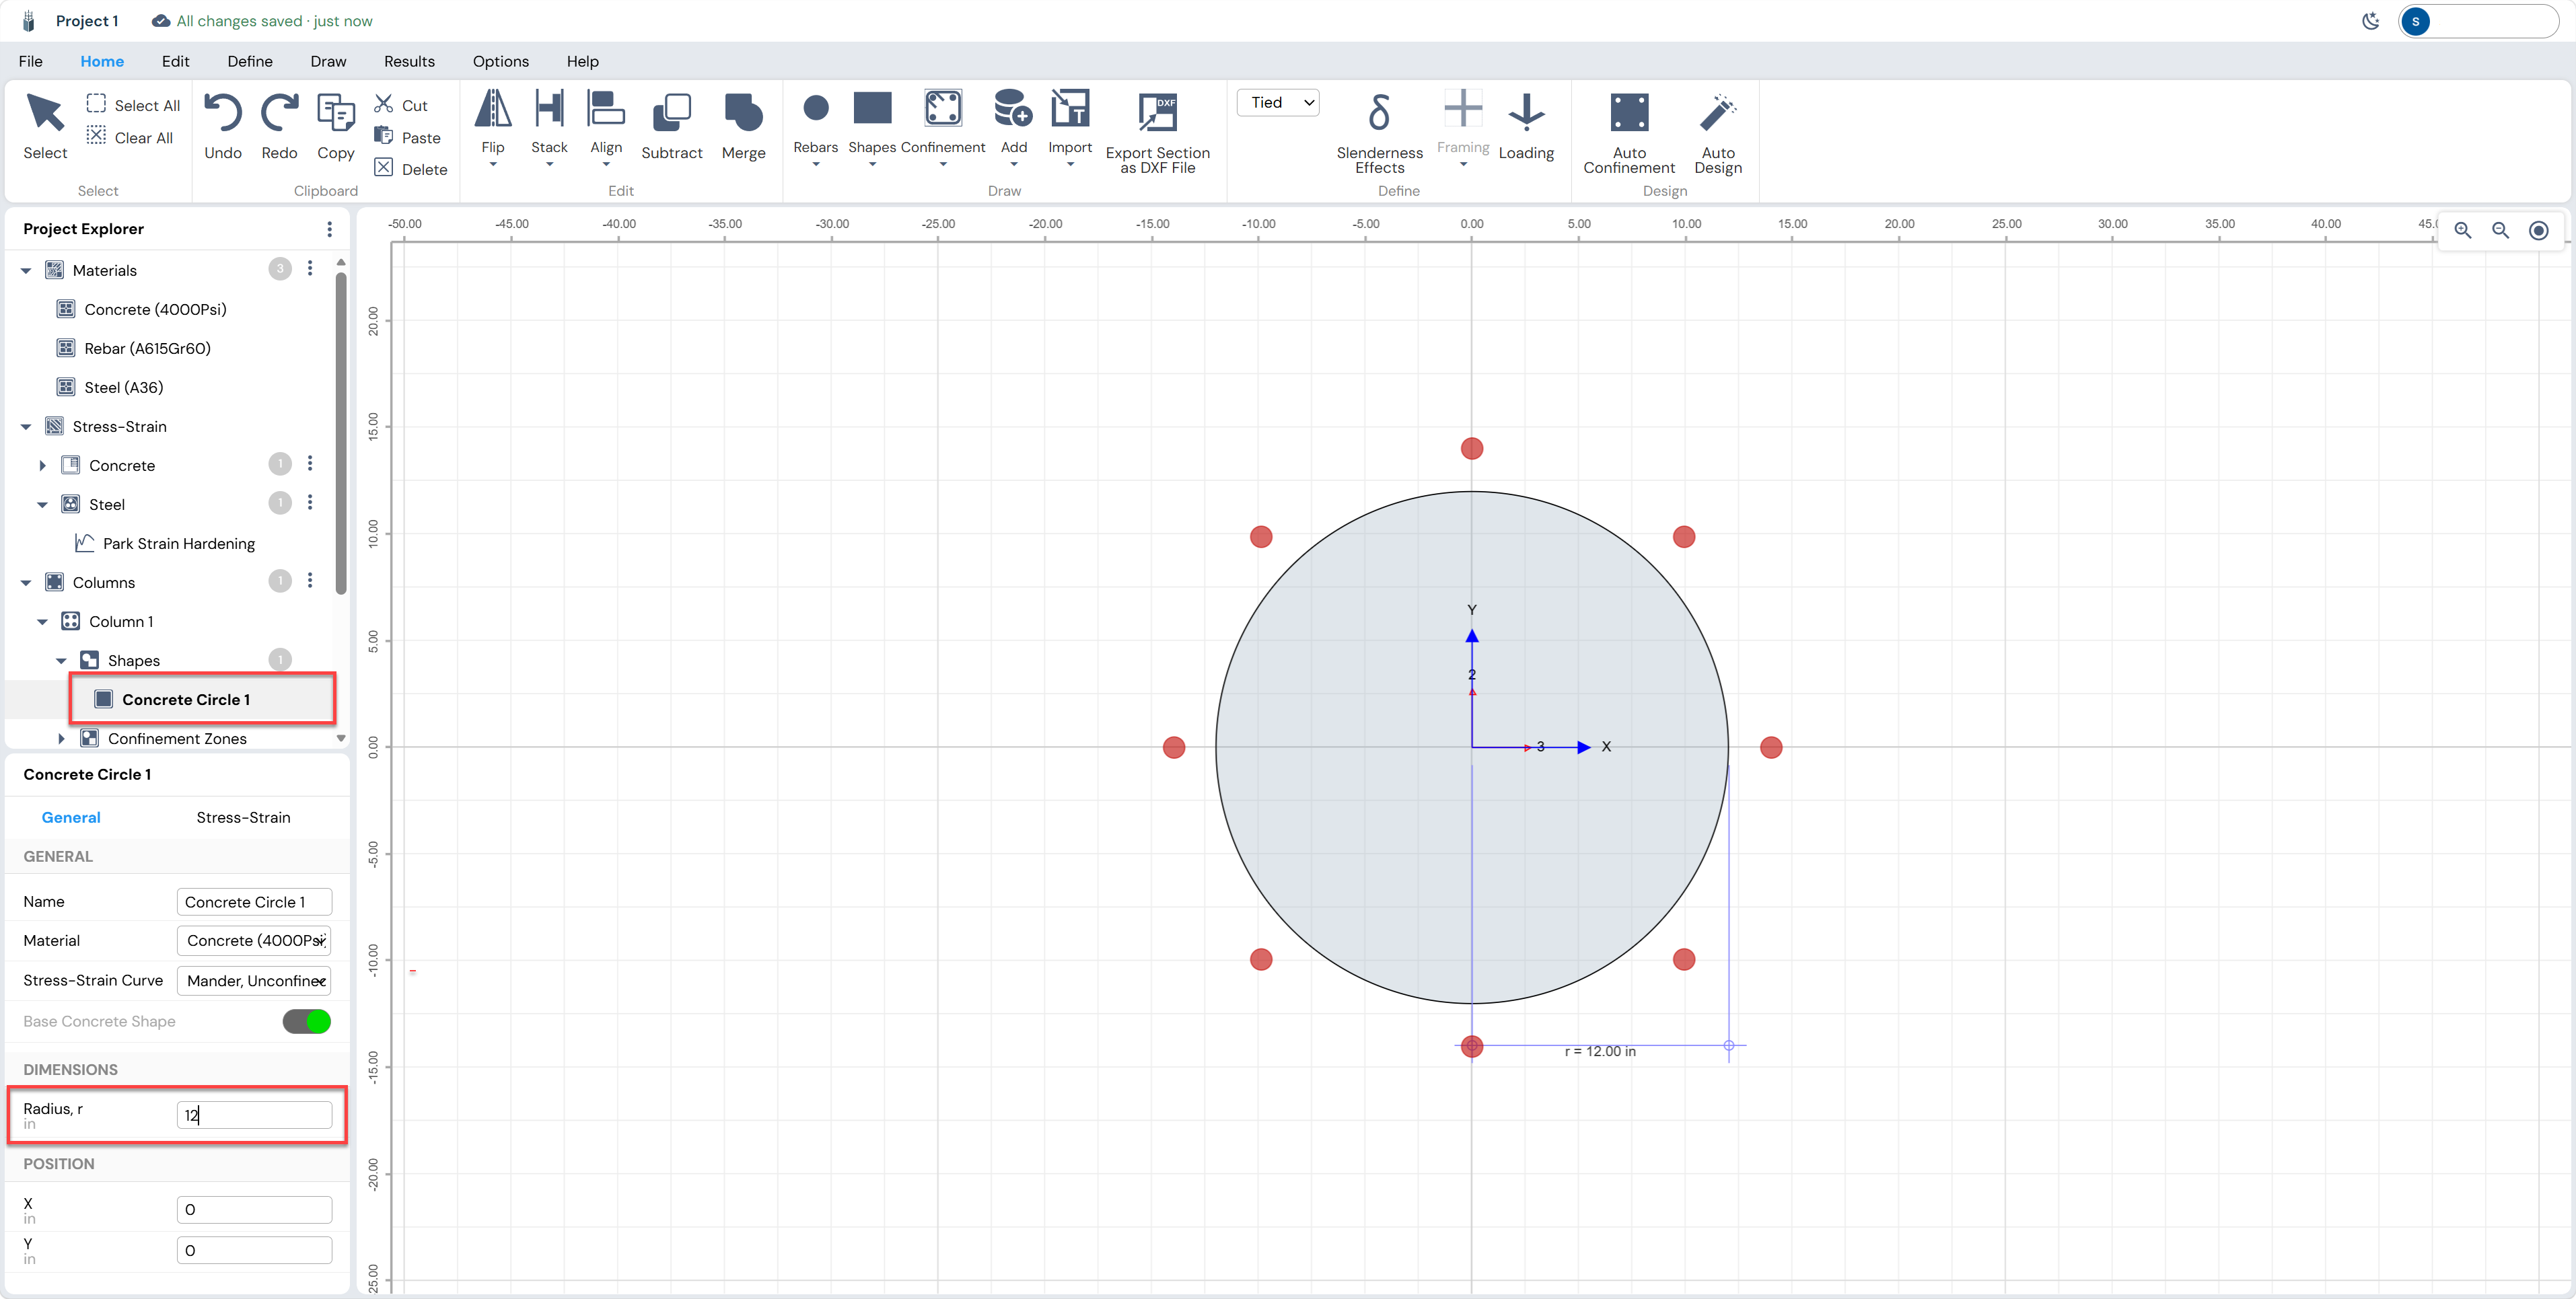
Click the Concrete Circle 1 node. In the lower-left panel under DIMENSIONS, change the Radius r from 16 to the 12 in.
| Parameter | Final Value |
|---|---|
| Radius, r | 12 in |
| Material | Concrete (4500Psi) |
| Stress-Strain Curve | Mander, Unconfined |
| Base Concrete Shape | On (toggle enabled) |
Rebar Circle Layout
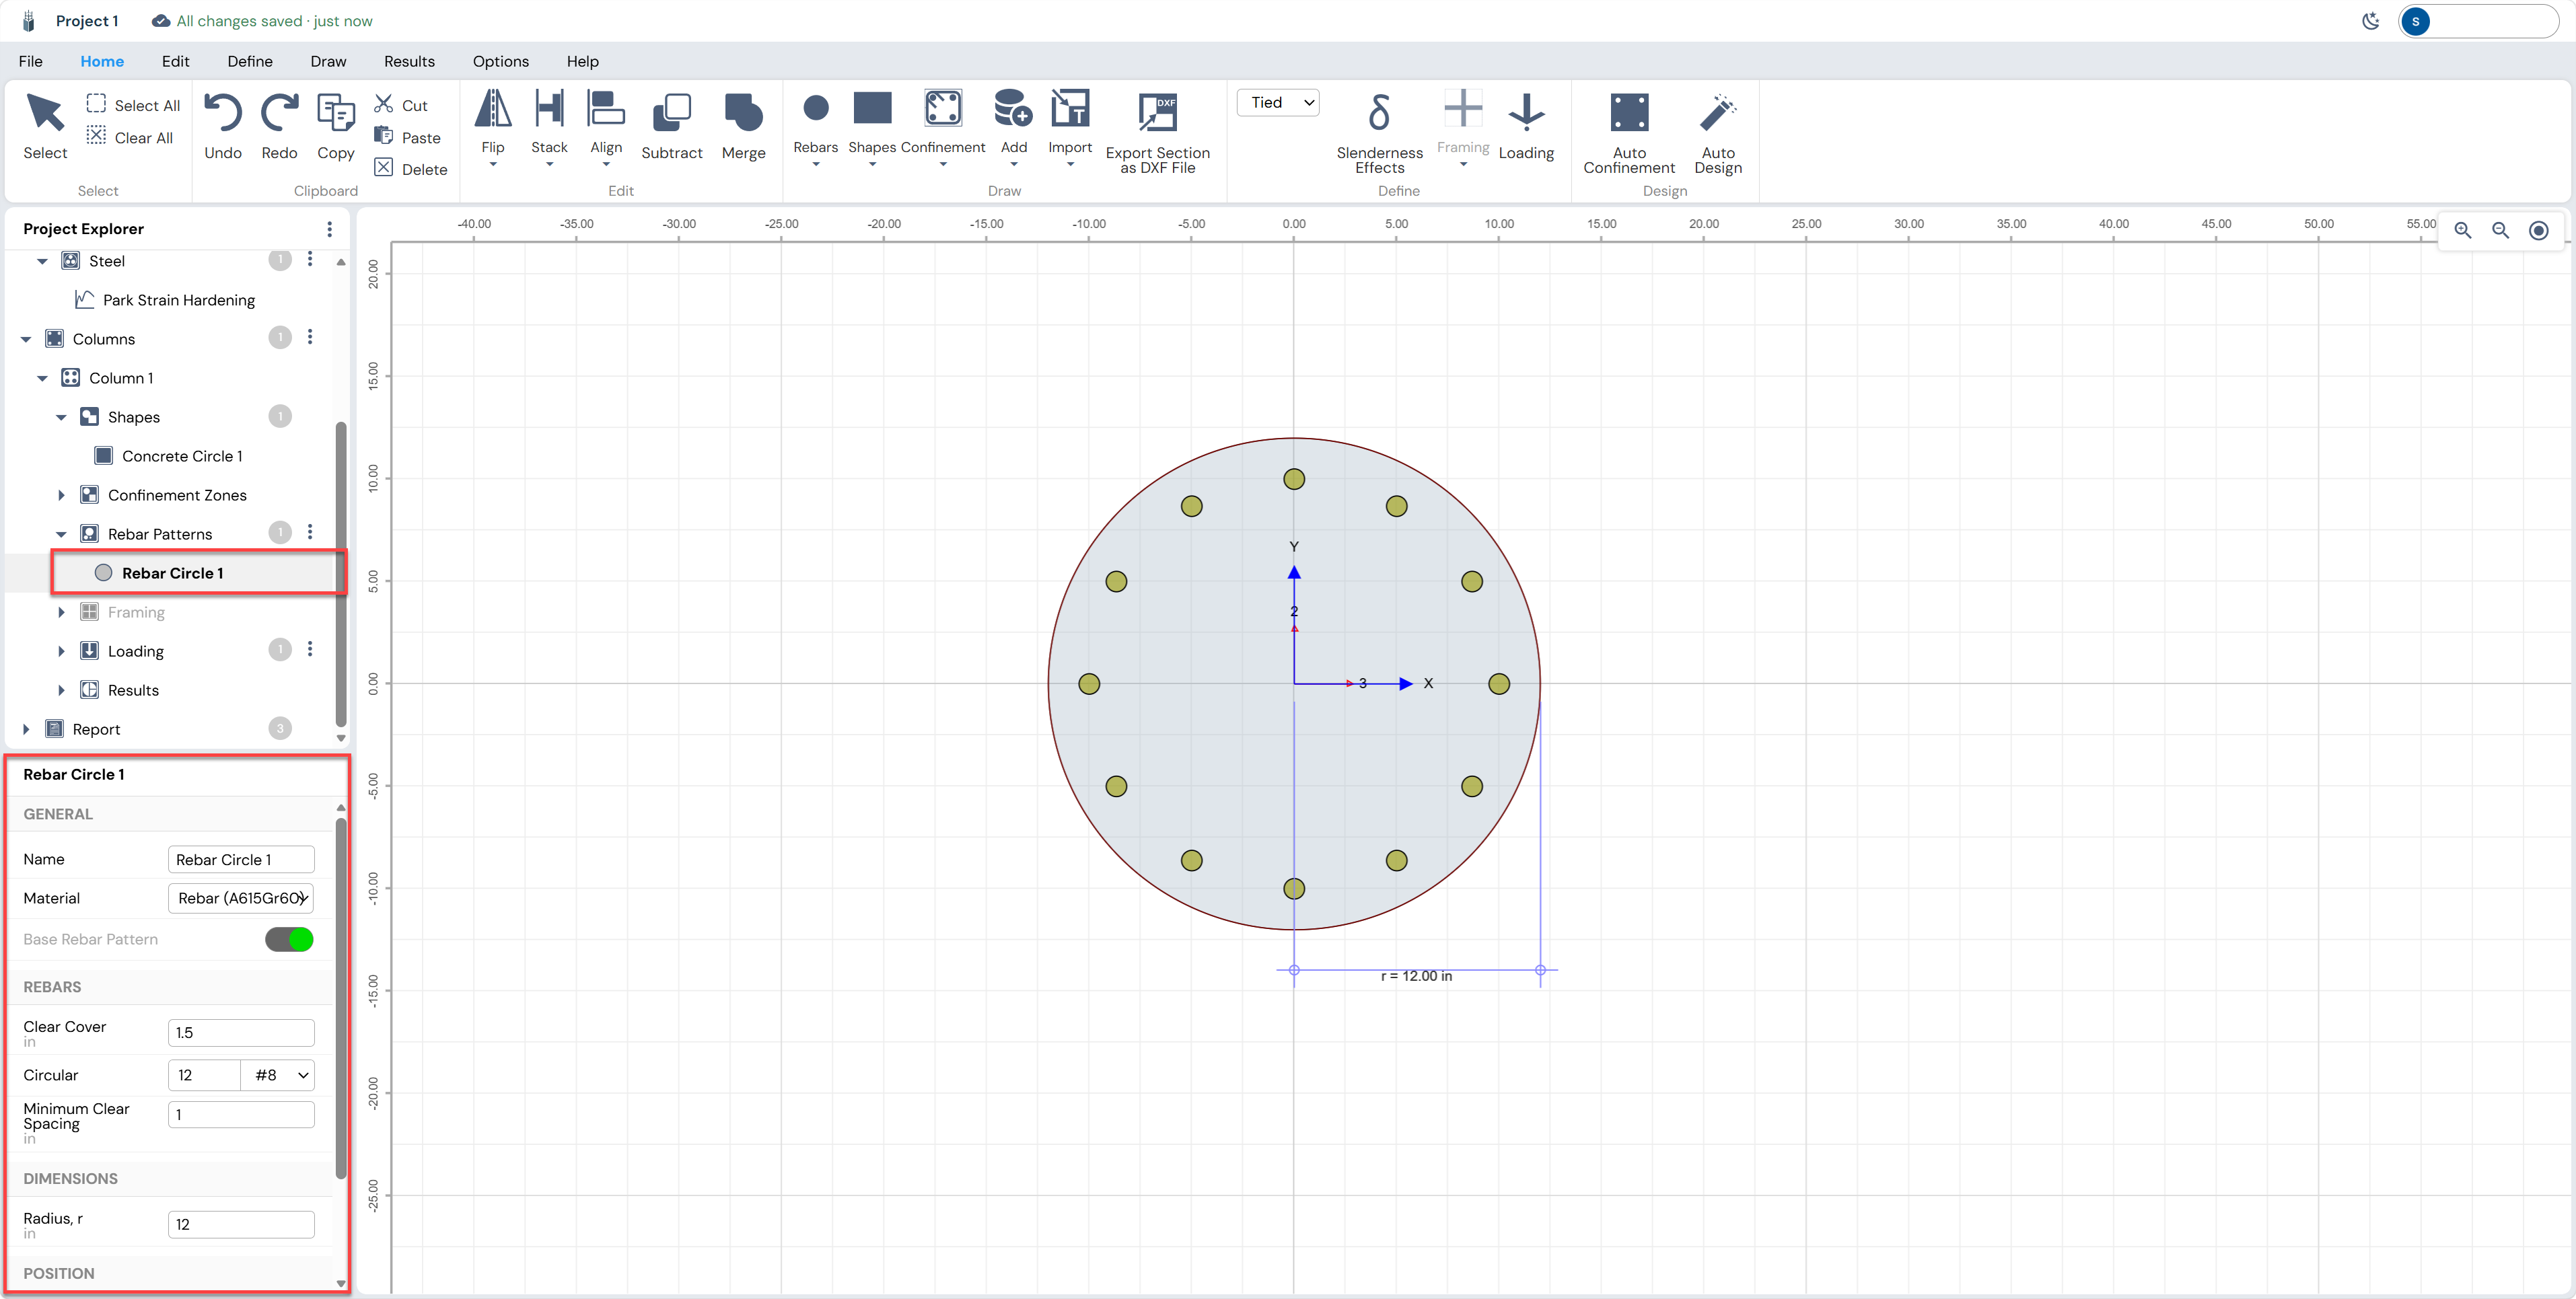
Click the Rebar Circle 1 node under Rebar Patterns. The left panel shows the reinforcement parameters. Set the values shown below:
| Parameter | Value |
|---|---|
| Clear Cover | 1.5 in |
| Circular (count) | 12 |
| Bar Size | #8 |
| Minimum Clear Spacing | 1 in |
| Radius, r | 12 in |
Defining Confinement
For circular columns with transverse reinforcement, Column Designer can model the enhanced confined concrete behavior using the Mander Confined stress-strain model. This requires defining a Confinement Zone that covers the core concrete bounded by the spiral.
Confinement Circle Geometry
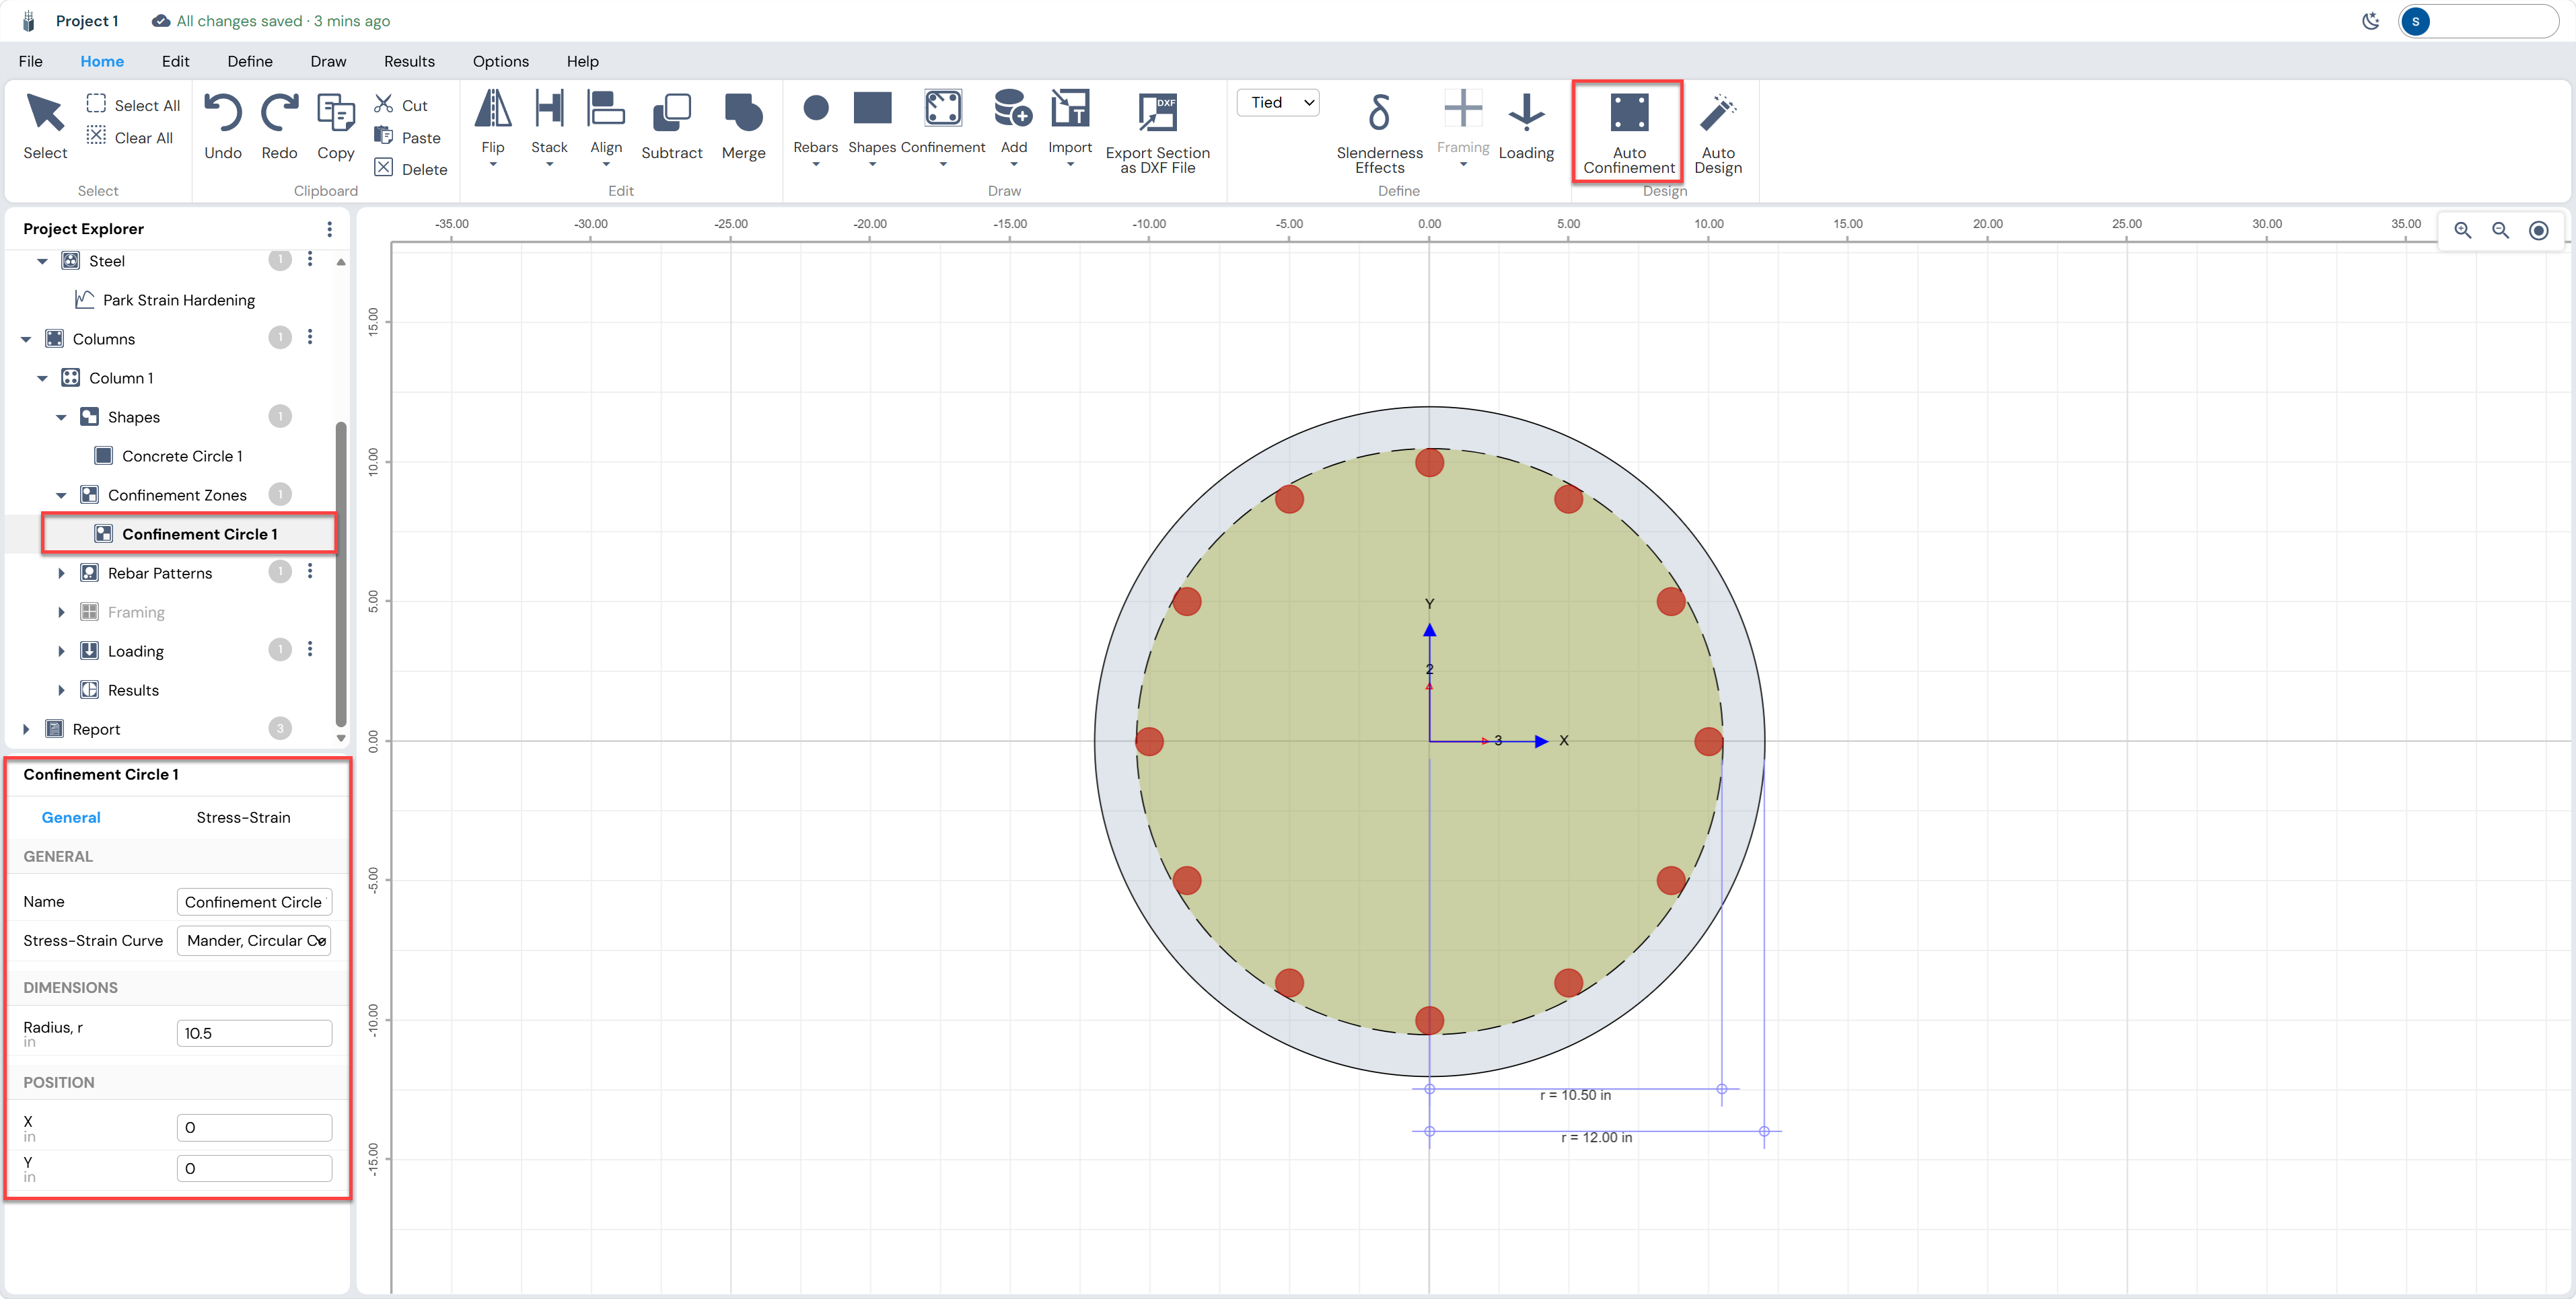
Use the Auto Confinement option to define the confined region in the circular column. Click on the confined concrete region to open its properties tab in the Project explorer. The radius of the confined region can be changed, and the position of the confined region can be adjusted here.
Confinement Bar Properties (Stress-Strain tab)
Click the Stress-Strain tab on the Confinement Circle 1 panel. Enter the spiral/tie properties that govern the Mander Circular Confined curve computation:
| Property | Value |
|---|---|
| Confinement Type | Tied |
| Bar Spacing | 3 in |
| Bar Diameter | 0.315 in |
| Total Main Steel | 10 in2 |
| Compressive Strength (f’c) | 4,500 psi |
| Bar Strength | 40,000 psi |
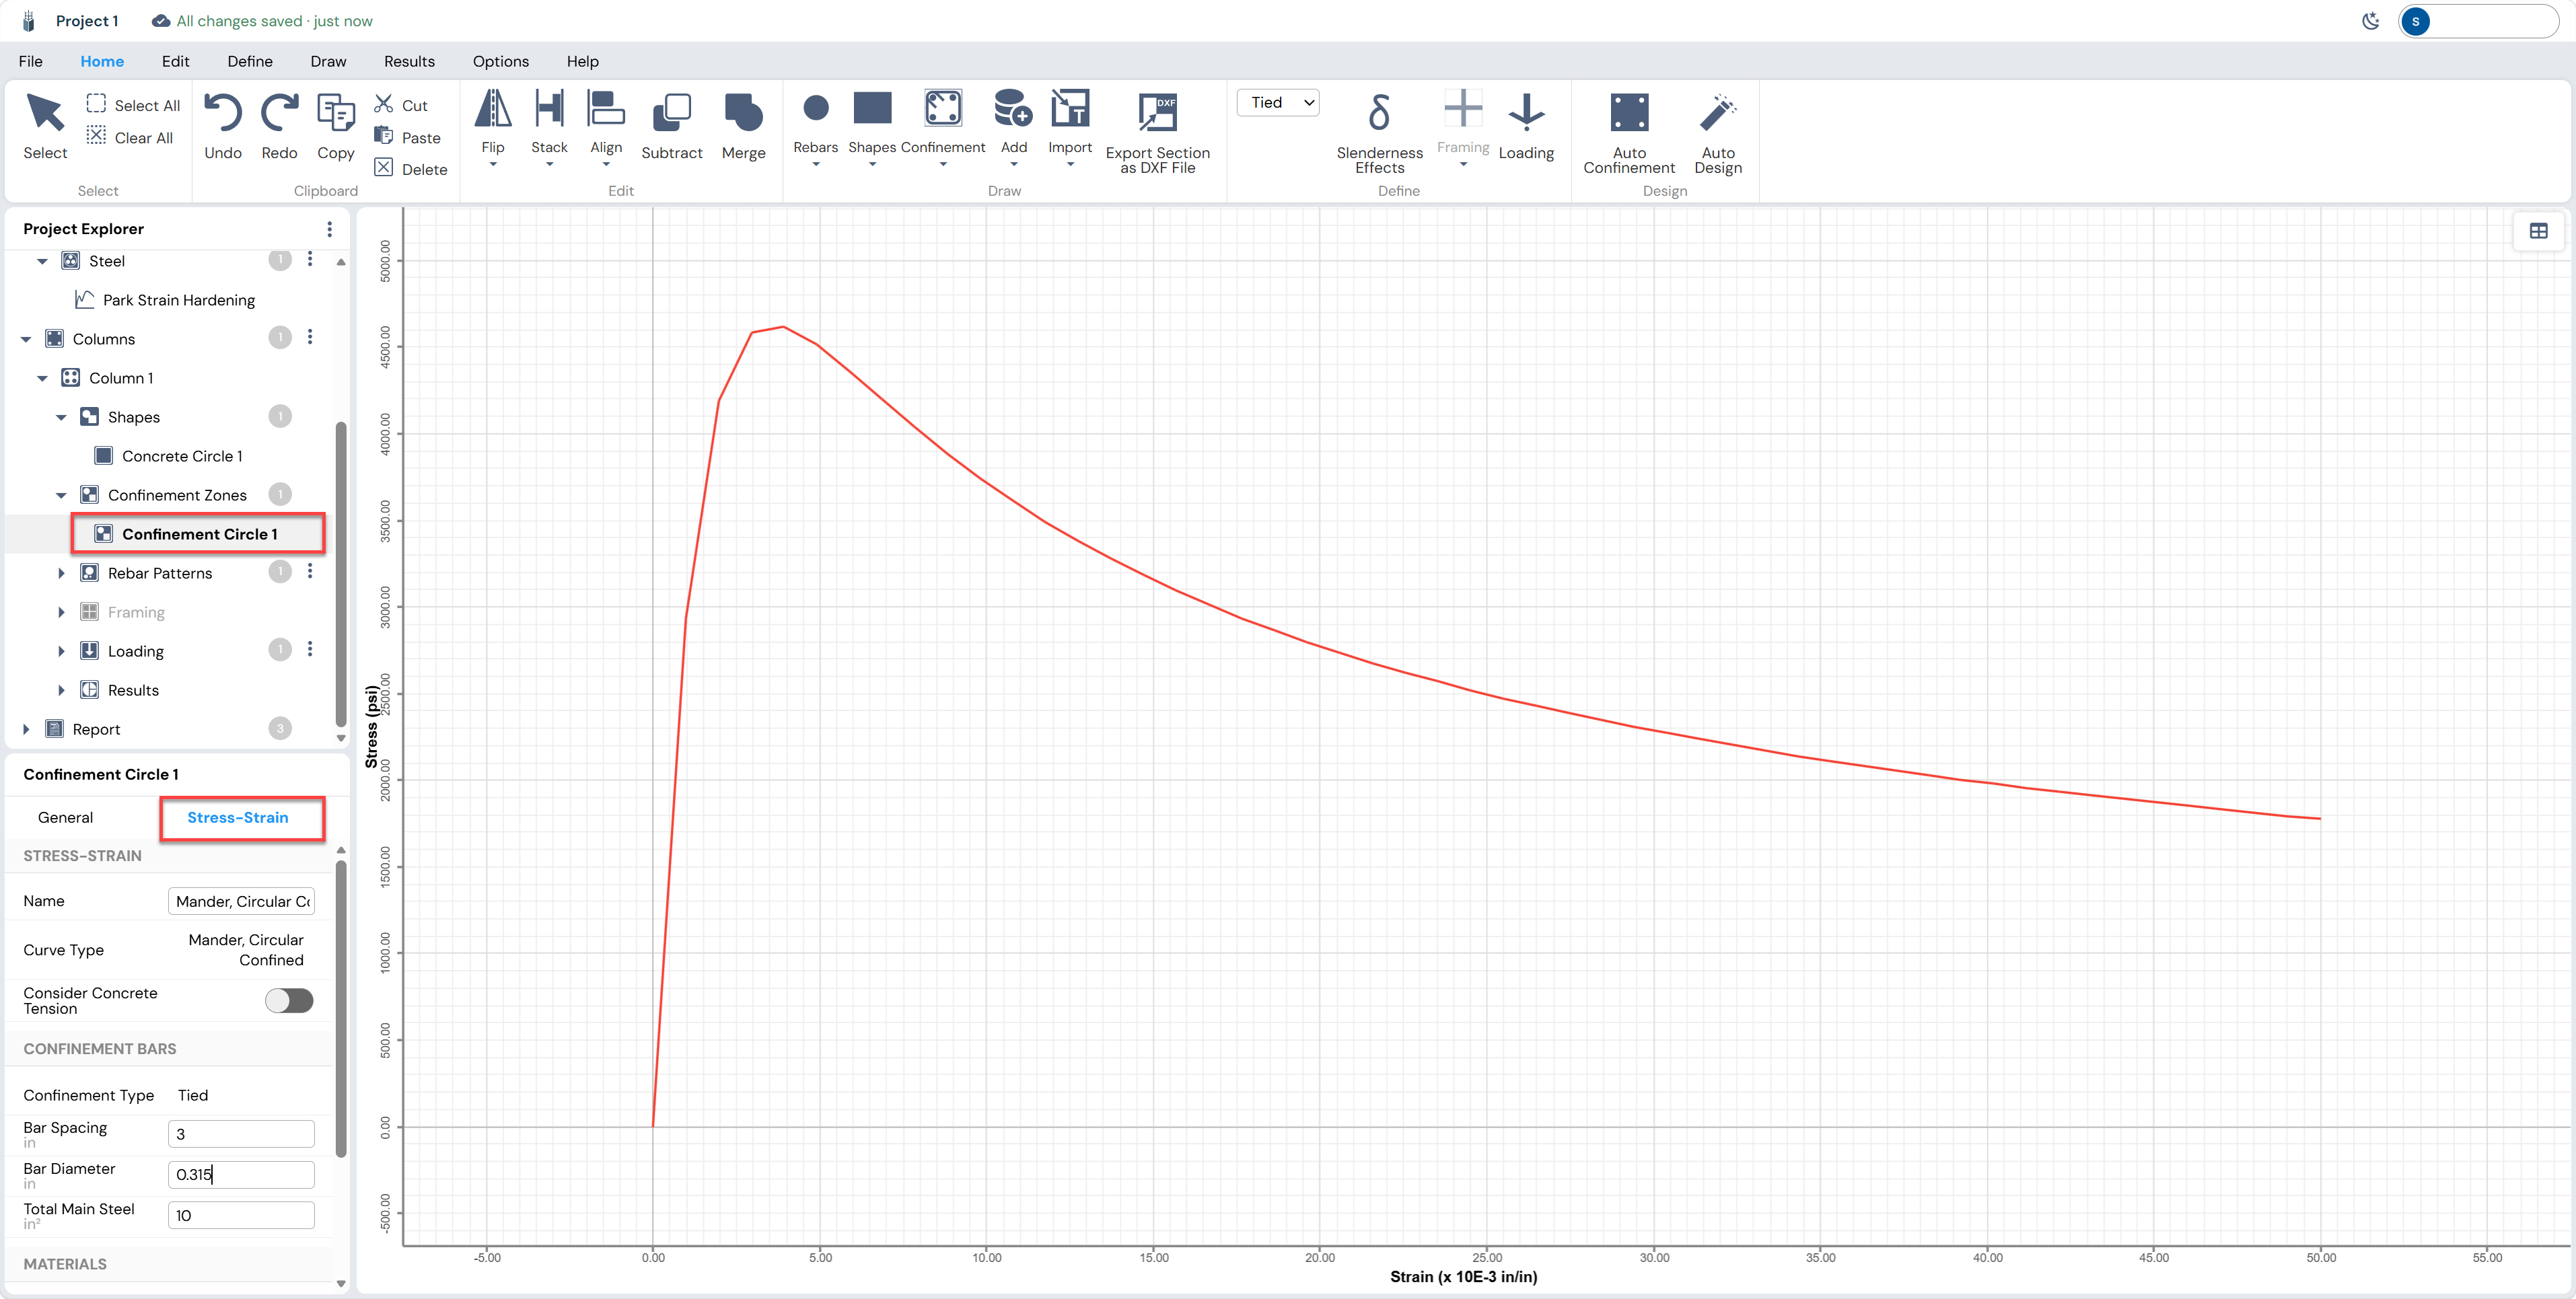
Column Designer automatically recomputes the Mander Confined curve whenever spiral parameters change.
Slenderness Effects and Framing Conditions
Column Designer evaluates slenderness effects per ACI 318-19 Section 6.2 using the moment-magnification method. To activate slenderness, the column framing conditions (boundary conditions at top and bottom) and clear height must be defined through the Define ribbon.
Activating Slenderness
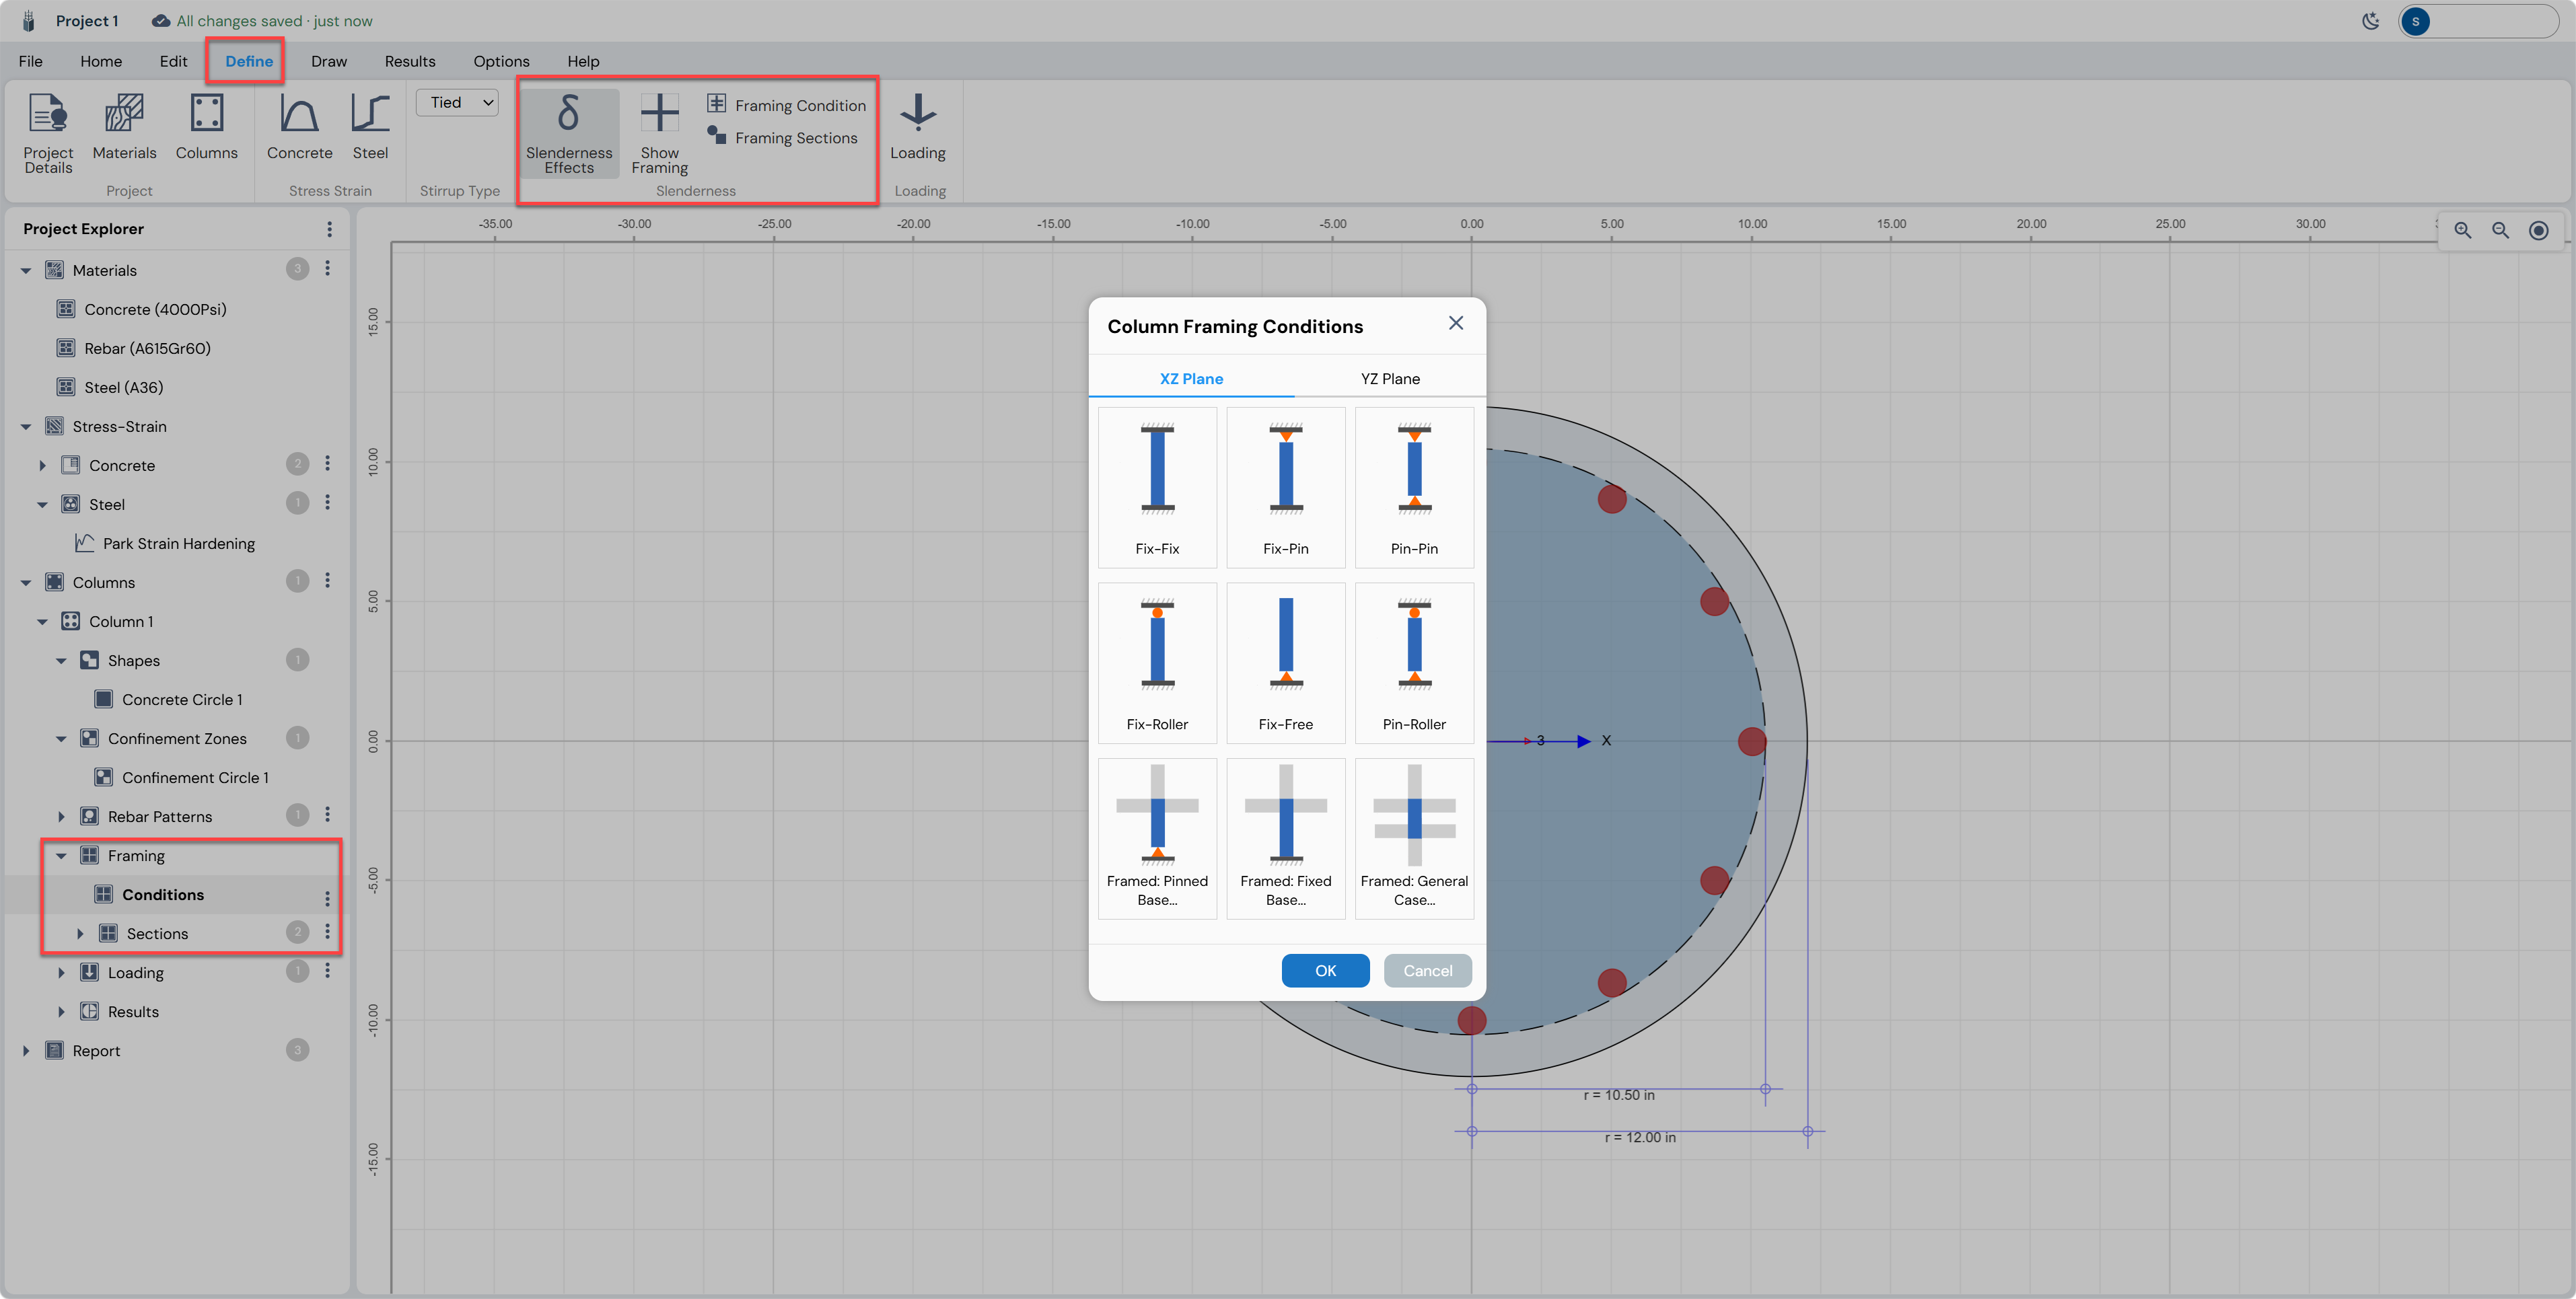
In the Define ribbon, click Slenderness Effects to open the slenderness configuration workflow. This activates the Framing node in the Project Explorer and switches the canvas to the Framing view.
Column Framing Conditions
Click Framing Condition in the Define ribbon (or double-click the Conditions node). The Column Framing Conditions dialog opens with two tabs — XZ Plane and YZ Plane — each offering nine standard end-condition combinations. For this tutorial, select Fix-Fix in both the XZ Plane and YZ Plane tabs (representing a column fully fixed at top and bottom). Click OK.
Column Length and Unsupported Length
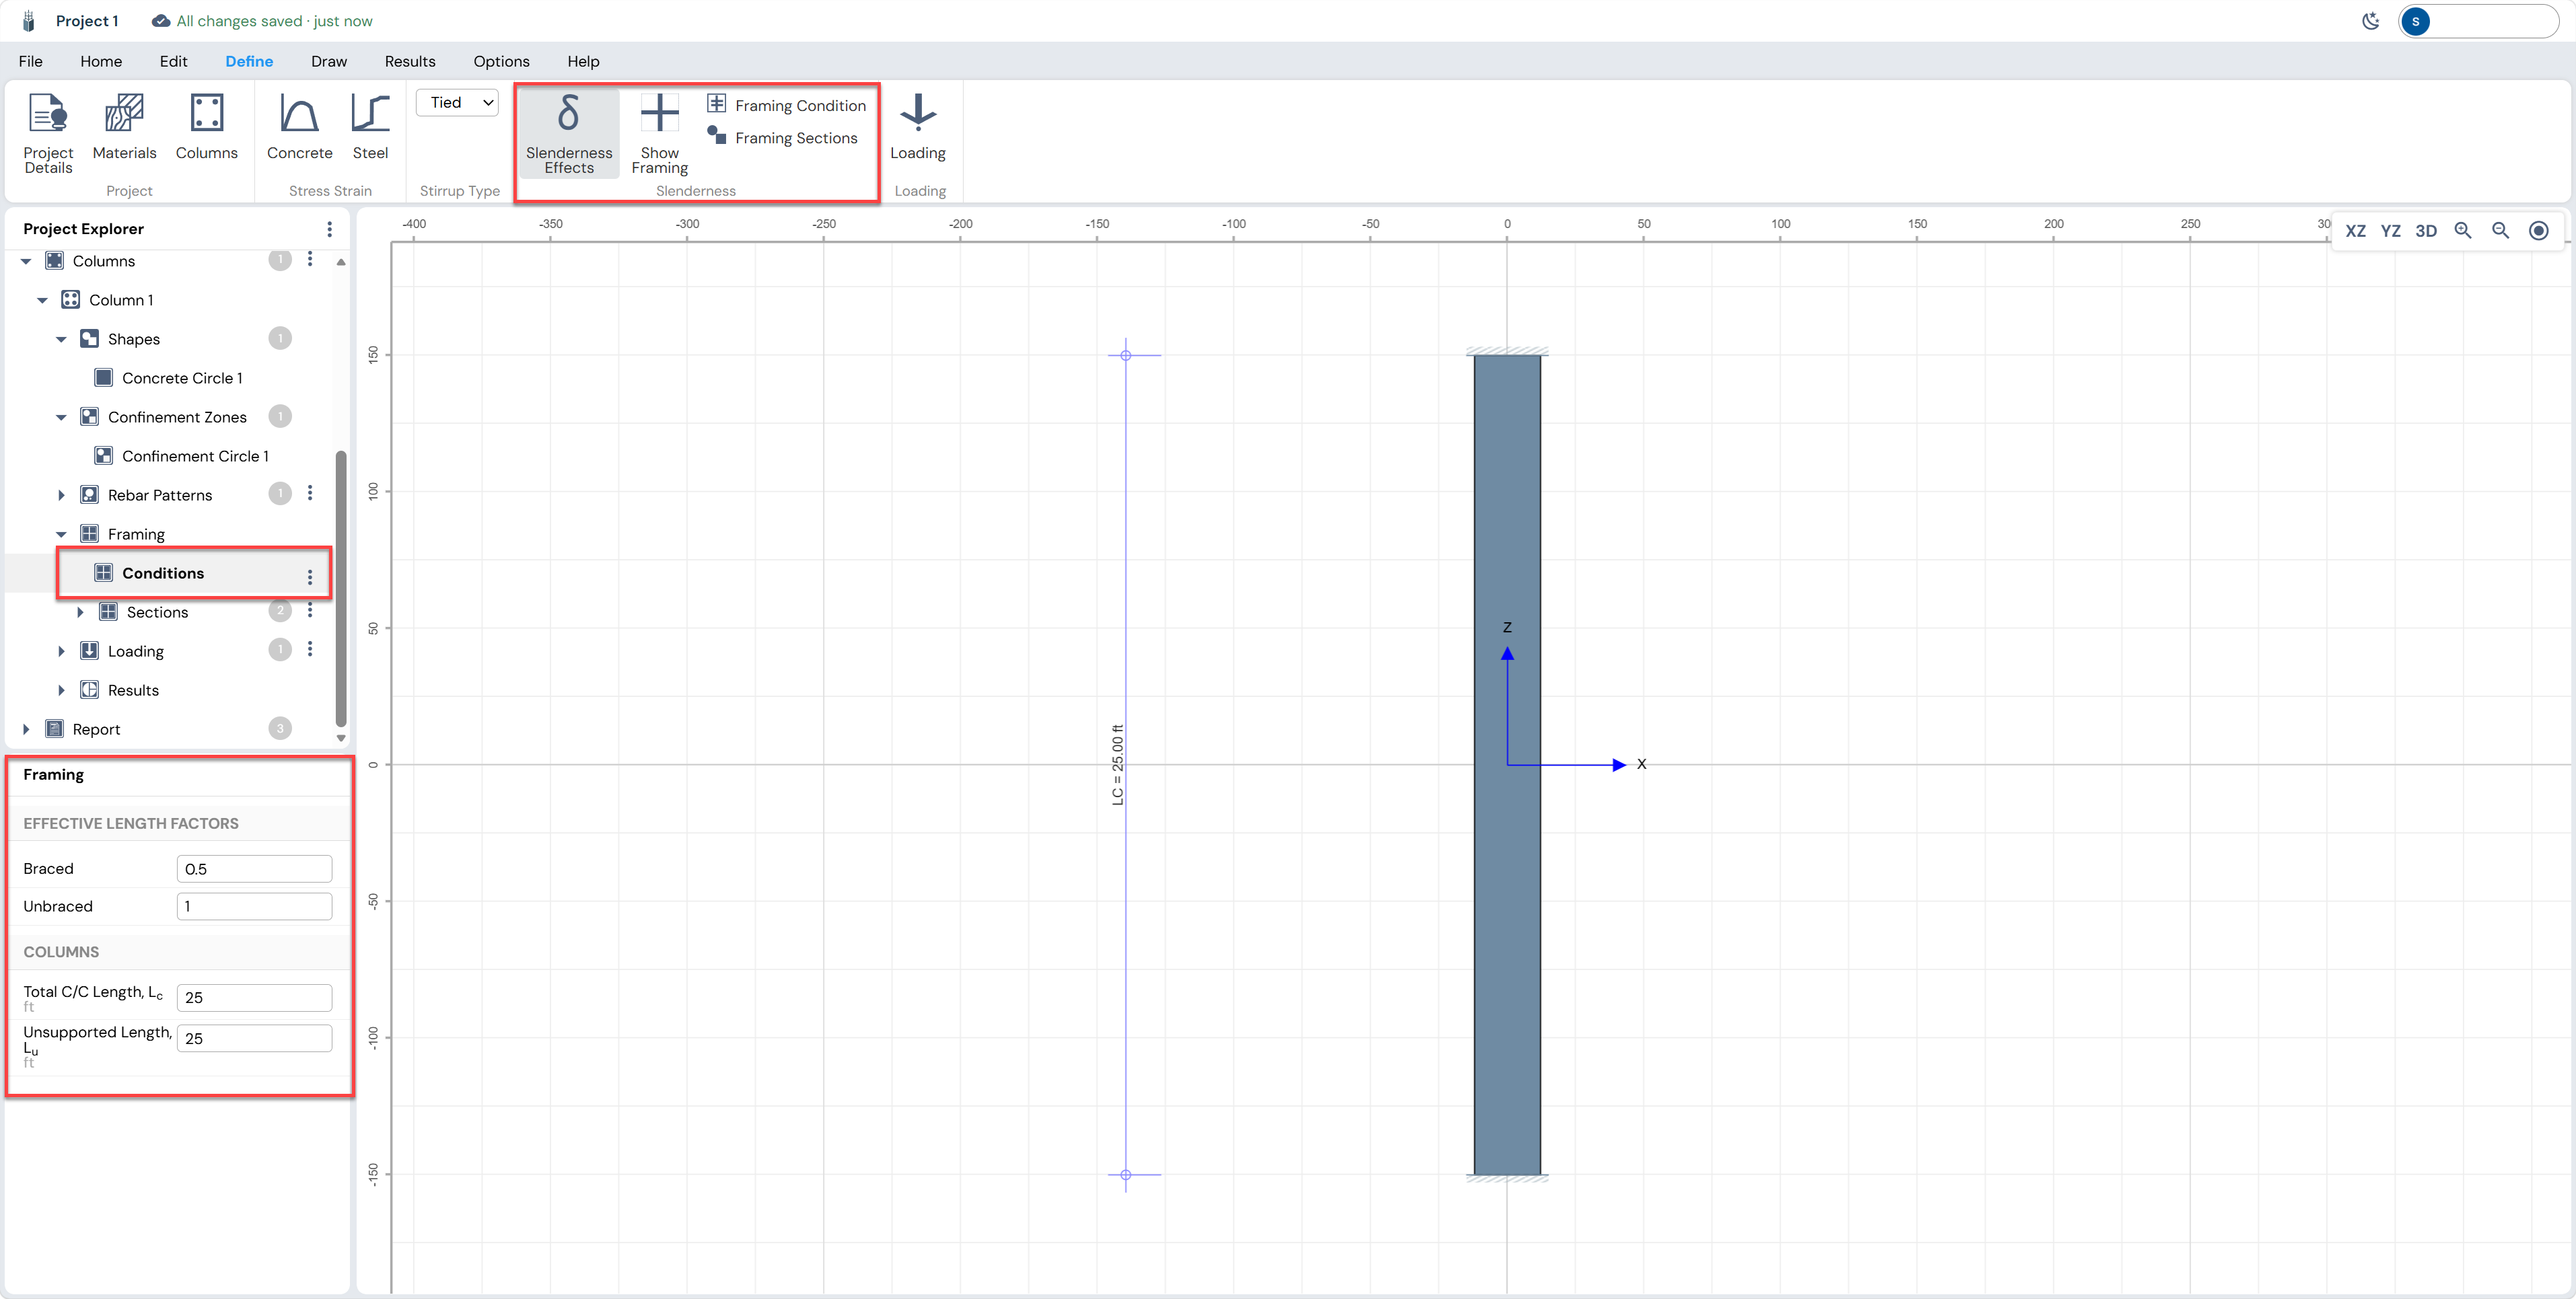
In the Framing panel (left side panel or under the Framing node), set the column height parameters:
| Parameter | Value |
|---|---|
| Total C/C Length, Lc | 25 ft |
| Unsupported Length, Lu | 25 ft |
| Effective Length Factor — Braced | 0.5 |
| Effective Length Factor — Unbraced | 1.0 |
Defining Loading with Slenderness
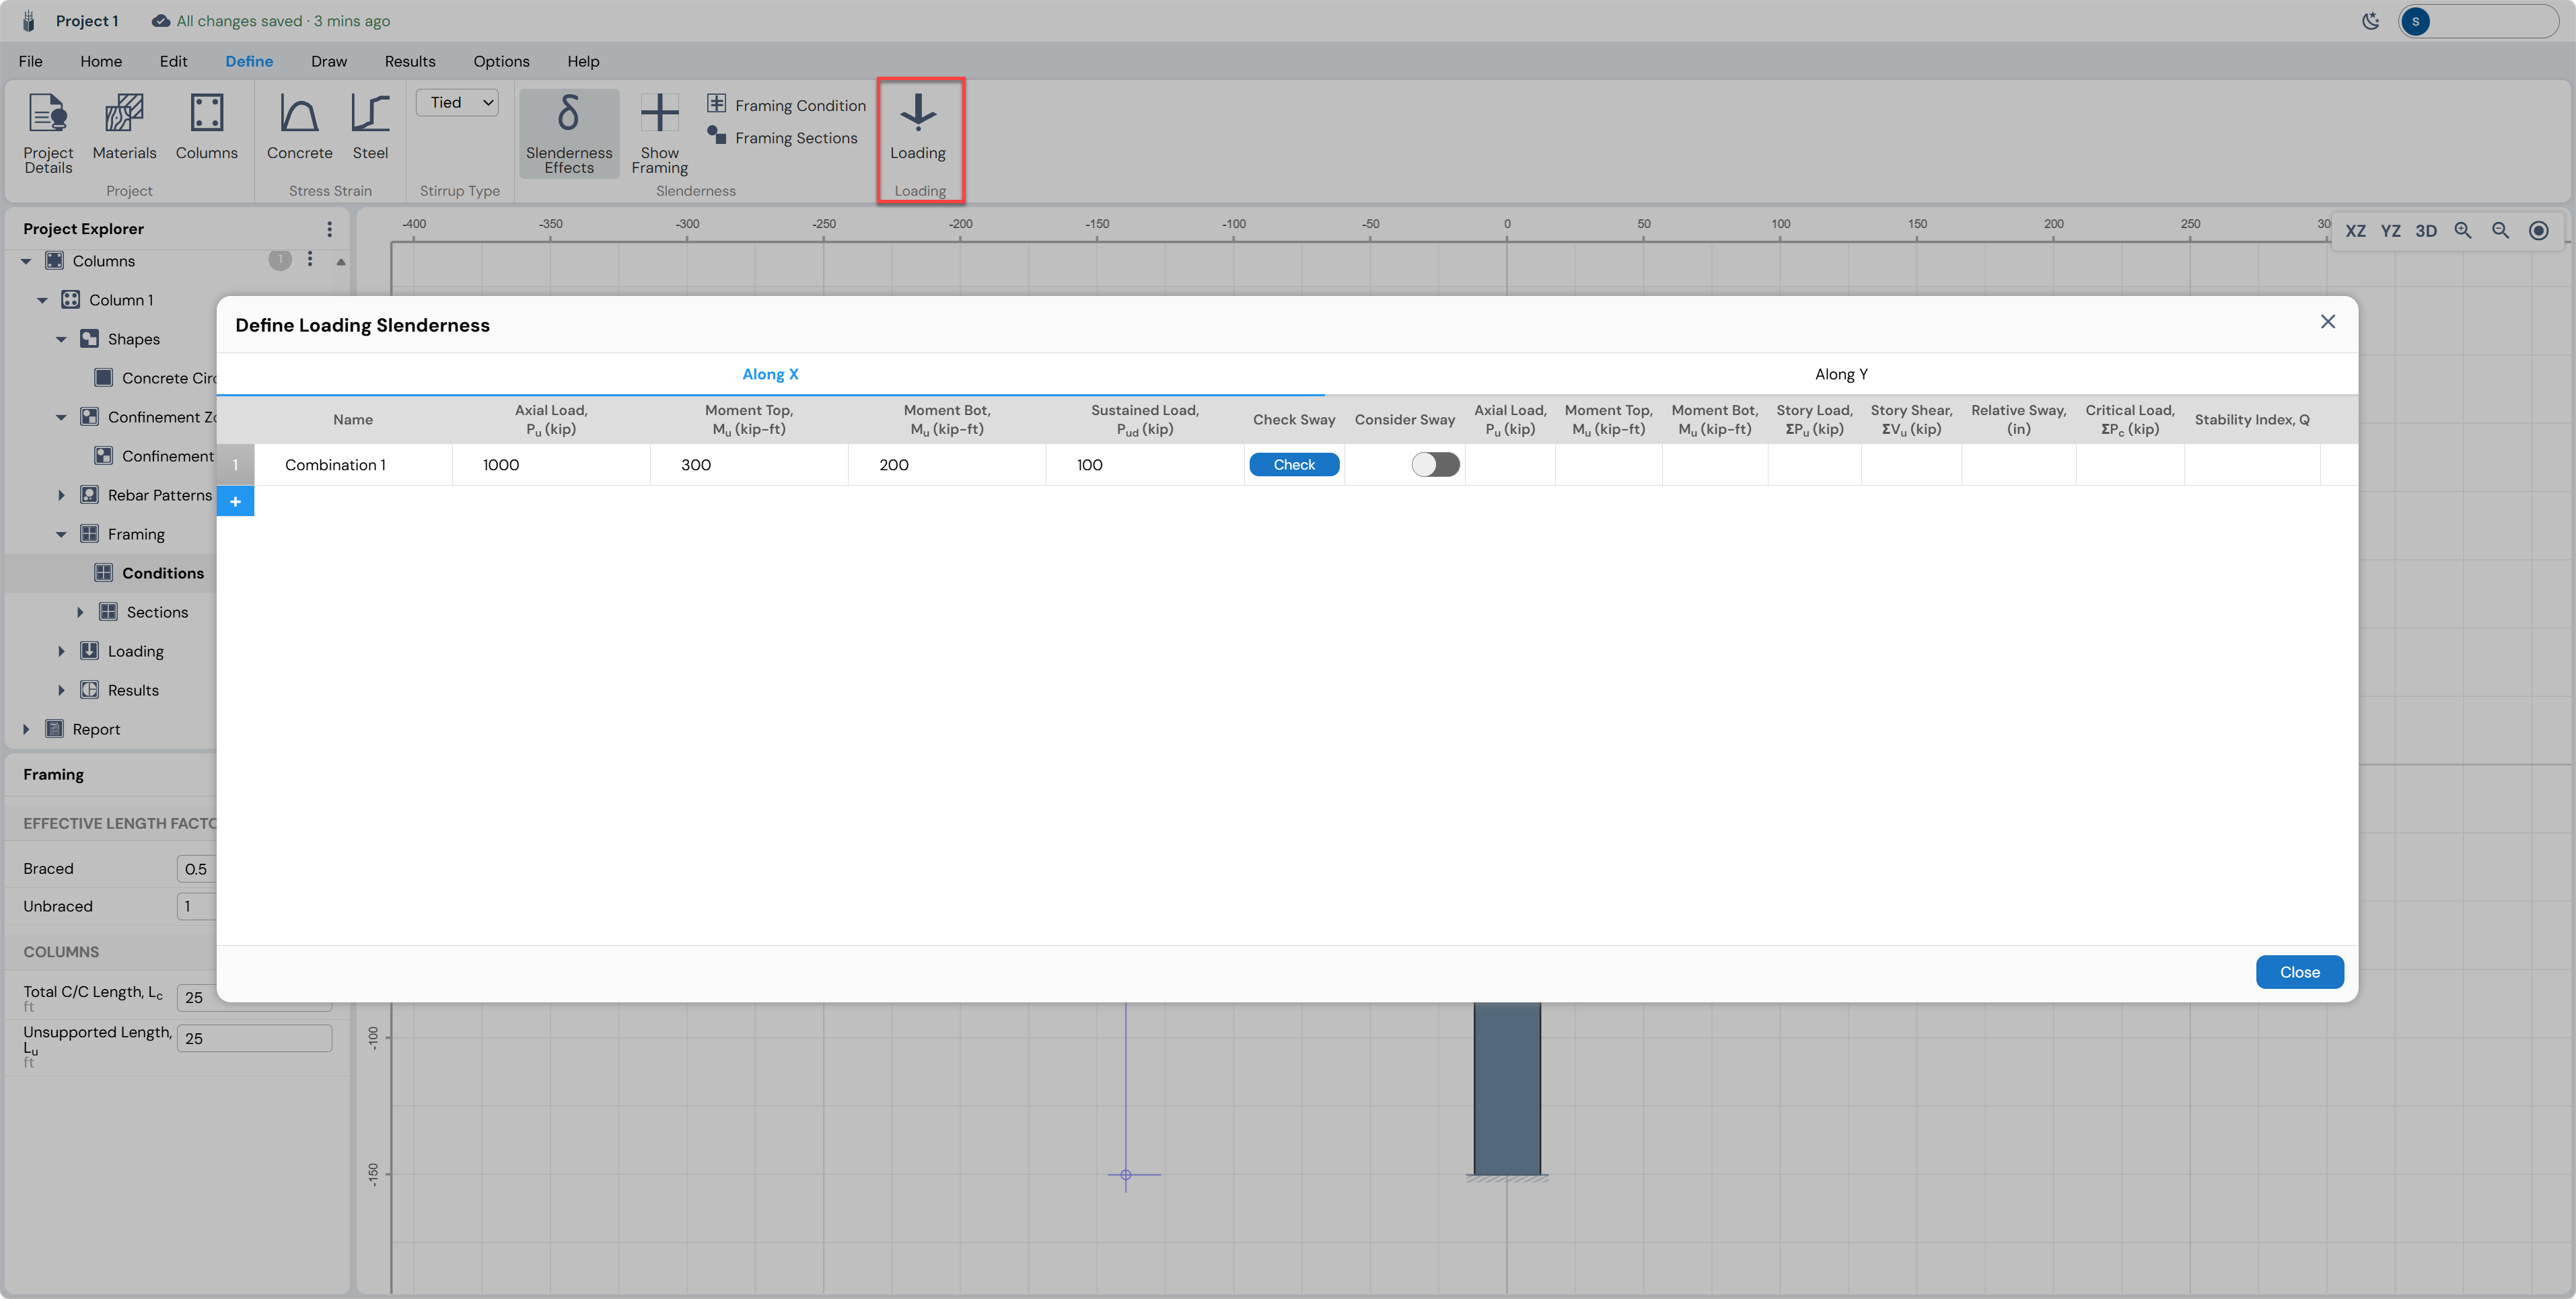
Click Loading in the Define ribbon to open the Define Loading Slenderness dialog. This differs from the basic loading dialog: it includes additional columns for sustained load (Psus) and sway-check parameters required for the ACI 318-19 moment-magnification procedure.
Load Combination Input (Along X tab)
| Column | Symbol | Value | Description |
|---|---|---|---|
| Name | — | Combination 1 | User label for this load case |
| Axial Load | Pu | 1,000 kip | Factored compressive axial force |
| Moment Top | Mx-Top | 300 kip-ft | Factored moment at top — X-axis bending |
| Moment Bottom | Mx-Bot | 200 kip-ft | Factored moment at bottom — X-axis bending |
| Sustained Load | Psus | 100 kip | Long-term (creep) axial load component |
The Along Y tab accepts the same parameters for Y-axis bending. For a biaxial check, enter moments on both tabs.
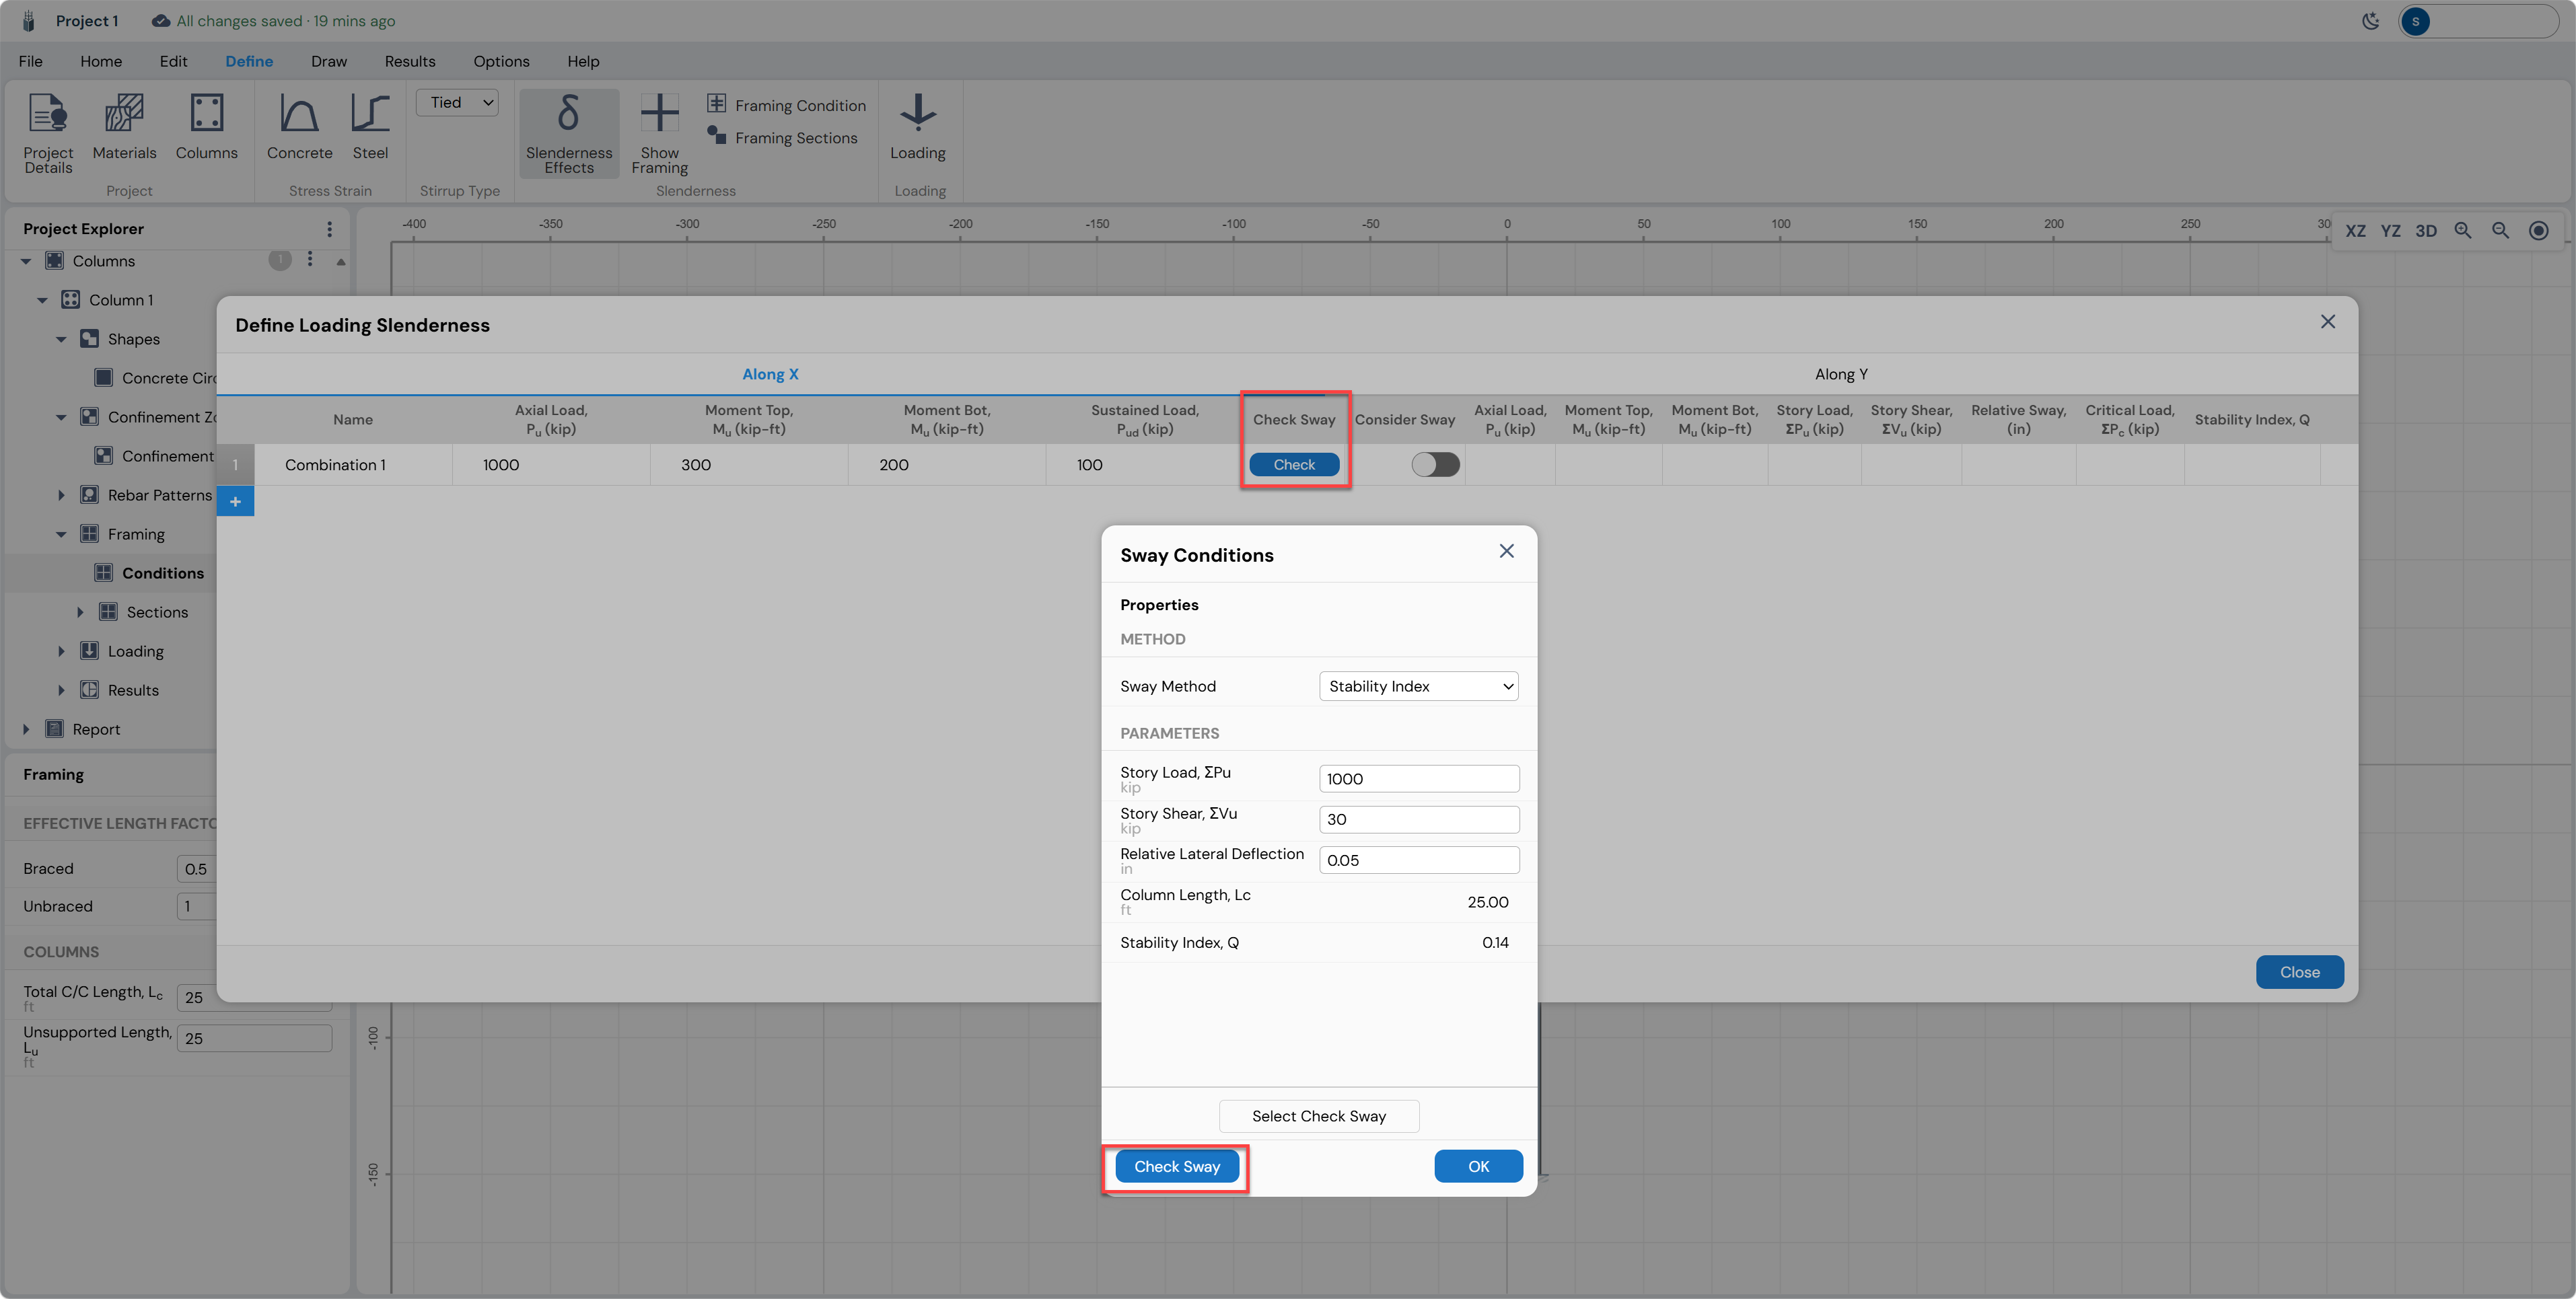
Sway Condition Check
Click the Check Sway button on the loading row to open the Sway Conditions dialog. This tool evaluates whether the story is sway-dominated or braced per ACI 318-19 using the Stability Index Q method.
Auto Design — Automated Rebar Optimization
The Auto Design feature in Column Designer searches for the minimum rebar layout that satisfies specified D/C and rebar ratio constraints. It iterates over bar counts and sizes to find the most economical reinforcement configuration. Access it from the Home ribbon (Auto Design button) or via the Design ribbon.
Auto Design Dialog
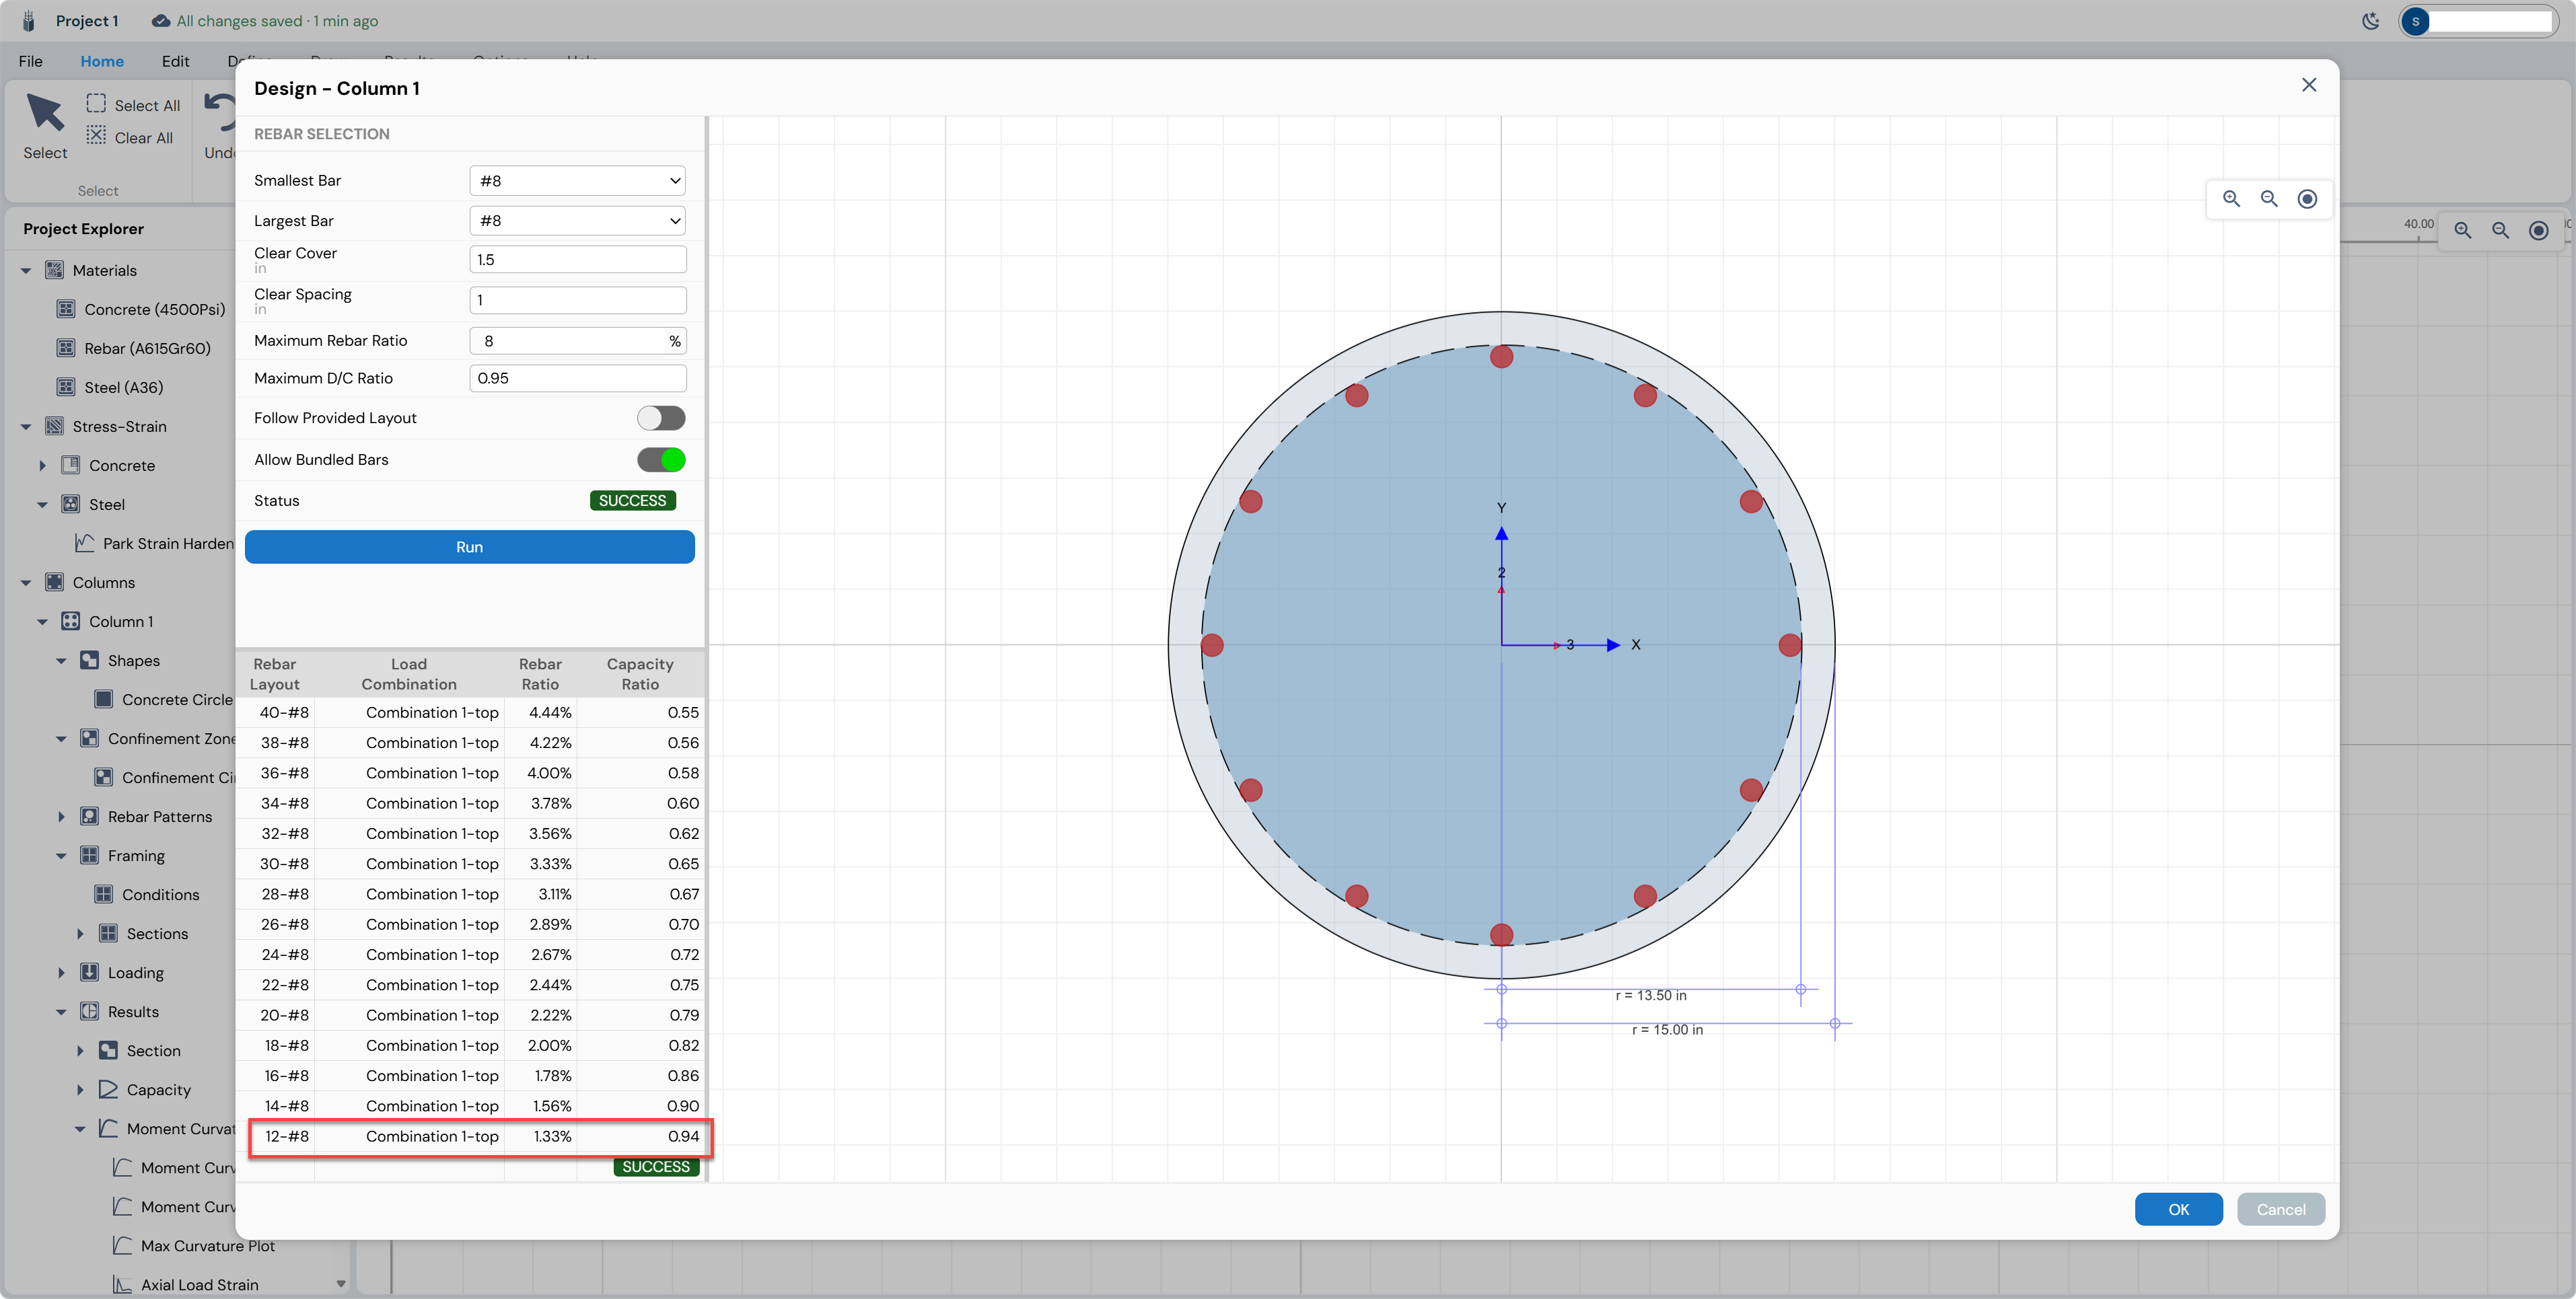
Click Auto Design in the ribbon. The Design — Column 1 dialog opens alongside the cross-section preview.
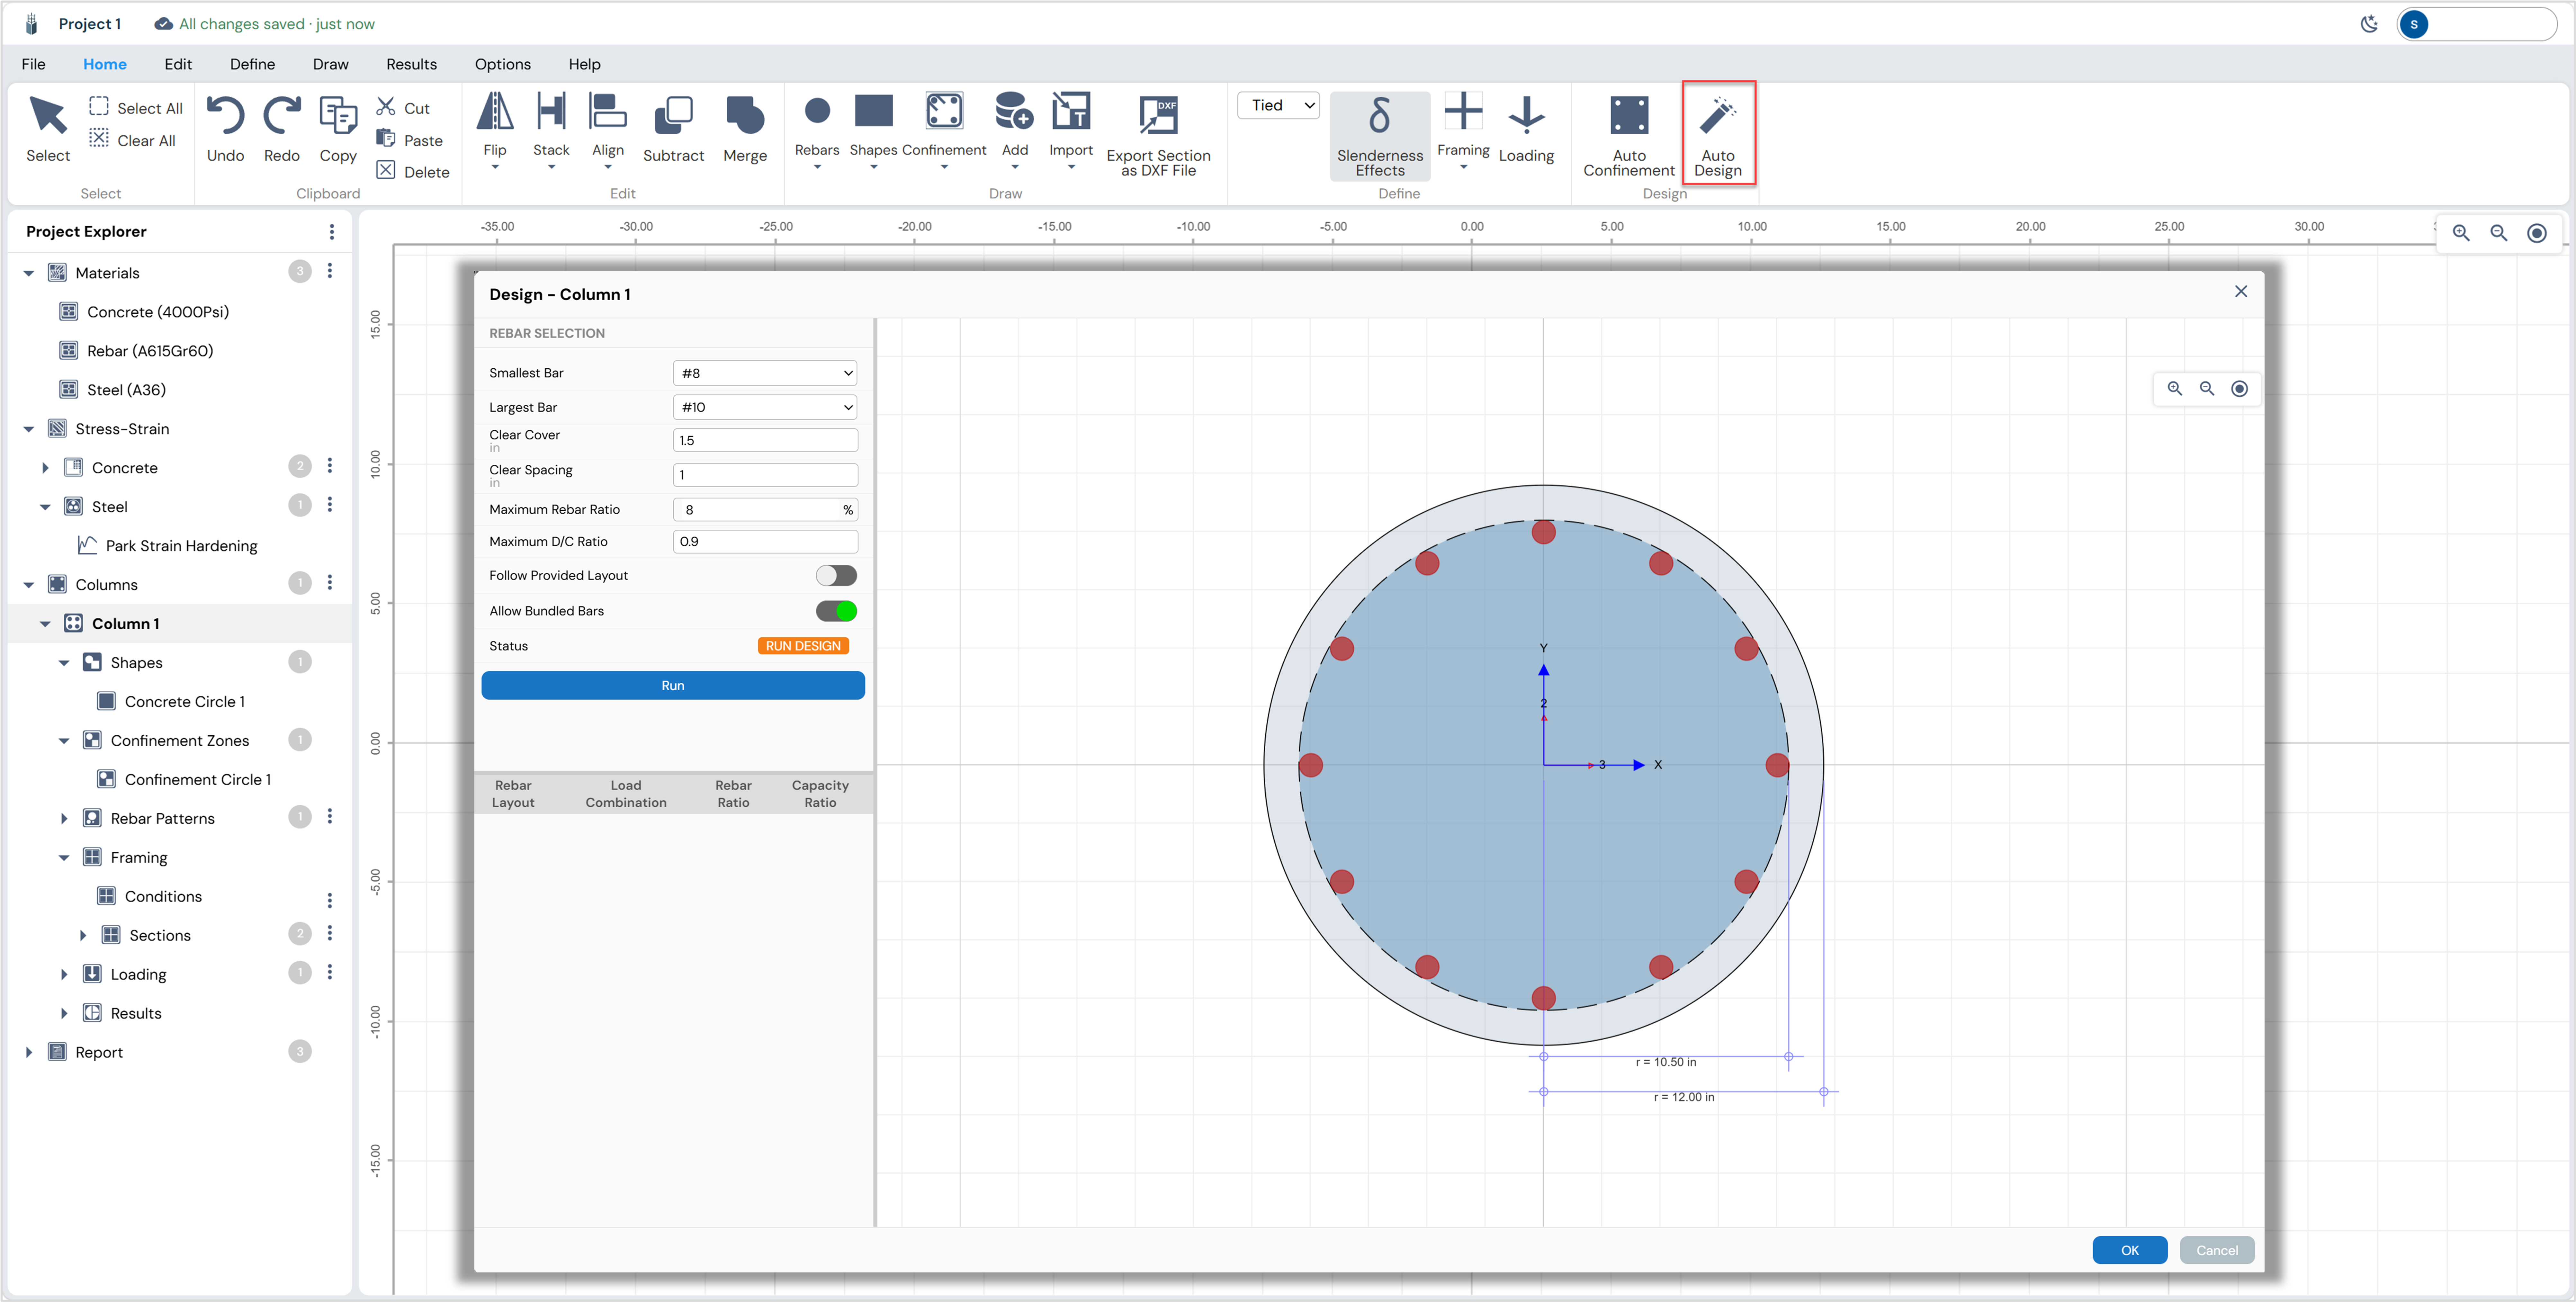
| Parameter | Value | Description |
|---|---|---|
| Smallest Bar | #8 | Minimum bar size to try in the design sweep |
| Largest Bar | #8 | Maximum bar size; set to #8 to fix the bar size |
| Clear Cover | 1.5 in | Clear cover to longitudinal bars |
| Clear Spacing | 1 in | Minimum clear spacing between bars (ACI minimum) |
| Maximum Rebar Ratio | 8% | Upper bound on ρ = As/Ag (ACI max = 8%) |
| Maximum D/C Ratio | 0.90 → 0.95 | Target D/C ceiling; results exceeding this are excluded |
| Follow Provided Layout | Off | If on, uses the current manual bar layout as the seed |
| Allow Bundled Bars | On | Permits bar bundles to satisfy spacing constraints |
Running the Design
Click Run. Eagle Eye evaluates all feasible rebar combinations (varying circular bar count from minimum to maximum at both the Smallest and Largest bar sizes) and populates the results table with every valid layout in order of increasing rebar ratio.
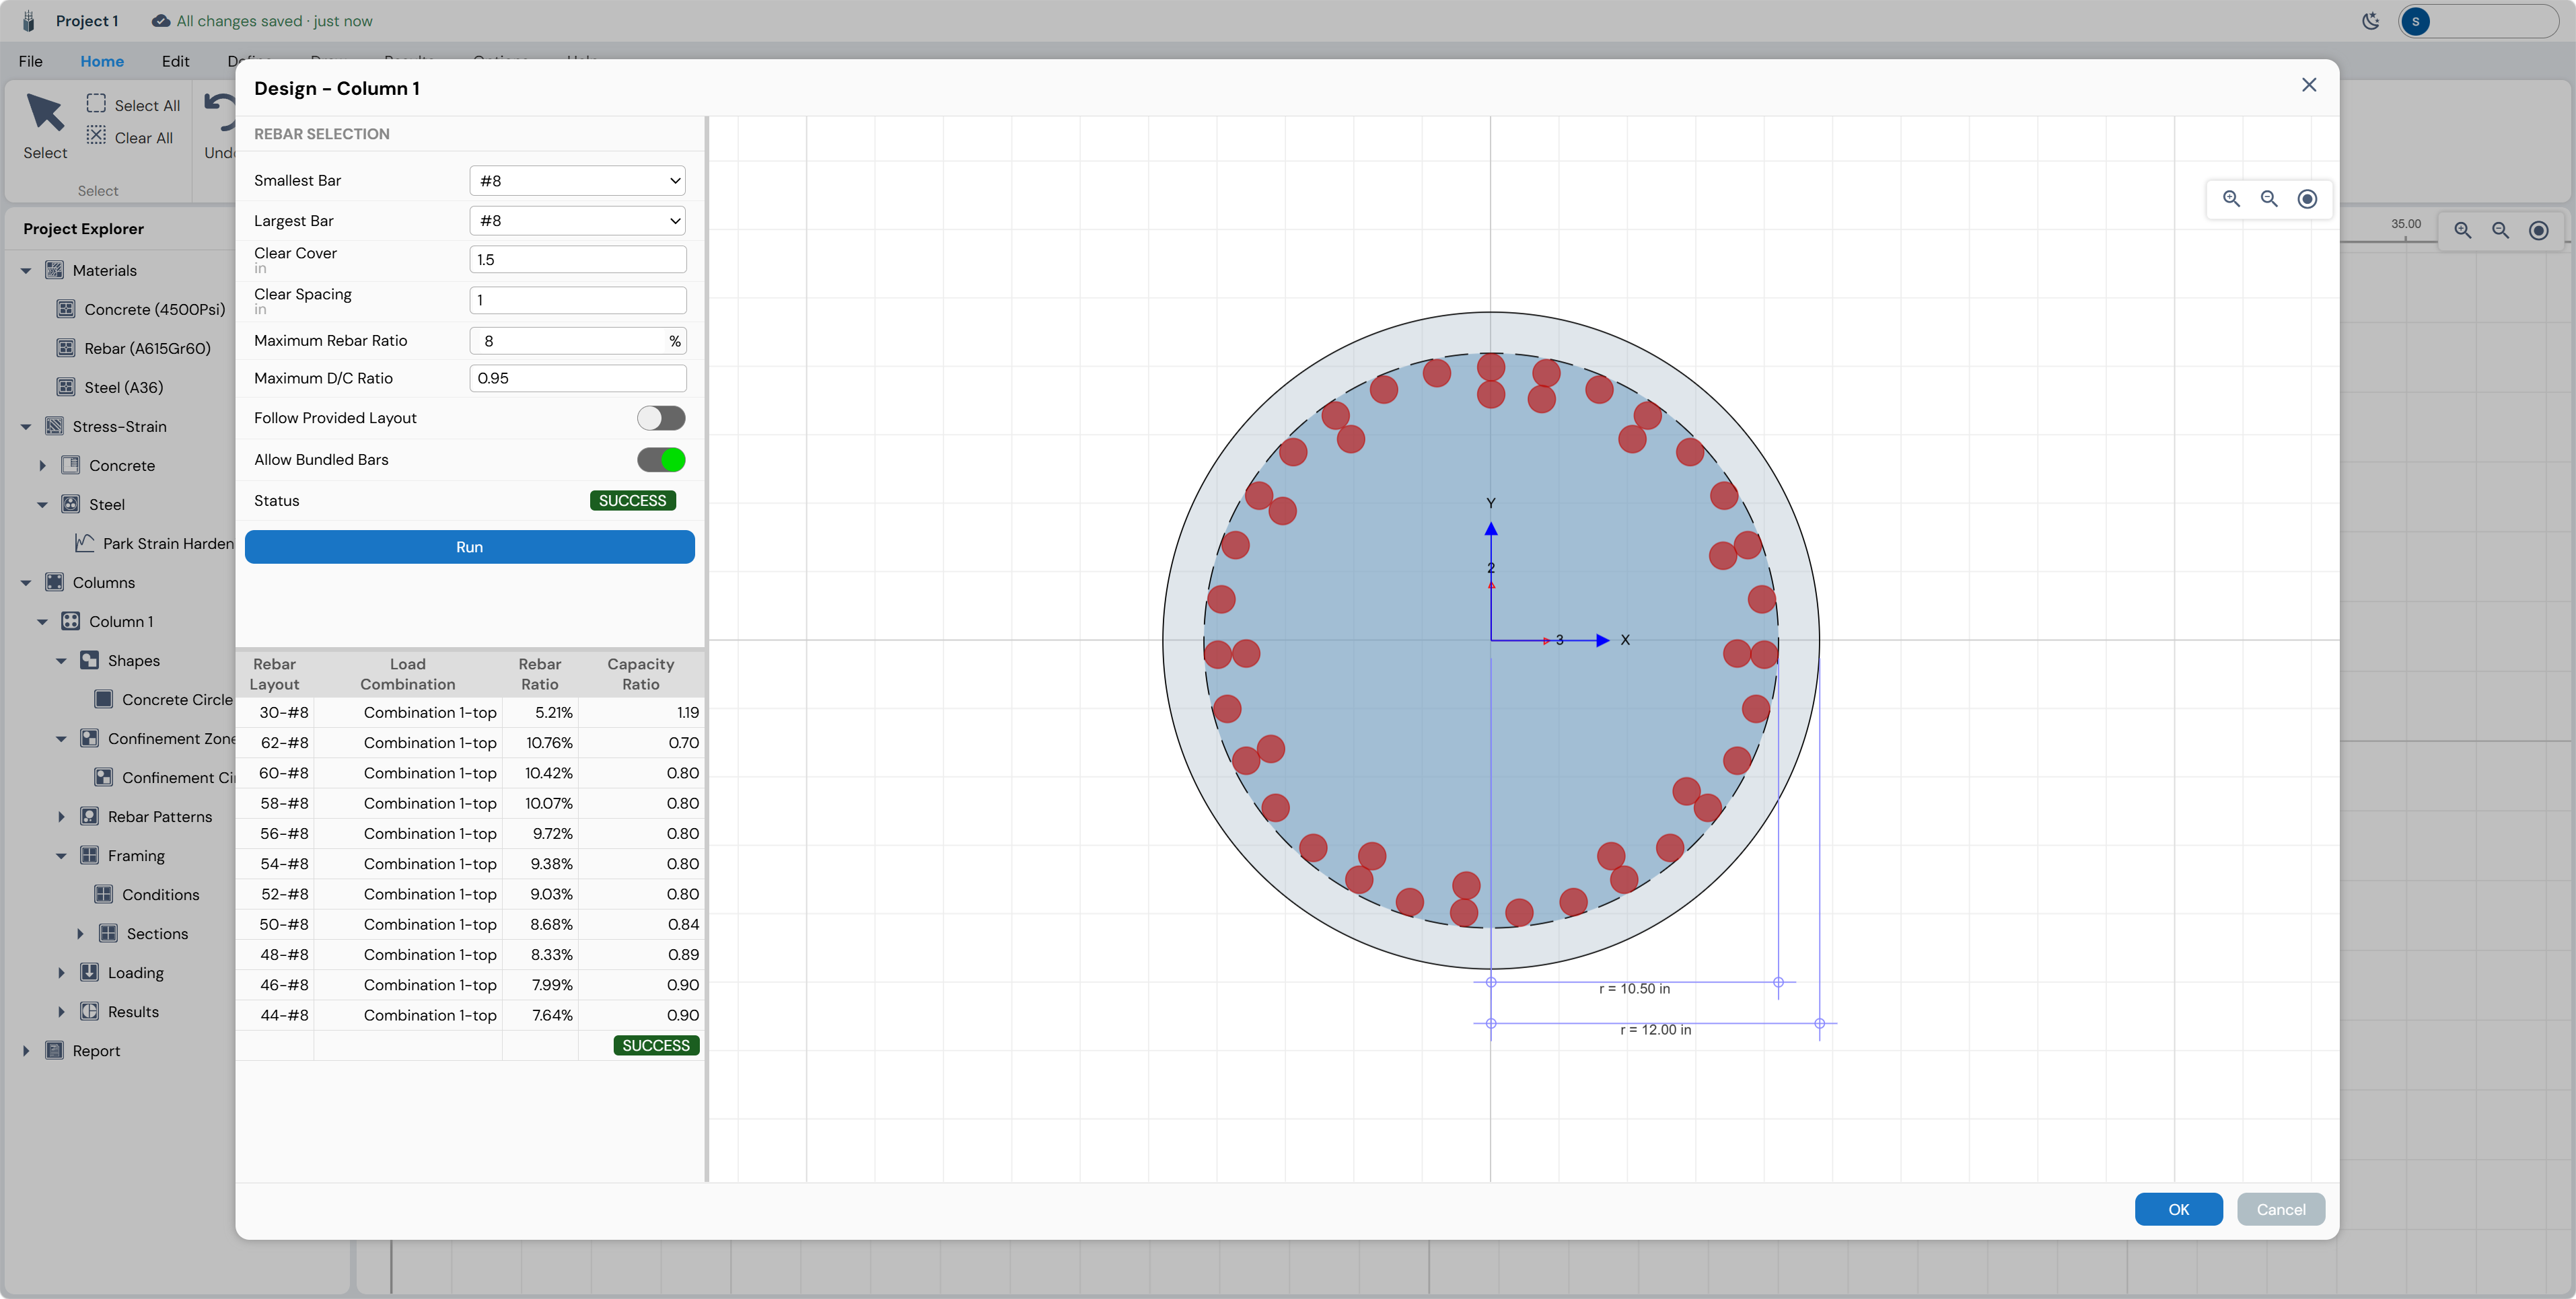
The results table shows four columns: Rebar Layout, Load Combination, Rebar Ratio, and Capacity Ratio. Layouts are ordered by rebar ratio (ascending). Rows with D/C ≤ 0.95 satisfy the design criterion. The status banner at the top changes from “RUN DESIGN” (orange) to “SUCCESS” (green) when at least one valid layout is found or “FAILED” (red) when no valid layout is found.
After clicking OK, the rebar pattern updates on the canvas to reflect the selected Auto Design layout.
Results and Analysis
With all inputs defined and Auto Design applied, click the Results tab in the ribbon to access the full suite of analysis outputs.
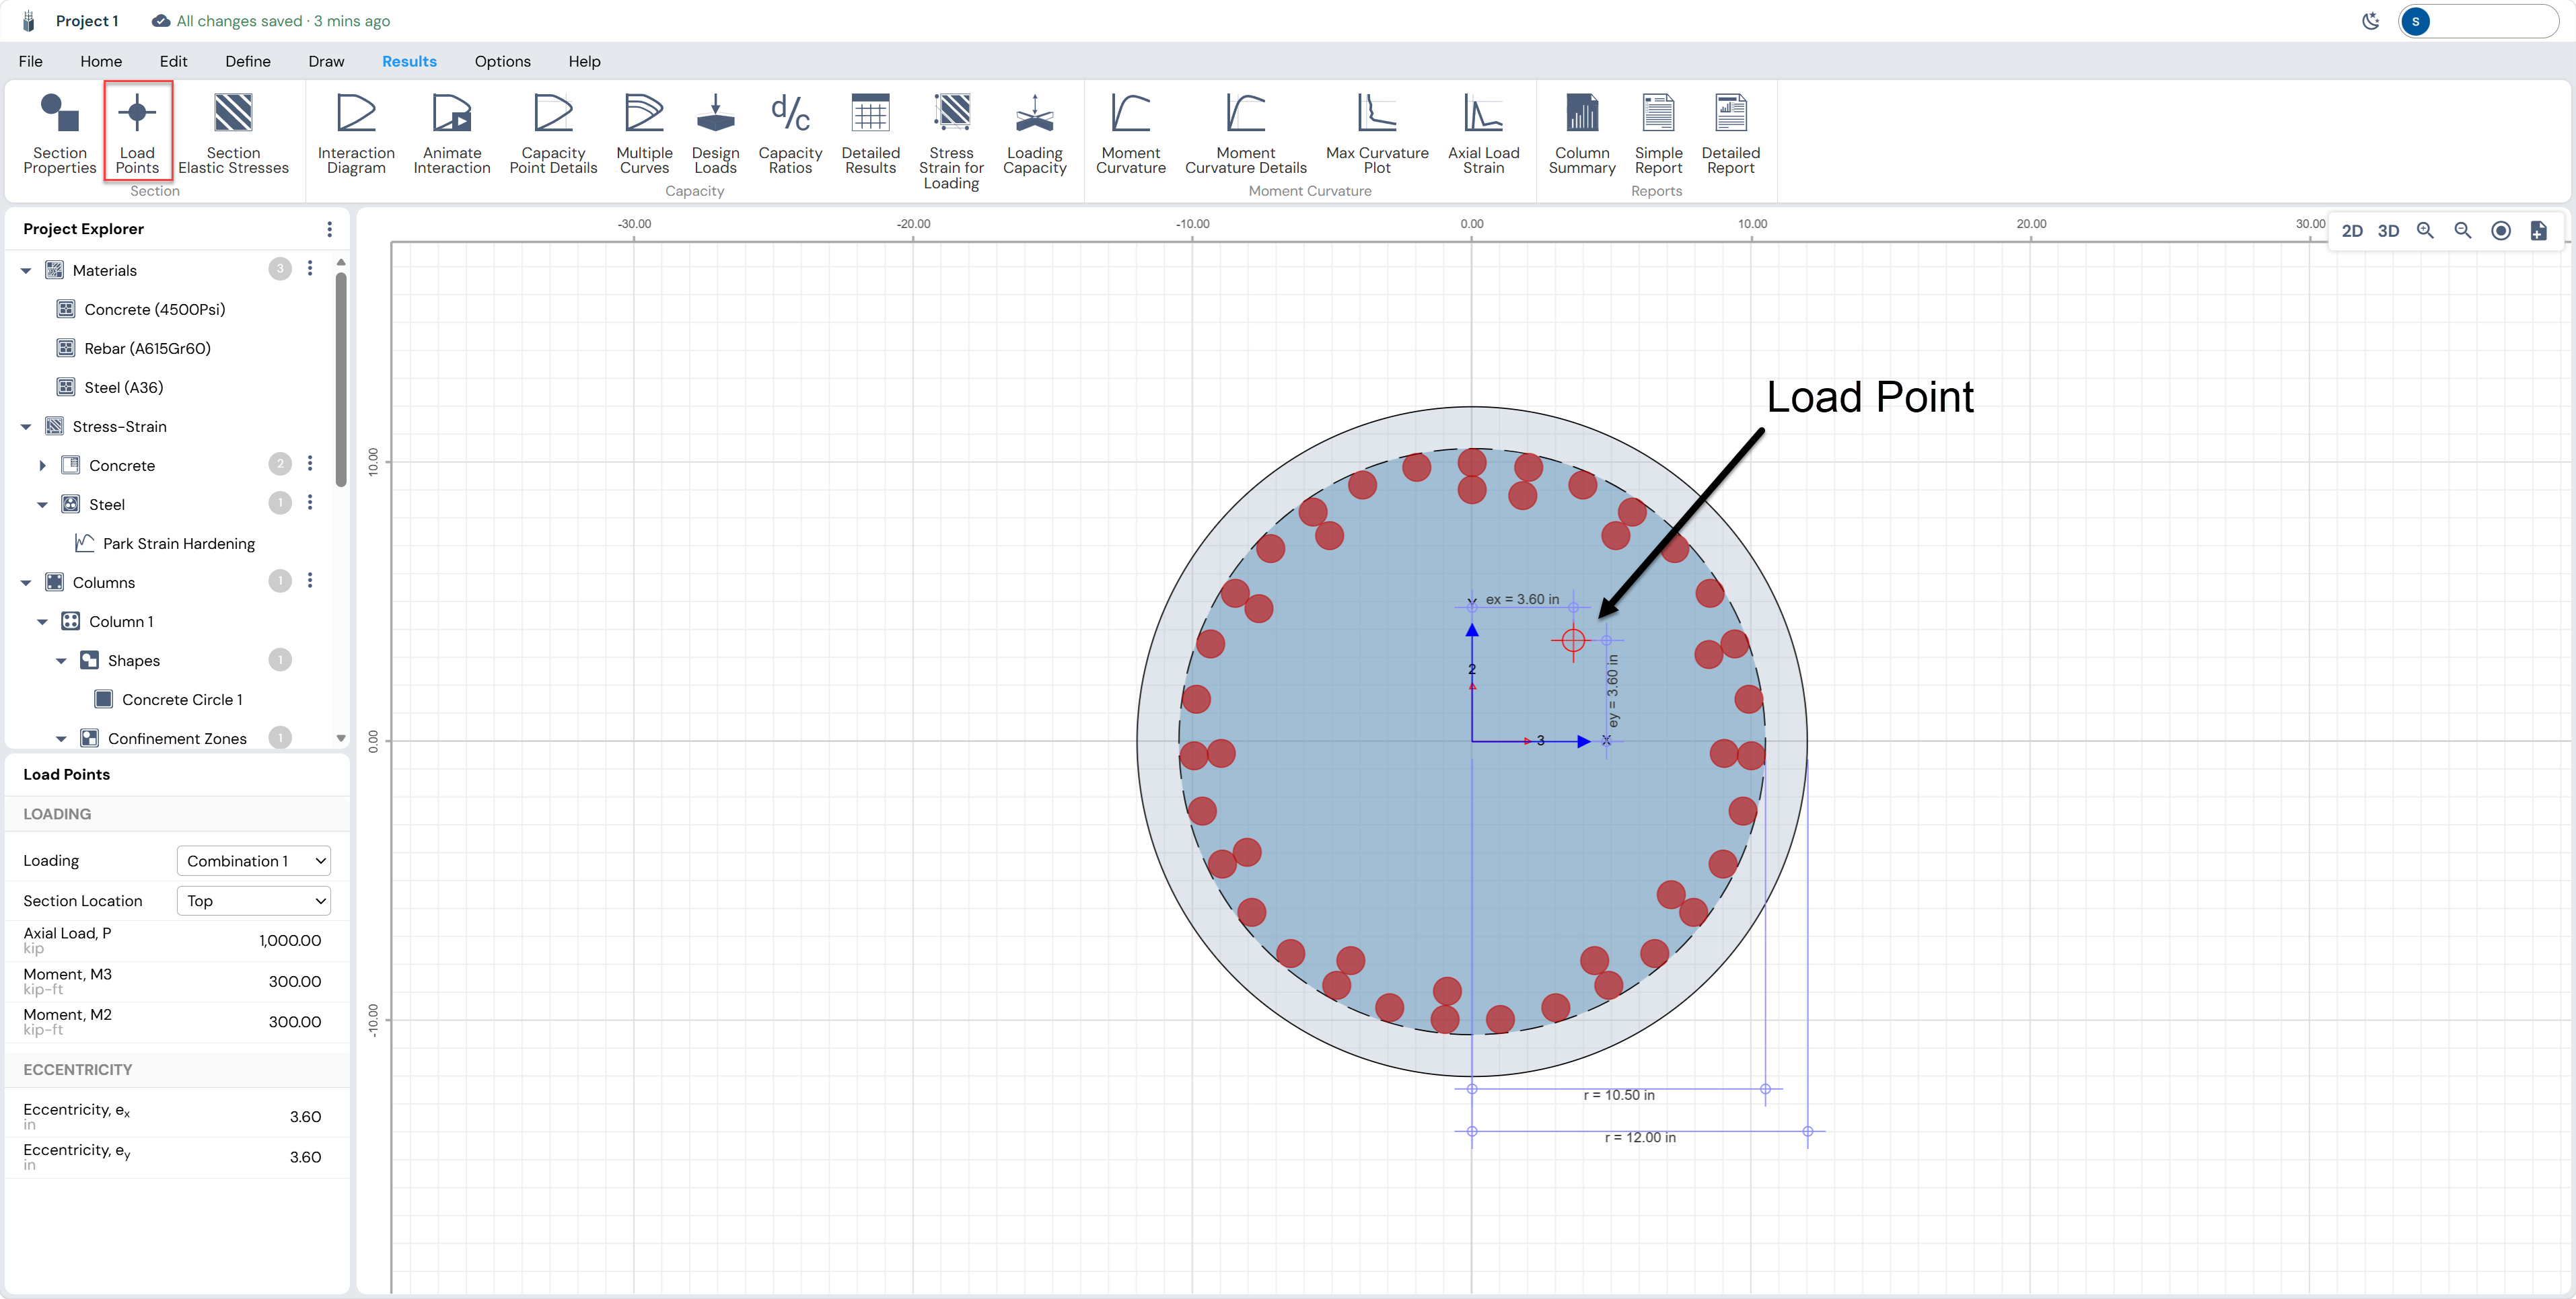
Load Points
Click Load Points in the Results ribbon. The canvas switches to a 2D section view showing the column cross-section with the eccentricity of the applied load combination plotted as a red target marker on the section centroid.
Interaction Diagram
Click Interaction Diagram in the Results ribbon. A split-screen view opens with the 3D interaction surface on the left and 2D P-M curves on the right.
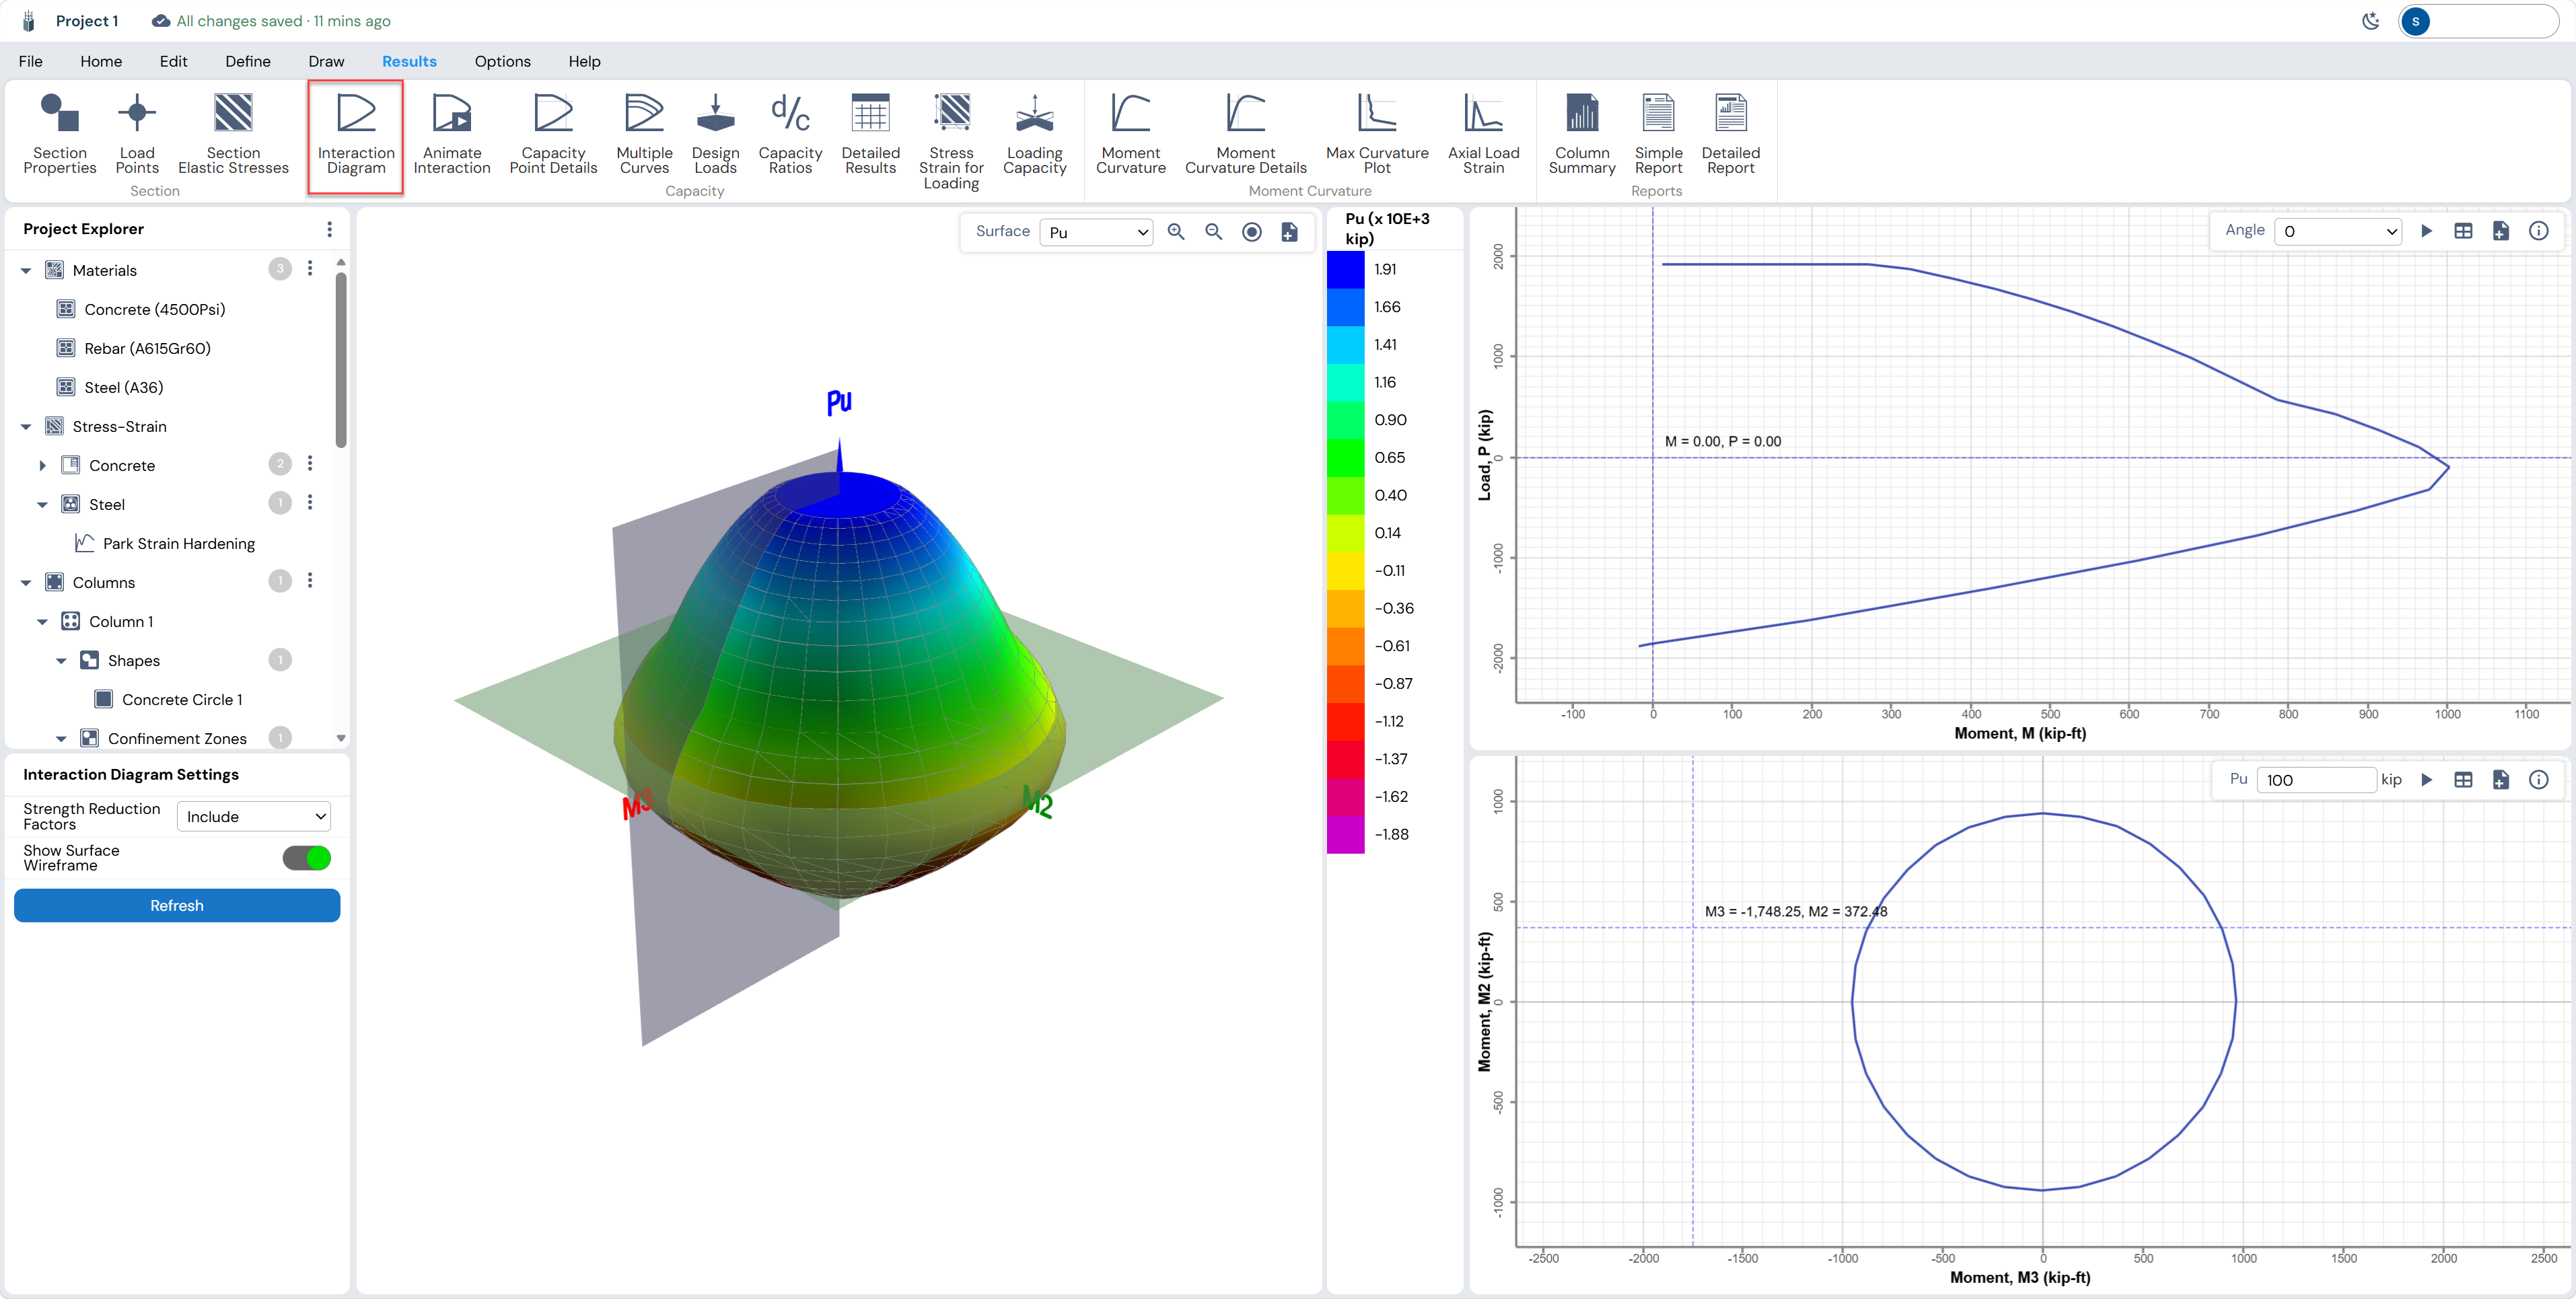
For a circular column the interaction surface is perfectly symmetric in all directions — confirming the rotationally symmetric section. The circular contour plot (bottom-right) is a true circle at any Pu level, unlike a rectangular column which shows an elliptical contour.
Capacity Ratios — Summary
Click Capacity Ratios in the Results ribbon. The Capacity Calculation Summary Results dialog shows the governing D/C ratio for each load combination at both top and bottom ends of the column. The designed section passes the D/C ratio check.
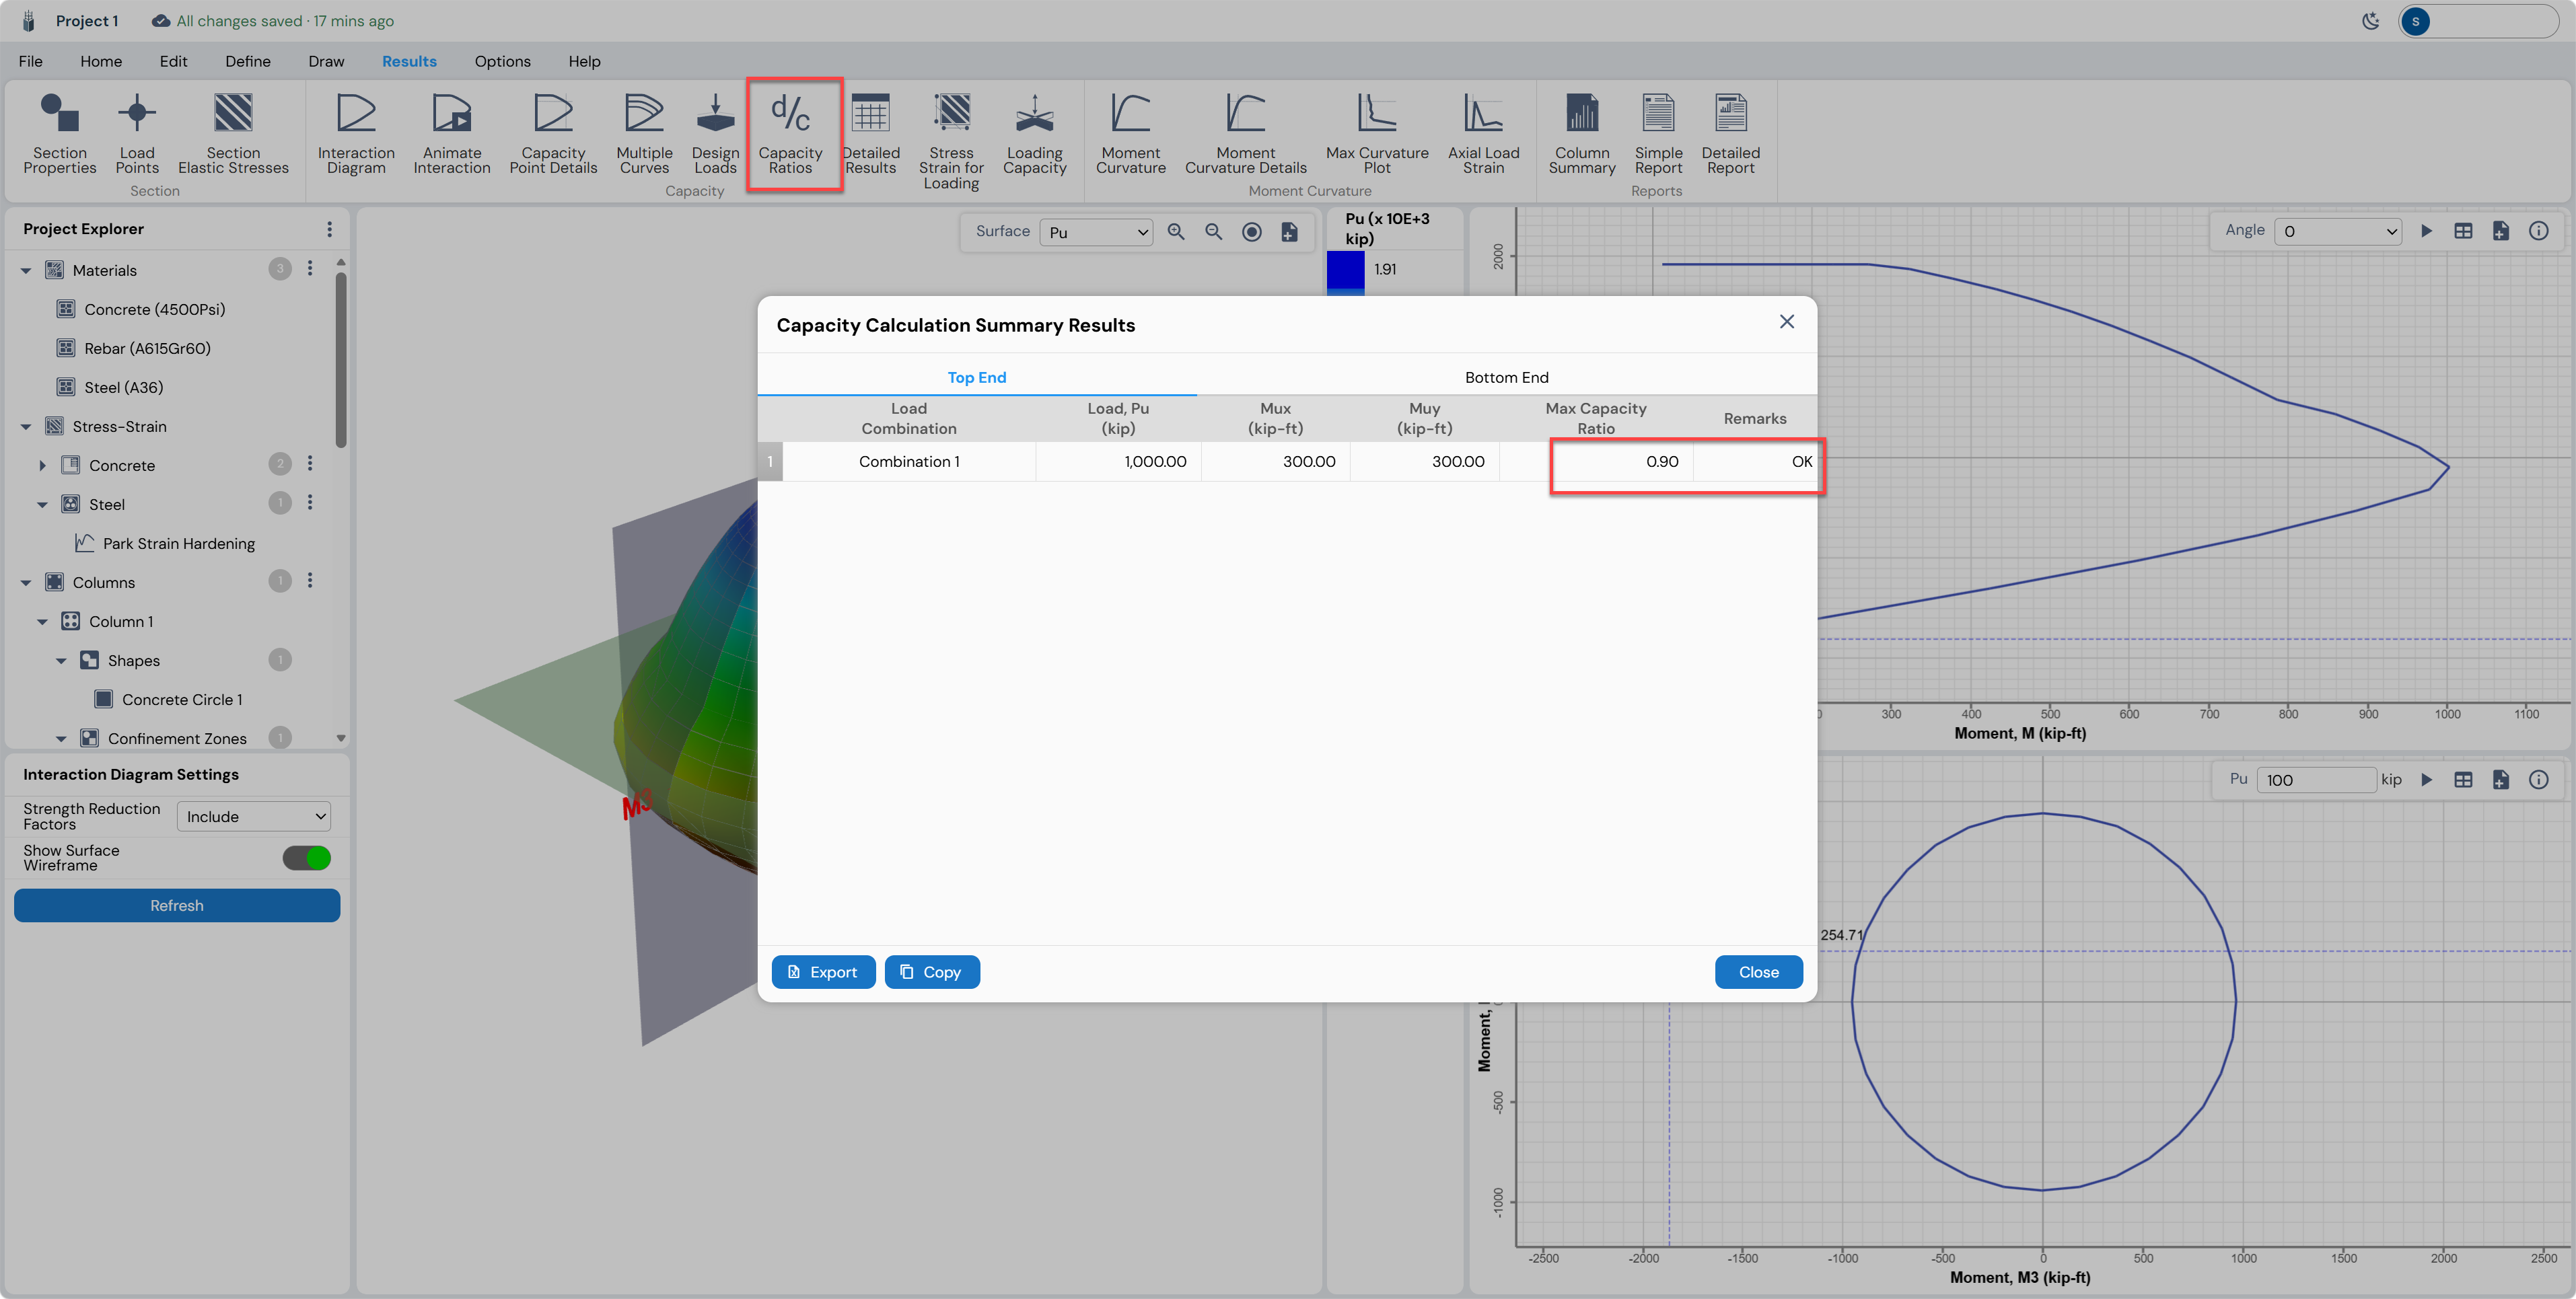
Moment-Curvature Analysis
Click Moment Curvature in the Results ribbon. The diagram shows the moment vs. curvature relationship for the circular section at a specified axial load level. This plot is critical for evaluating section ductility for seismic design.
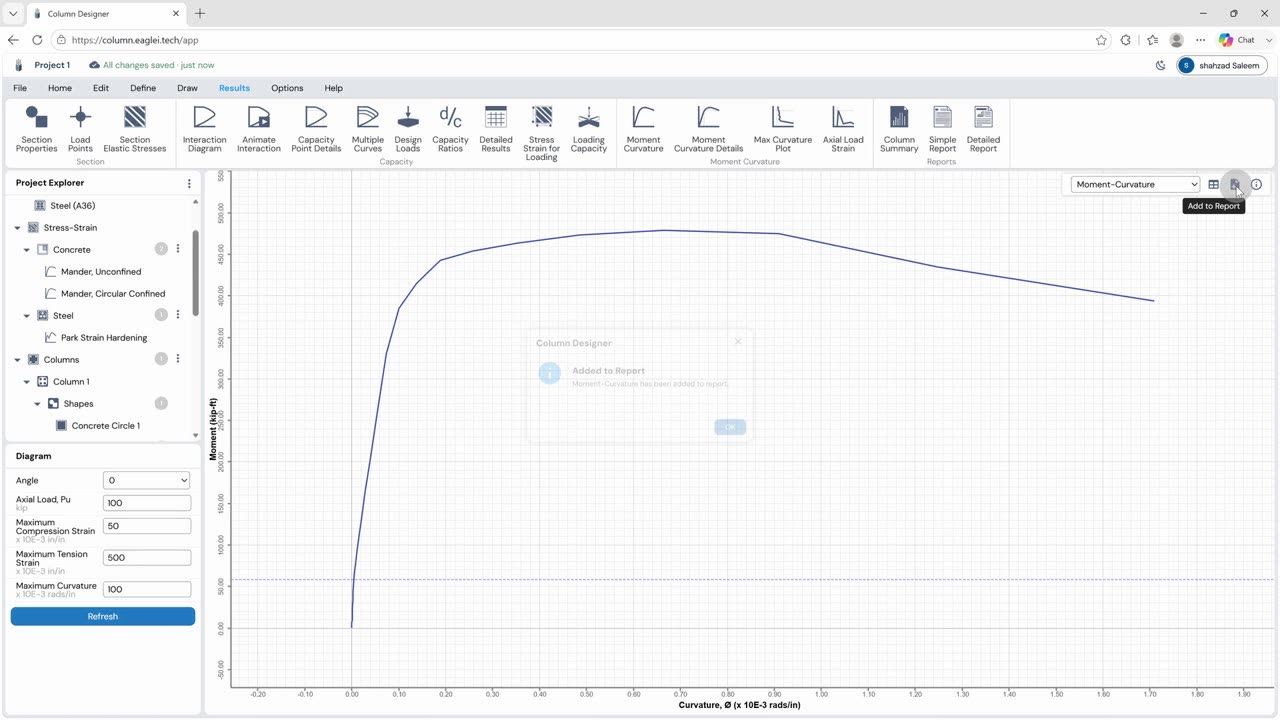
| Tip: Use the “Add to Report” button (printer icon, top-right of any result chart) to include that chart in the final generated report. |
|---|
Finalising the Section
After reviewing results, returns to the Home/Draw tab to make final adjustments. The reinforcement ratio is high and seems congested inside the section. The column radius is updated to 15 in (from 12 in) and the rebar count confirmed as 12-#8 circular.
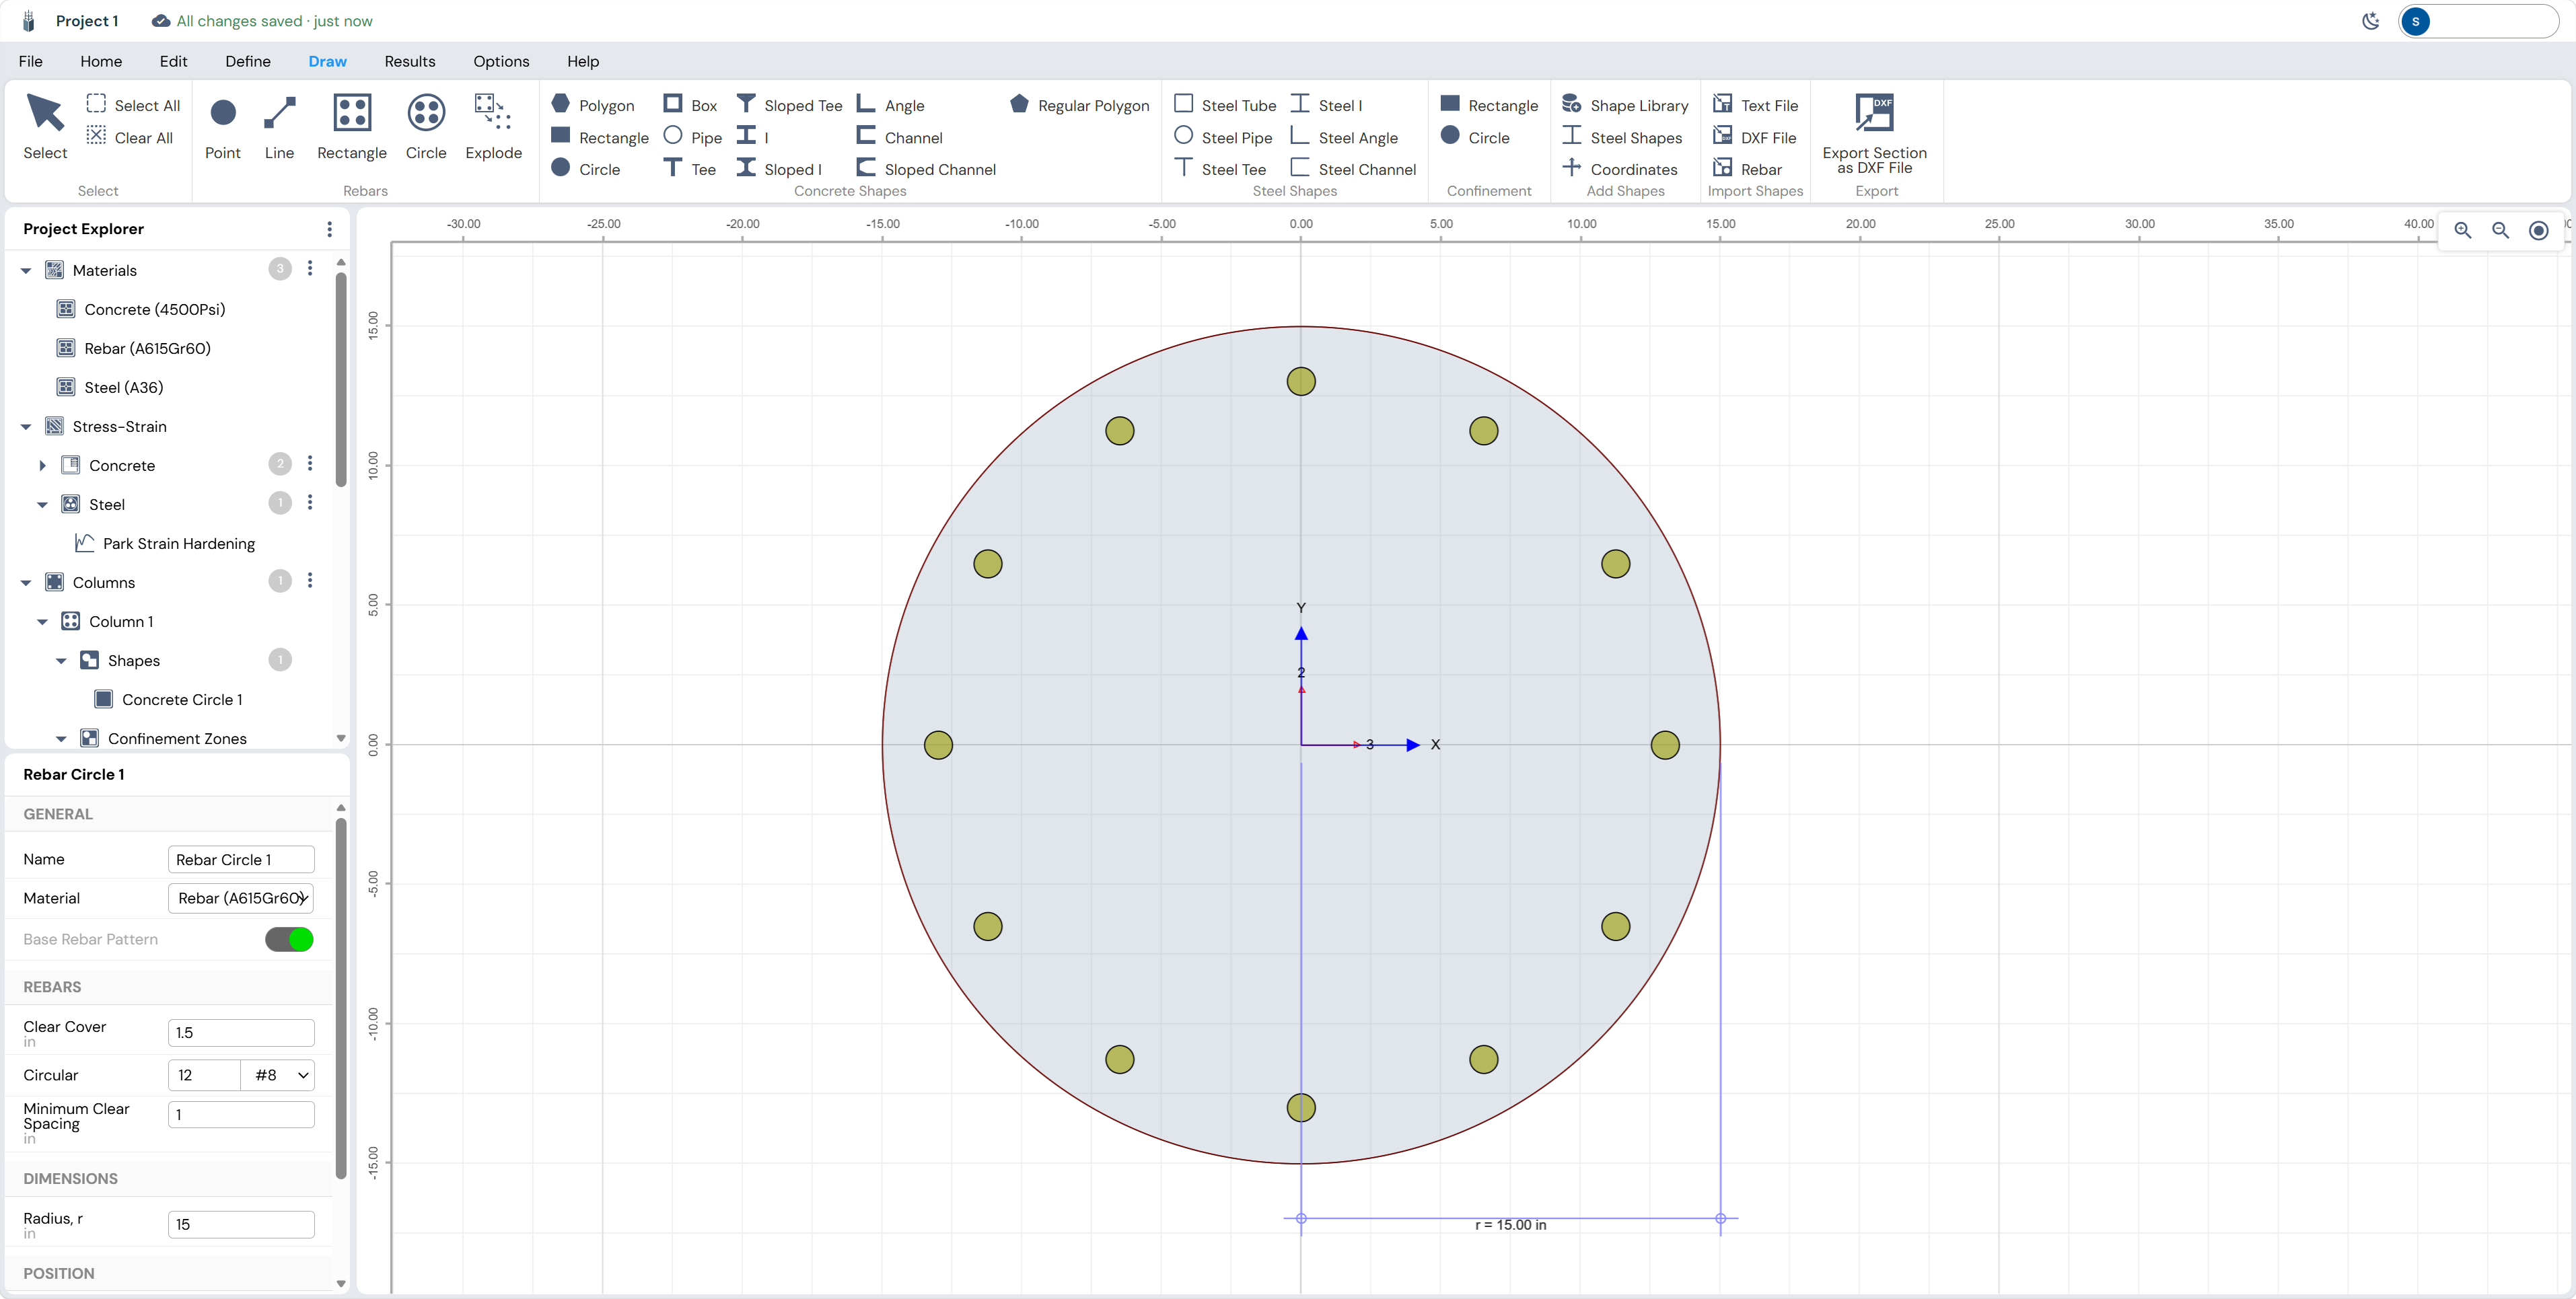
Figure 32 — Draw ribbon showing all shape types available: Point, Line, Rectangle, Circle, Polygon, Box, Pipe, Tee, Angle, Channel, Regular Polygon, Steel sections, and Import options. The concrete circle radius is updated to 15 in.
Use Auto confinement feature to add the confined region.
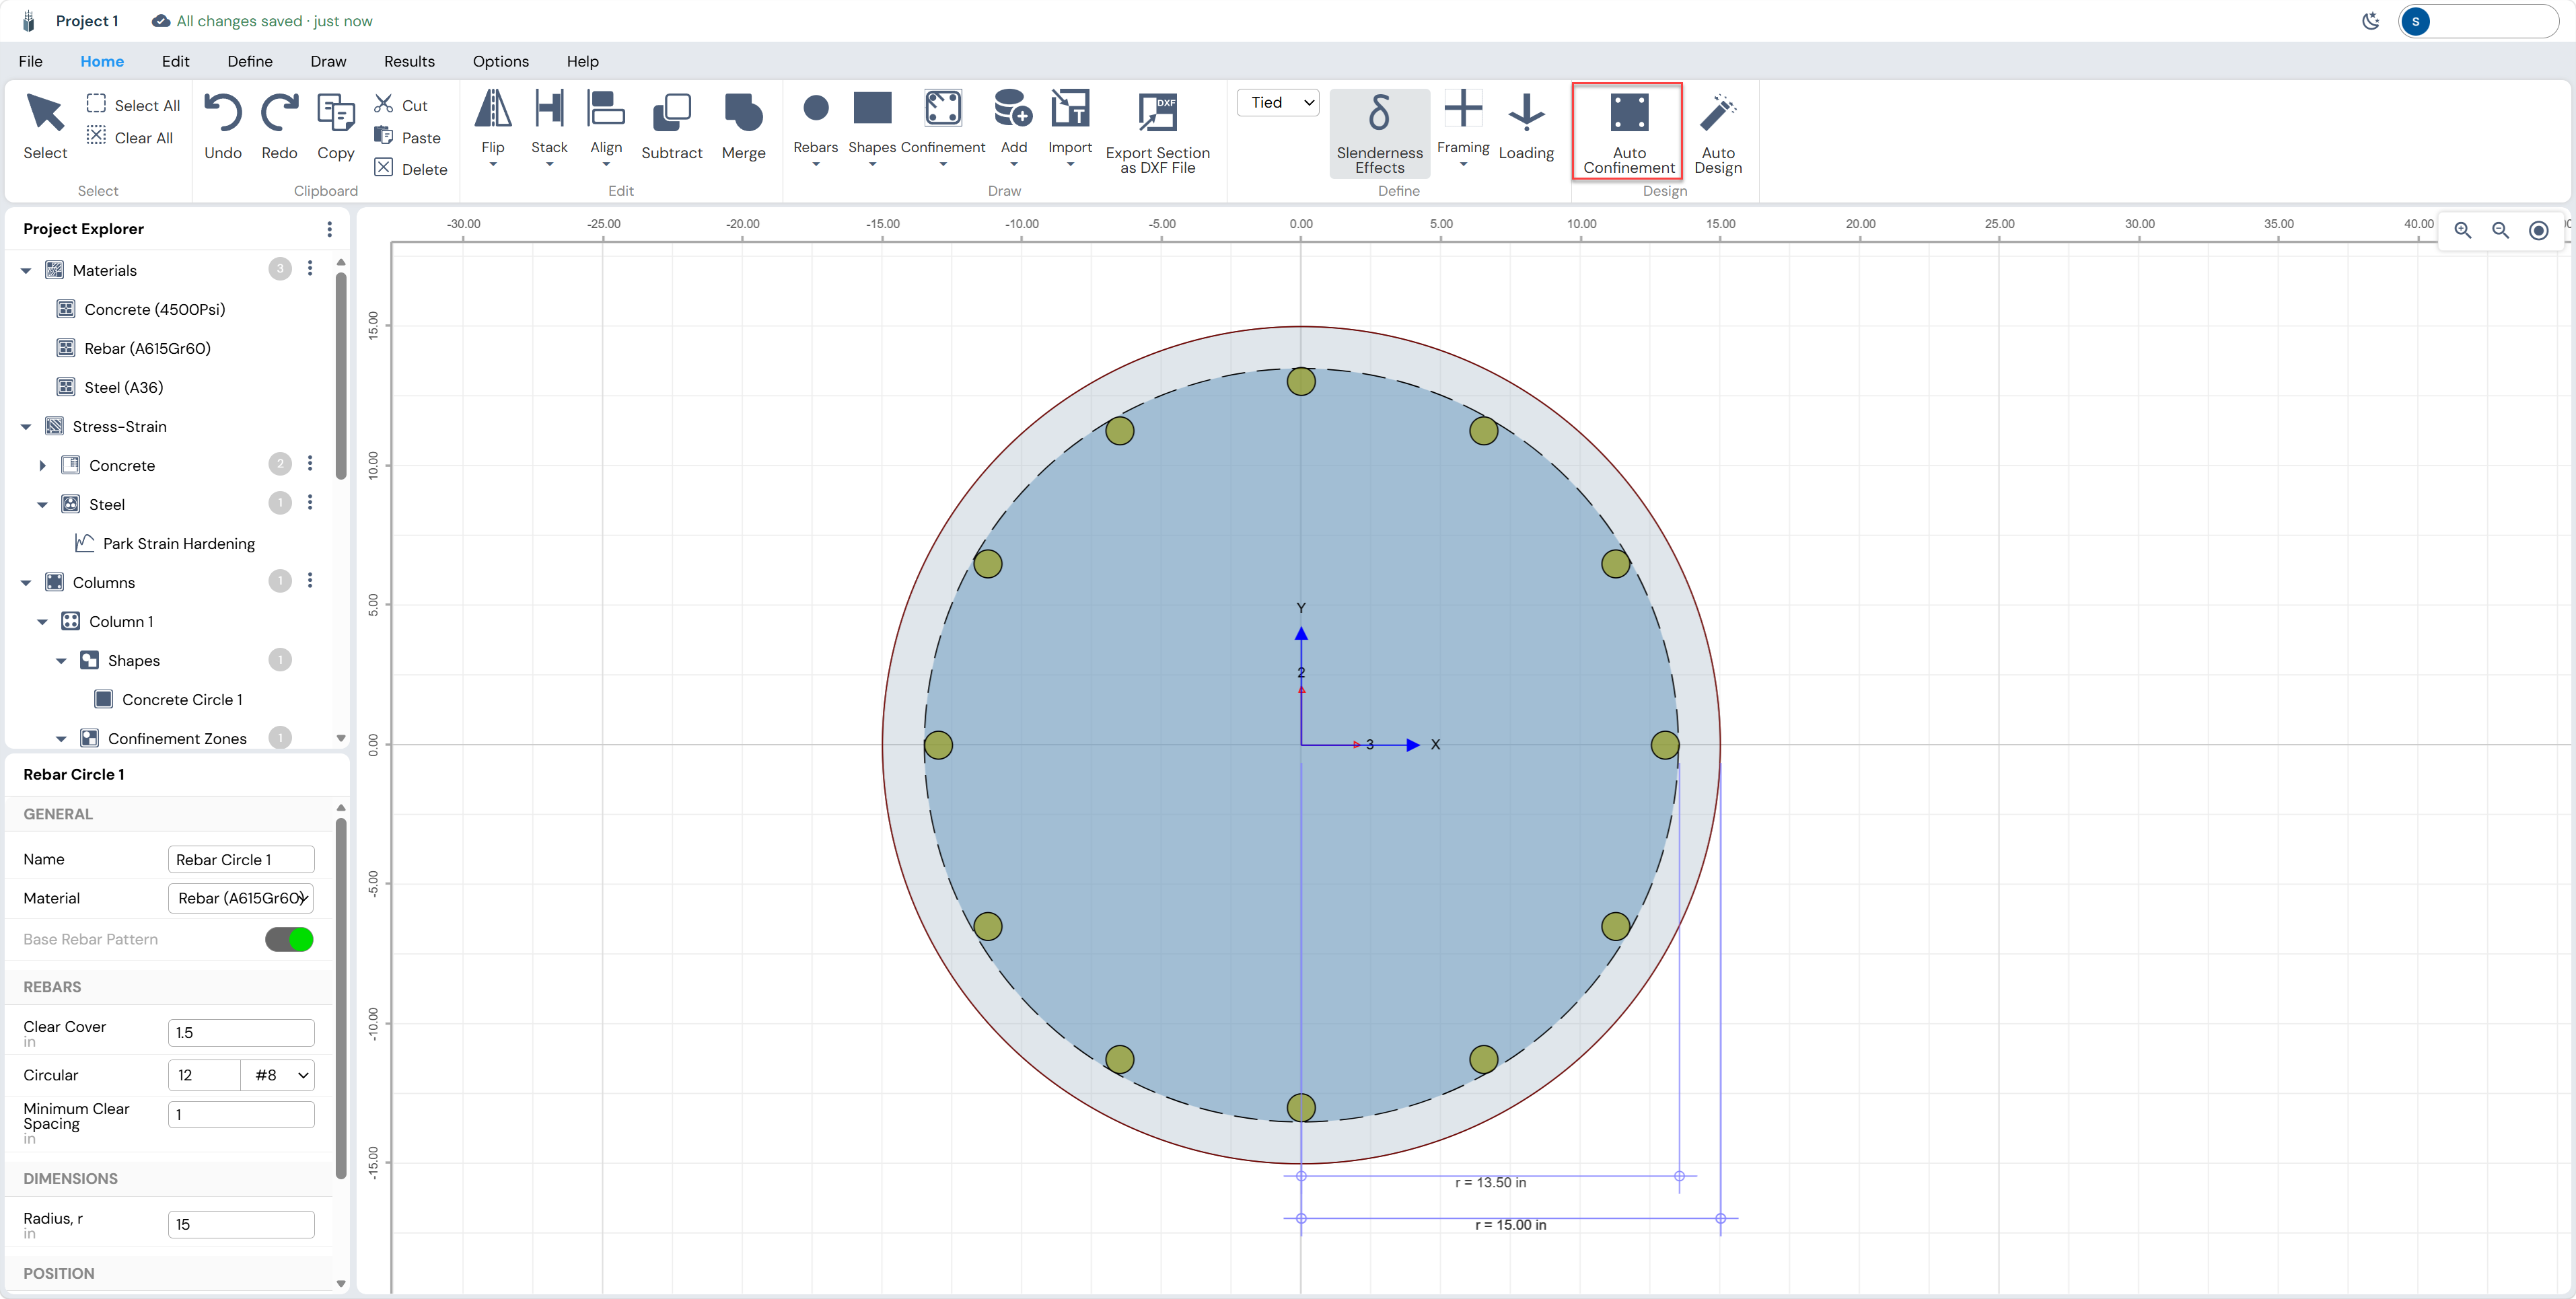
Redesign the section using the Auto Design Feature. The new capacity ratio comes to be 0.94 with longitudinal reinforcement ratio of 1.33%.